


Written by on CSS Wizardry.
Independent writing is brought to you via my wonderful Supporters.
N.B. On 6 June, 2023, I published an updated version of this article. I would encourage you to read Site-Speed Topography Remapped after this.
A couple of years ago, my first few days on a new web performance project were always slow going. So many false starts, tedious workflows, and a complete lack of efficiency really made it difficult for me to find momentum. All through no fault of the client or the project, but through huge flaws in my own approach. In a bid to address this, I introduced a new tool into my arsenal so that I could hit the ground running much faster, and get answers to my clients much sooner.
When first working on a new site-speed engagement, you need to work out quickly where the slowdowns, blindspots, and inefficiencies lie. Unless a client hires you to specifically improve the performance of one page, you’ll need a broad view of the whole site or application. Historically, I’d maybe look at Google Analytics—or a RUM solution if the client had one already—but this is only useful for showing me particular outliers, and not necessarily any patterns across the whole project.

Not only that, but Google Analytics, by default, only reports load times, which are now almost entirely redundant in the field of performance optimisation.
I needed a more holistic way to visualise performance across an entire site, and—ideally—something more useful than load times.
Visualising a whole site
is a little overkill, especially considering
many sites may run to the tens of thousands of pages. Instead, what we can do
for almost every site in the world is split the project into page types. These
page types would also typically correspond to different templates in the
codebase. For example, my site has a homepage, content pages (e.g. my about
page), and article pages, like this one you’re reading right now; an
ecommerce site would have a homepage, a product listings page (PLP), a product
details page (PDP), and a search results page (SRP).
By capturing and comparing the behaviour of these pages alone, we can immediately begin to build up a representative picture of the state of the whole site. And while we may not capture outliers this way, we can still audit those in isolation as a separate body of work if required.
For the sake of the rest of the post, I’ll be auditing an anonymised ecommerce client of mine, but you’ll be able to swap out my page types for your own with ease.
If a picture is worth a thousand words, a waterfall is worth a thousand pictures. Let’s start with the gold standard: WebPageTest.
Any time you run a test with WebPageTest, you’ll get this table of different milestones and metrics. We’re interested in the first seven technical timings, First Byte through Total Blocking Time:

All we need to do now is grab this information for each of our pages and paste it into a spreadsheet. If you’d like a copy of the exact spreadsheet I use, you can get hold of it here.

With this suite of numbers, I can now begin to make assessments.
I can see from the screenshot above that TTFB is my most stable metric—no one page appears to have particularly expensive database queries or API calls on the back-end. Conversely, LCP is far more erratic, meaning that we are likely to have highly different content page to page (the metric isn’t bad, per se, it’s highly variable), and that it’s potentially not equally optimised or delivered. Everything else is a shade in between, and at this stage offers no real insights. It’s when we begin to graph the data that useful patterns emerge.
In a separate sheet—available at the same link as before—I’ve simply graphed the data by page type.
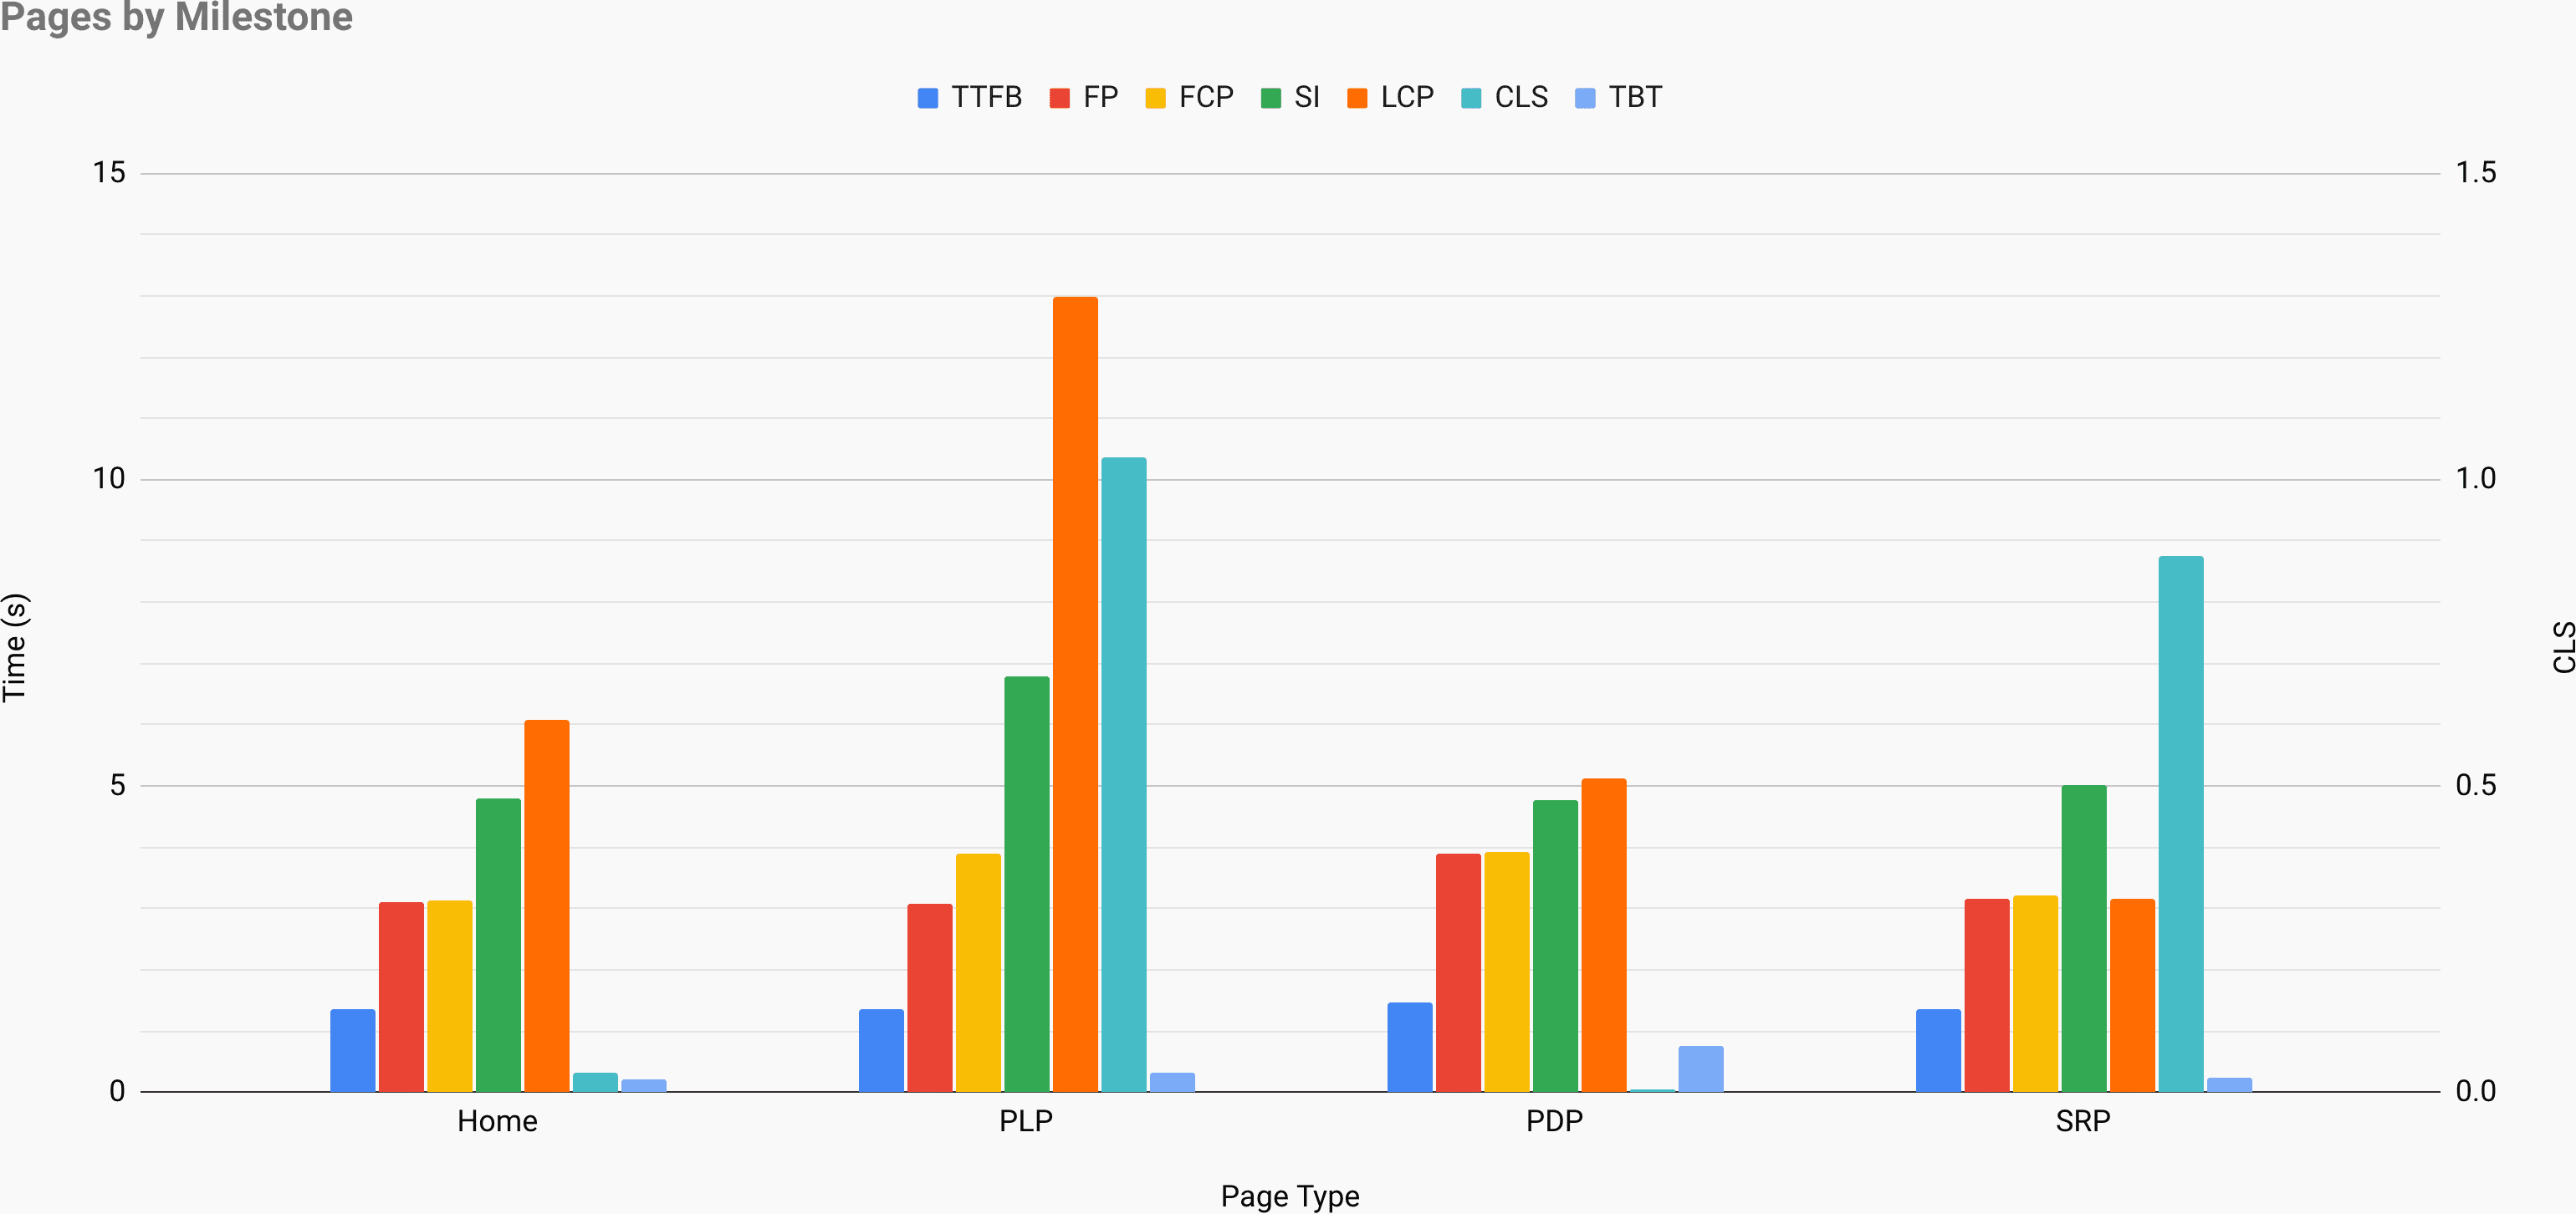
It might be a good idea to open the above graph image up in a new tab and keep it handy during the rest of this post.
The whole point of the exercise that follows is to allow me to move quickly, spotting patterns from afar, and not having to do any slow or meticulous work yet. I want to be able to form hypotheses and draw conclusions without viewing a single URL or a line of source code. That work is what comes next.
For now, I’m usually sat with a coffee, some tunes on, and an old-school pen and paper making notes. What I’m hoping to ascertain is where I need to look first when I get into the audit proper. I want to rule out any dead ends or false starts. I want to maximise the work not done.
Let’s dig in!
Firstly, I want to compare whole pages at a time. Immediately, I can see that the PLP is by far the worst offender. Almost all of its bars are higher than other pages. This means that I will likely end up giving it a little more attention than the others. Next, the other three pages are pretty similar with the homepage being marginally worse.
Next, I’ll look for any individual outliers or extremities. Right away I can see that we have an outlying Largest Contentful Paint on the homepage and an outlying Cumulative Layout Shift on the search results page. With my pen and paper, I’ll make a note of investigating these specifically in my testing.
After extremities, I’d like to actually find consistencies. Once again noting that TTFB is very consistent—as seen in the table view—I can draw the conclusion that back-end time (and whatever else might be happening in there) is uniformly consistent across each page type. This means that I likely don’t need to do any specific work on any individual pages, but also suggests that any general back-end improvements I make in area A will also be felt in locations B and C, too. But perhaps most importantly, the stability of TTFB means that all subsequent milestones are measured from a very reliable baseline—I don’t need to make any on the fly adjustments to other metrics in order to cross reference them. Put another way, if one page’s TTFB was an entire second later, I’d need to account for that second when comparing deltas between any of the bars.
Which brings me onto the next bit: deltas. This is where you’ll find some really fascinating insights that can run surprisingly deep.
Gaps between TTFB and First Paint can, by and large, be considered your critical path. This is basically how many render blocking resources each page has. Of course, it’s a little more complex than that, but for this exercise it’s an incredibly reliable proxy. Now here’s where it gets really interesting:
If all of our TTFBs are pretty identical, then any erroneous FPs are
indicative of a different amount of render blocking resources. Given that render
blocking resources reside in the head of the document, this implies differing
head tags on that page. Note that the PDP’s FP is almost a second slower than
other pages? I think the PDP has something different about it. Is it simply an
additional render-blocking resource or two? Or, perhaps a more extreme scenario
is that it has entirely different head tags? Maybe this is an entirely
different application? It’s not unheard of.
The next thing I want to focus on is deltas between First Paint and First Contentful Paint. FP is defined as the first pixel, no matter what it is, being put on the screen. FCP, on the other hand, is the first image- or text-pixel rendered to the screen. Note that most pages share near-identical FP and FCP? This is a strong suggestion that a page is either:
font-display for its web fonts, or;Basically, the first- and first-contentful paints being identical tells us that some text or imagery was rendered in the very first pass. This also means that if we manage to improve FP, we’re likely to improve FCP for free!
The PLP, however, does show a difference between the two. I’ll make a note in my pad to investigate font-loading strategies on this page (font-based issues are, in my experience, more common than image-based one, though I won’t rule it out completely).
Now, let’s move on to gaps between First Contentful Paint and Speed Index. SI is a measure of the visual completeness of above the fold content over time. It’s a little more complex than that, but it’s basically dealing with visual progress. The larger the gap between FCP and SI, the longer the tail of visual completeness is. That is to say, you may have many different regions of content in the viewport that all render at different times, opposed to all popping in at once. This may or may not be desirable depending on how you’ve designed the ATF experience: you shouldn’t lazy-load anything ATF, but skeleton screens might negatively impact your SI despite being an ultimately better experience. Generally all I’m looking our for here are any long tails that suggest I’m under prioritising above the fold content.
More interestingly, let’s take a look at Speed Index vs. Largest Contentful Paint. This is a little harder to explain, but for the most part, a large gap between SI and LCP suggests that your largest contentful paint was one of the last above the fold paints—there was a large region missing for a long while, and its late arrival is apparent in the large gap. On the other hand, a small gap suggests that your largest contentful paint was relatively early, but a smaller ATF paint is pushing your SI out—e.g. a late-loaded chat client, or a small cookie banner, etc. Ultimately, this gap might be telling me about how the nature of the ATF content came together: was it a single large region that painted late, or was it a long tail of smaller regions pushing metrics the other way?
This means we can infer from the graph that a large but late-rendered region on the PLP is pulling out our Speed Index, but a high SI and low LCP on the SRP means we’re likely dealing with a long-tail rendering problem which is less associated with a large region.
Next up, let’s look at Cumulative Layout Shift and other milestones. While CLS is a Core Web Vital, it’s not a milestone measured in timings. Instead, it focuses on layout stability, which is actually not much at all about speed. That said, we can still join some dots. It’s quite obvious to me that huge LCP on the PLP is pushing out our CLS—whatever content is late to render doesn’t have any placeholder or skeleton. However, and slightly more obscure, the high CLS on the SRP is not joined by a high LCP. This suggests two possible scenarios:
width or height attributes, meaning that while they aren’t part of one
LCP, lots of small images are nudging the layout around. This confirms the
long-tail rendering suspicion we came up with before, and is certainly a
behaviour that would contribute to a high CLS.Finally, Total Blocking Time cannot be reliably or meaningfully compared
against many other metrics as other milestones (except CLS) are network-bound
and TBT is CPU-bound. The only correlation one might draw would be between
a large TTFB–First Paint delta and a heightened TBT metric. Remember, a large
gap between TTFB and FP is indicative of more synchronous assets in the
head—if TBT goes up as well, it’s more likely that those assets are JS and not
CSS. More often than not, I would simply view TBT in isolation.
All of this information gleaned without having to visit a single page or view a single line of source code. I didn’t need to pick through a single bit of DevTools! This is the approach I take on every new audit project so that I can quickly identify what issues might need investigation first, what liabilities might be where, and more importantly, what work I can avoid doing.
Being able to gather this many clues so quickly sets me up incredibly well ahead of digging into the project fully; it tells me exactly where to look first. This entire exercise is a great way of knowing where to start, which was always one of the most tricky parts of the process for me.
此内容由惯性聚合(RSS阅读器)自动聚合整理,仅供阅读参考。 原文来自 — 版权归原作者所有。