


Written by on CSS Wizardry.
Independent writing is brought to you via my wonderful Supporters.
A lot of companies—even if they are aware that performance is key to their business—are often unsure of how, when, or where performance testing sits within their development lifecycle. To make things worse, they’re also usually unsure whose responsibility performance measuring and monitoring is.
The short answers are, of course ‘all the time’ and ‘everyone’, but this mutual disownership is a common reason why performance often gets overlooked. When something is everyone’s responsibility, it normally becomes no one’s responsibility.
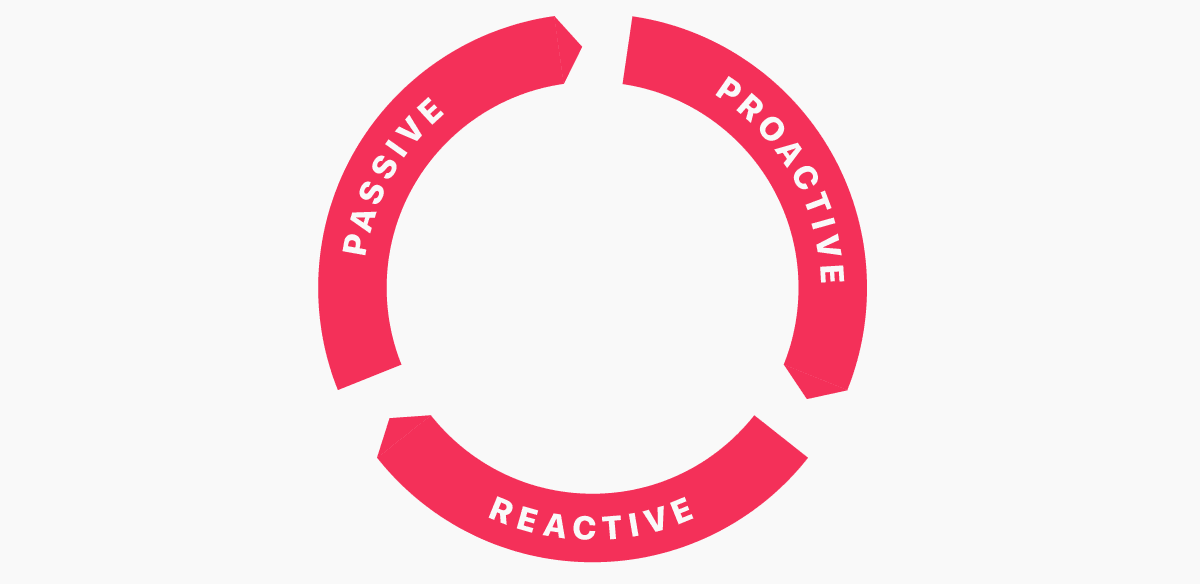
To combat this, and make performance testing regular and routine, I try to distill the types of testing that we do into three distinct categories: Proactive, Reactive, and Passive. Each have their own time, place, purpose, focus, and audience. Simply knowing the different forms of performance testing that we have available to us, and where they sit in the product development process, makes it much easier for businesses to adopt a performance strategy and keep on top of things.
In this short post, I want to introduce you to these three types of testing, how and when they should be carried out, and what their aims and outcomes should be. Each kind of testing is listed chronologically—that is, you should do them in order—but all complement each other, and will ultimately feed into one another.
A lot of the time when auditing client sites, many of the issues and inefficiencies I uncover could have quite easily been discovered by the development team themselves. The problems could be been identified, nipped in the bud, and never have made it in front of a customer at all if they’d just known where to look!
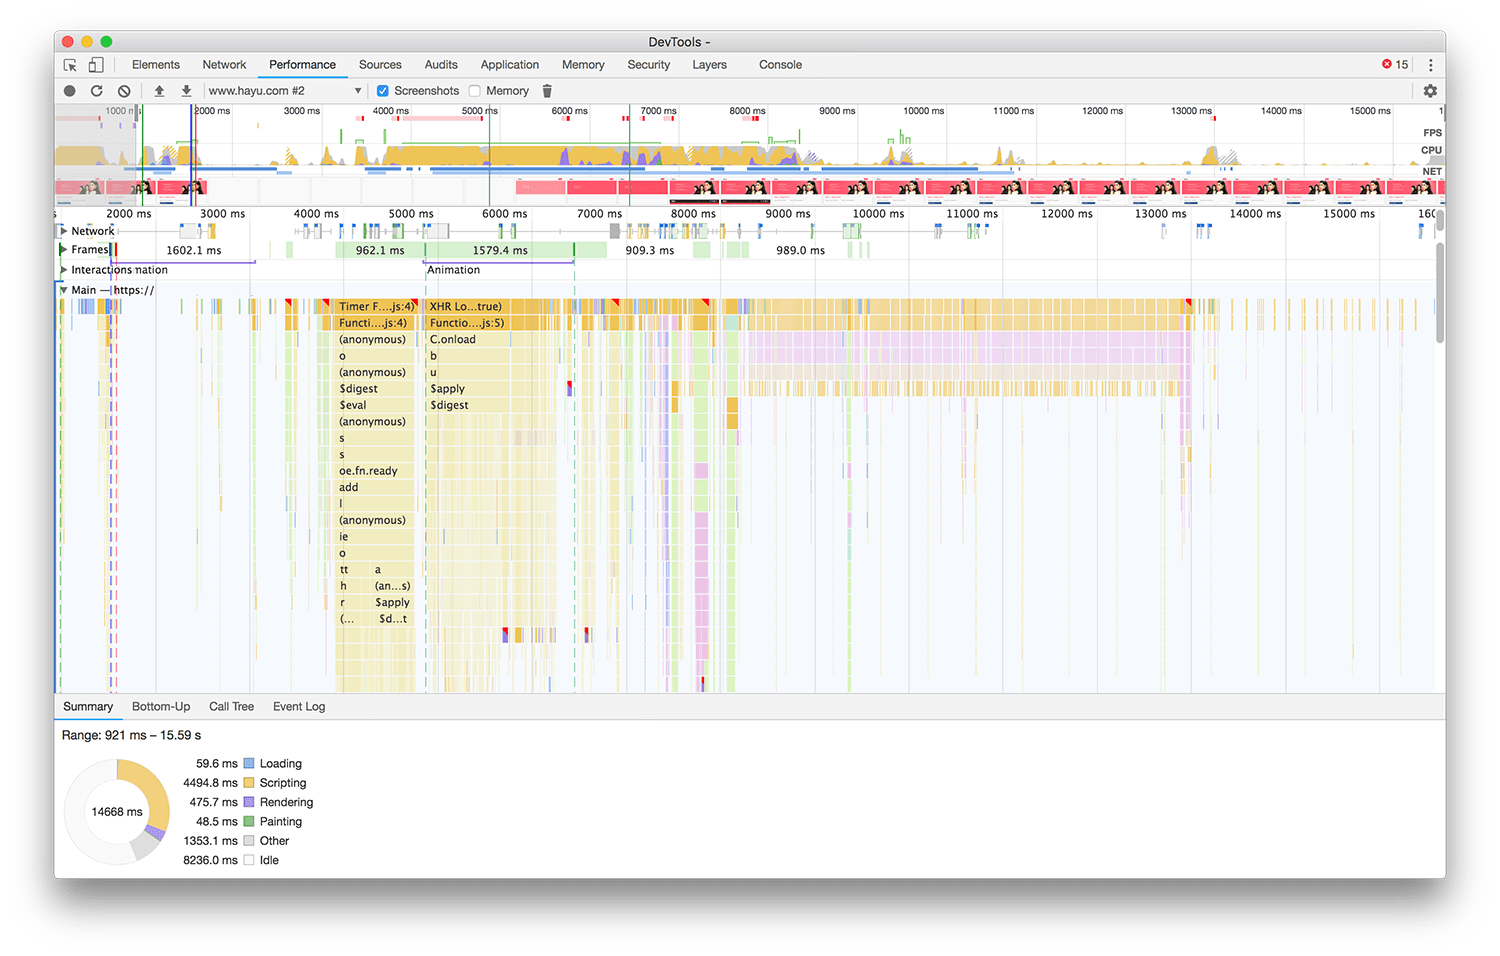
The first kind of testing a team should carry out is Proactive testing: this is very intentional and deliberate, and is an active attempt to identify performance issues.
This takes the form of developers assessing the performance impact of every piece of work they do as they’re doing it. The idea here is that we spot the problem before it becomes problematic. Prevention, after all, is cheaper than the cure. Capturing performance issues at this stage is much more preferable to spotting them after they’ve gone live.
The reason I refer to this as Proactive testing is becasue we generally do need to go out of our way to spot the problems. Things always always feel fast when we’re developing because, more often than not, we’re working on high-spec machines on dedicated networks, and also serving from localhost which removes the bulk of the latency and bandwidth issues that a real user would suffer.
Unfortunately, most issues do not get captured at this point. This is good news for me, because I get paid to come in and fix them, but businesses would save—and indeed make—a lot more money if they caught all of their performance issues here. It is vital, therefore, that engineers have a firm understanding of performance fundamentals, as well as a solid command of their tools.
This phase of testing is usually quite forensic, and isn’t normally very business-facing: the wider organisation doesn’t need to know about any bottlenecks, because they don’t exist in the product yet.
My involvement with clients here is usually workshops and training: teaching developers the knowledge and tooling required to effectively conduct performance audits, and making teams self-sufficient.
Of course, it is impossible to fix (or even find) every performance issue during the development phase. Therefore, we introduce a slightly more defensive style of testing: Reactive testing.
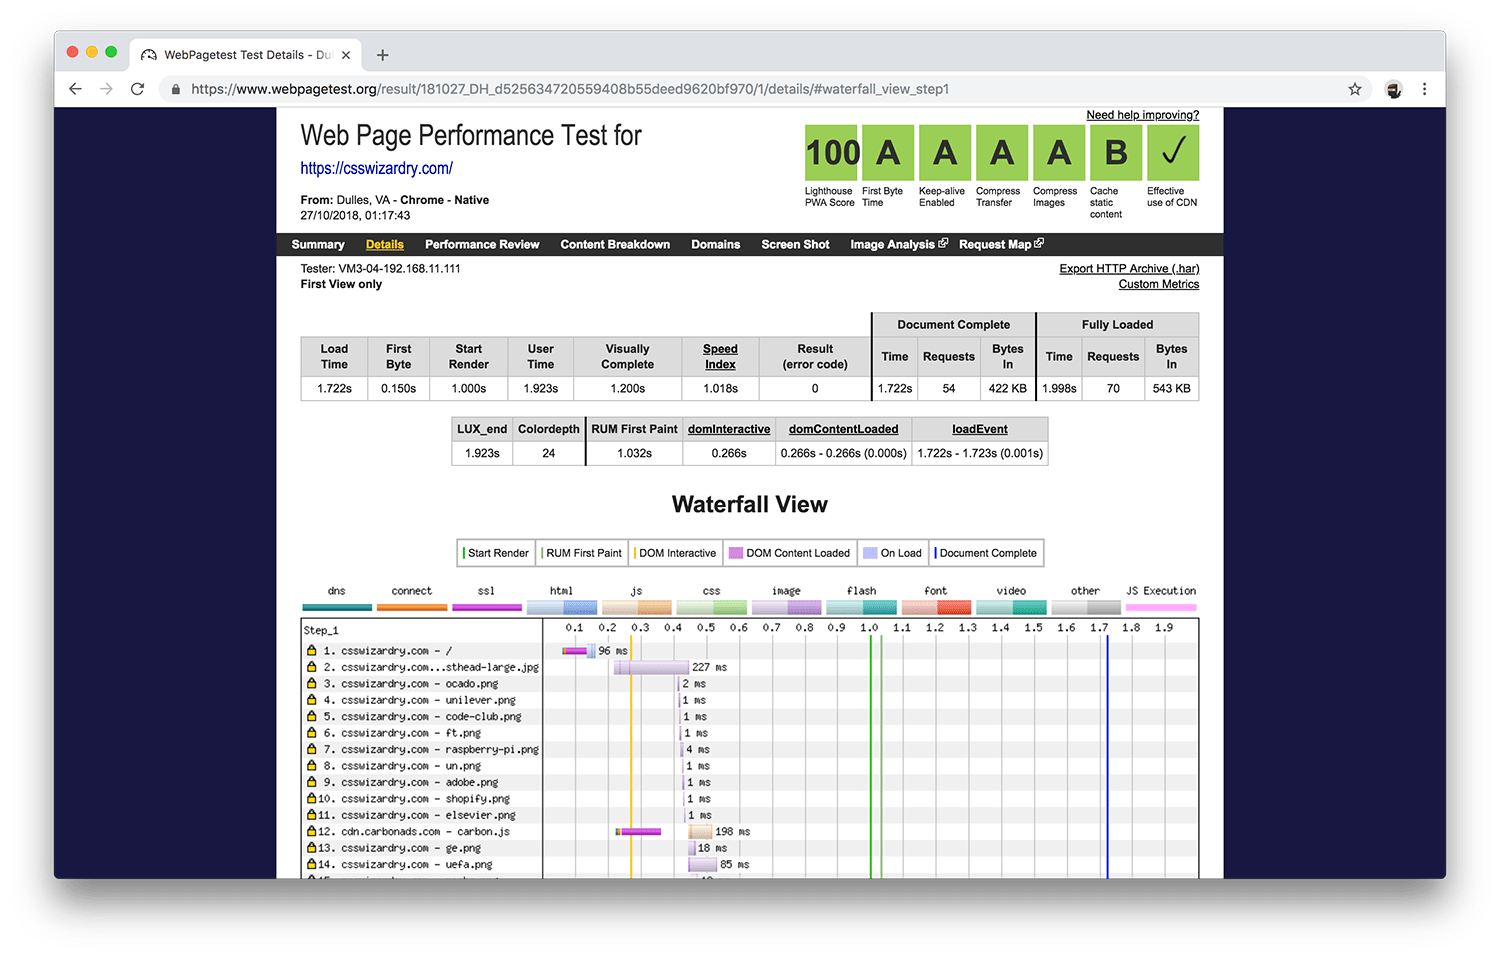
Reactive testing is usually done in response to an event in the development lifecycle, such as a build or a release, and measures the cumulative effect of all of your engineers’ changes. Perhaps each individual deems their changes to be non-harmful, but all changes combined lead to an unacceptable regression. It is important that we capture that.
Reactive testing should be reasonably automated, and should be carried out in as live-like an environment as possible. This could mean Gulp tasks that run Lighthouse against your staging environment, automated WebPageTests that run at every deployment, performance budgets that run on every build, and so on.
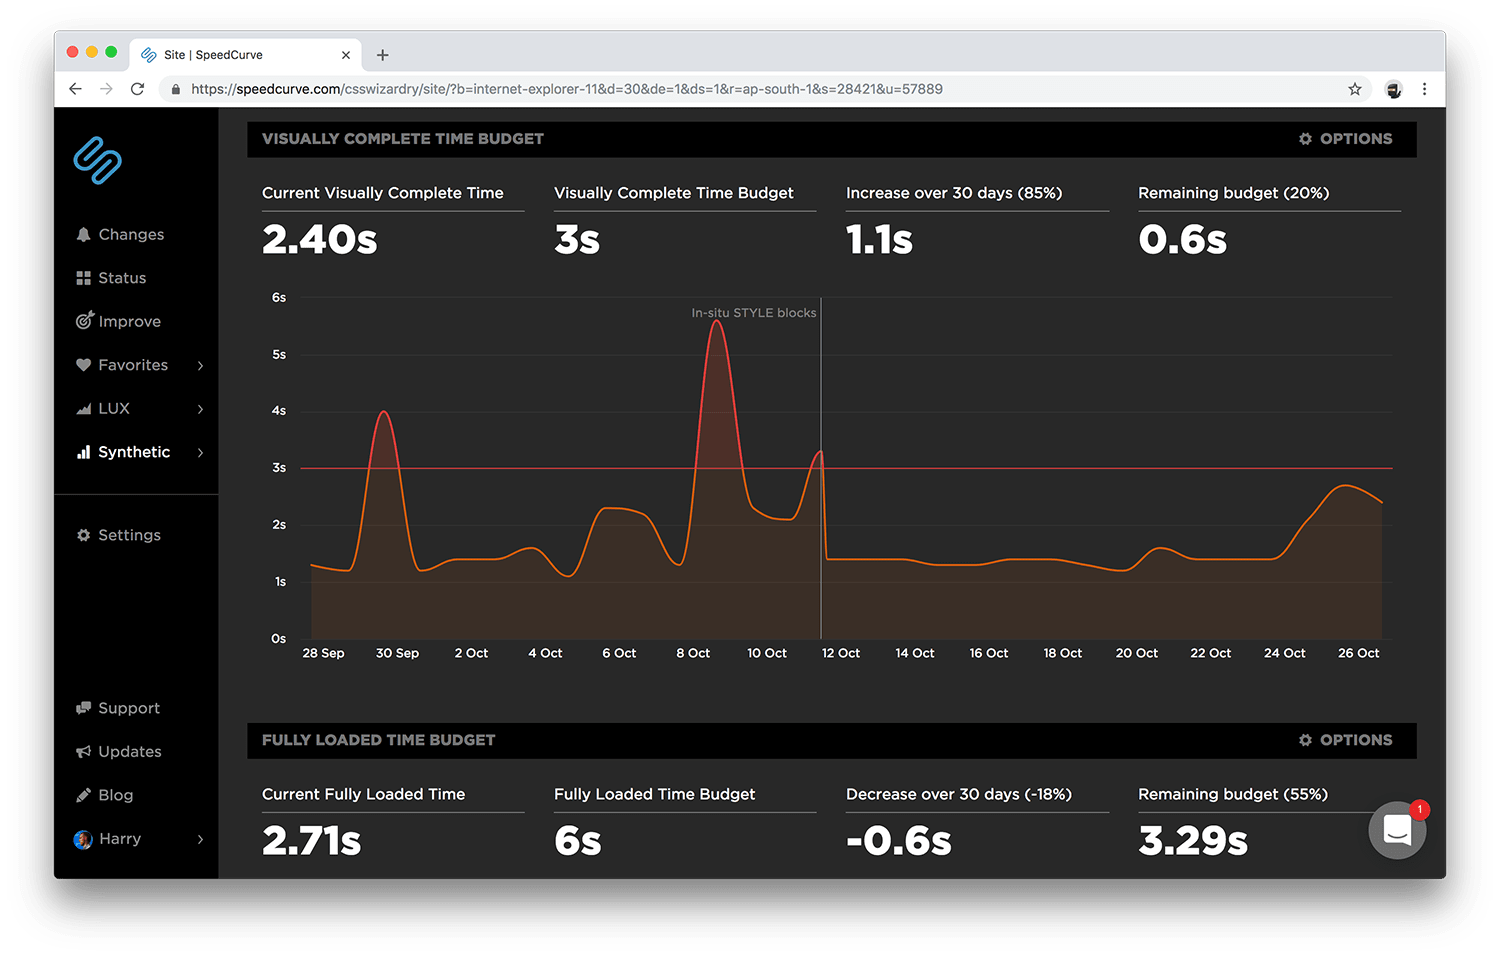
This synthetic testing can allow us to measure regressions before they make it into production, and the business can decide whether the regression is severe enough to delay a release, or whether we prioritise its solution in the next sprint. Accordingly, Reactive testing carries partial organisational visibility—both developers and product people would be aware of and responsive to reactive performance tests.
Any issues spotted here will pass back into Proactive testing to be troubleshooted and remedied locally.
My involvement with clients here is assessing where best to introduce these tools in the development–deployment lifecycle, and working to define suitable thresholds and budgets.
Despite two formal rounds of performance testing, we’re still unable to capture everything before it goes live. Once in production, our site will likely look very different to how it did in our development environment: tag managers have kicked in, your ads are on the site, your analytics package is capturing data, and all third parties are implemented and running. You’re out on the world wide web—you have no idea who is turning up to the site, what their context is, what hardware, software, or infrastructure they’re using, or anything.
Now, we sit back and conduct Passive tests to gather data over time and assess the situation: can we spot patterns? Do certain browsers or geographic locales suffer more than others? Do changes in performance correlate to changes in business metrics?
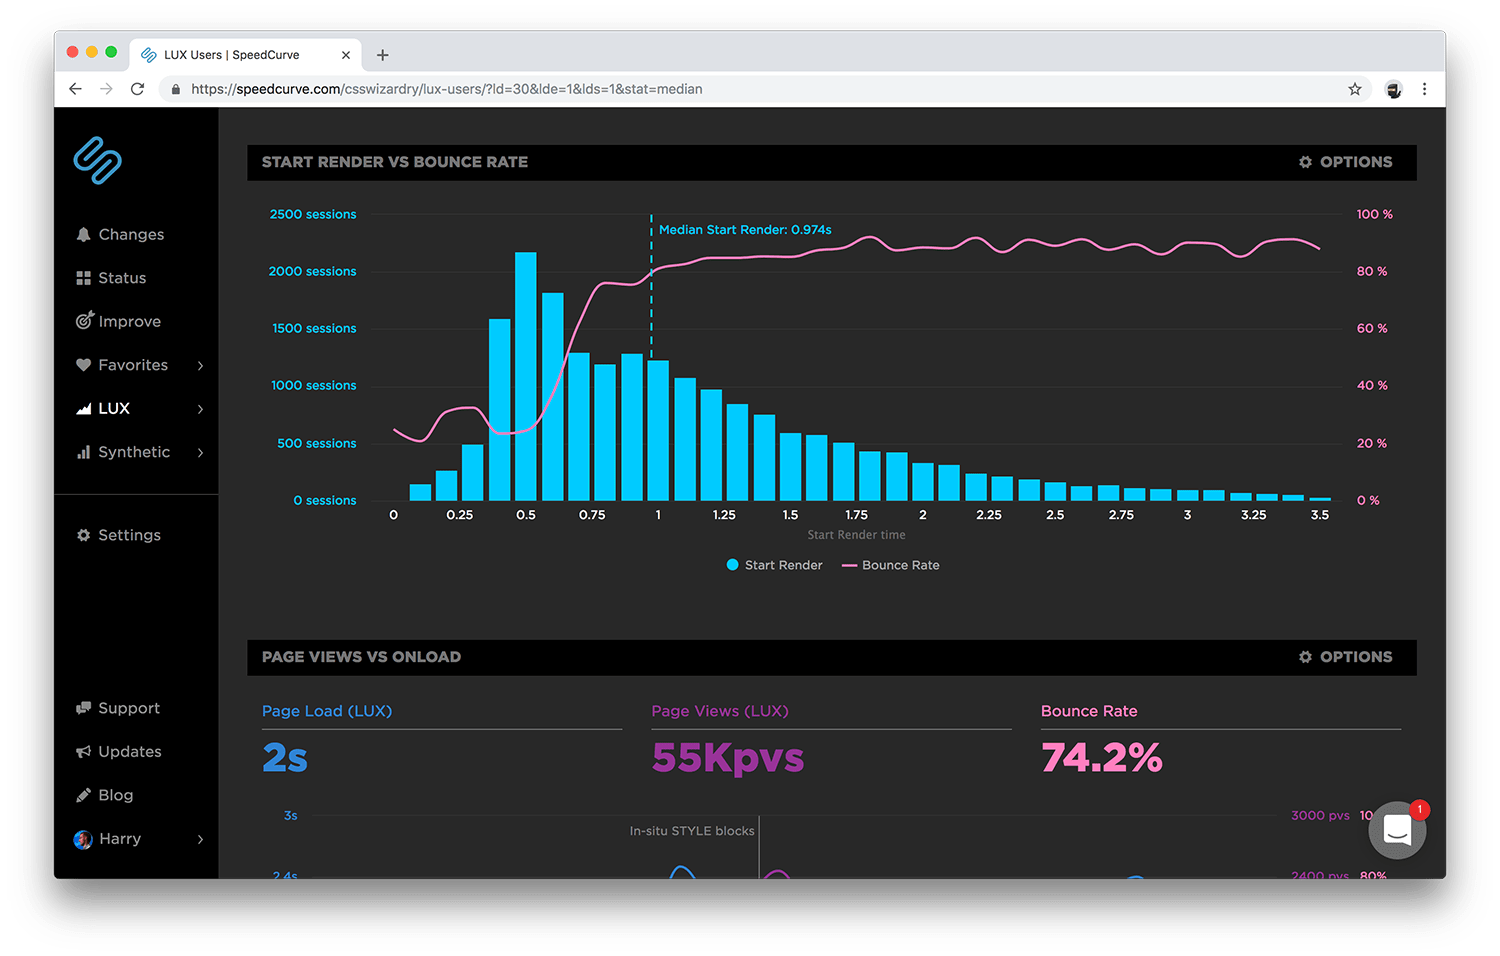
For this, we need to turn to Real User Monitoring (RUM). RUM is great for gathering real and historical data, but by this point there is an essence of being a little too late… your performance slowdowns are already live!
The good news, however, is that you’re at least aware of them. By passively gathering RUM data from your actual visitors, you’re going to be far better equipped to identify what kinds of issues your site suffers in the real world.
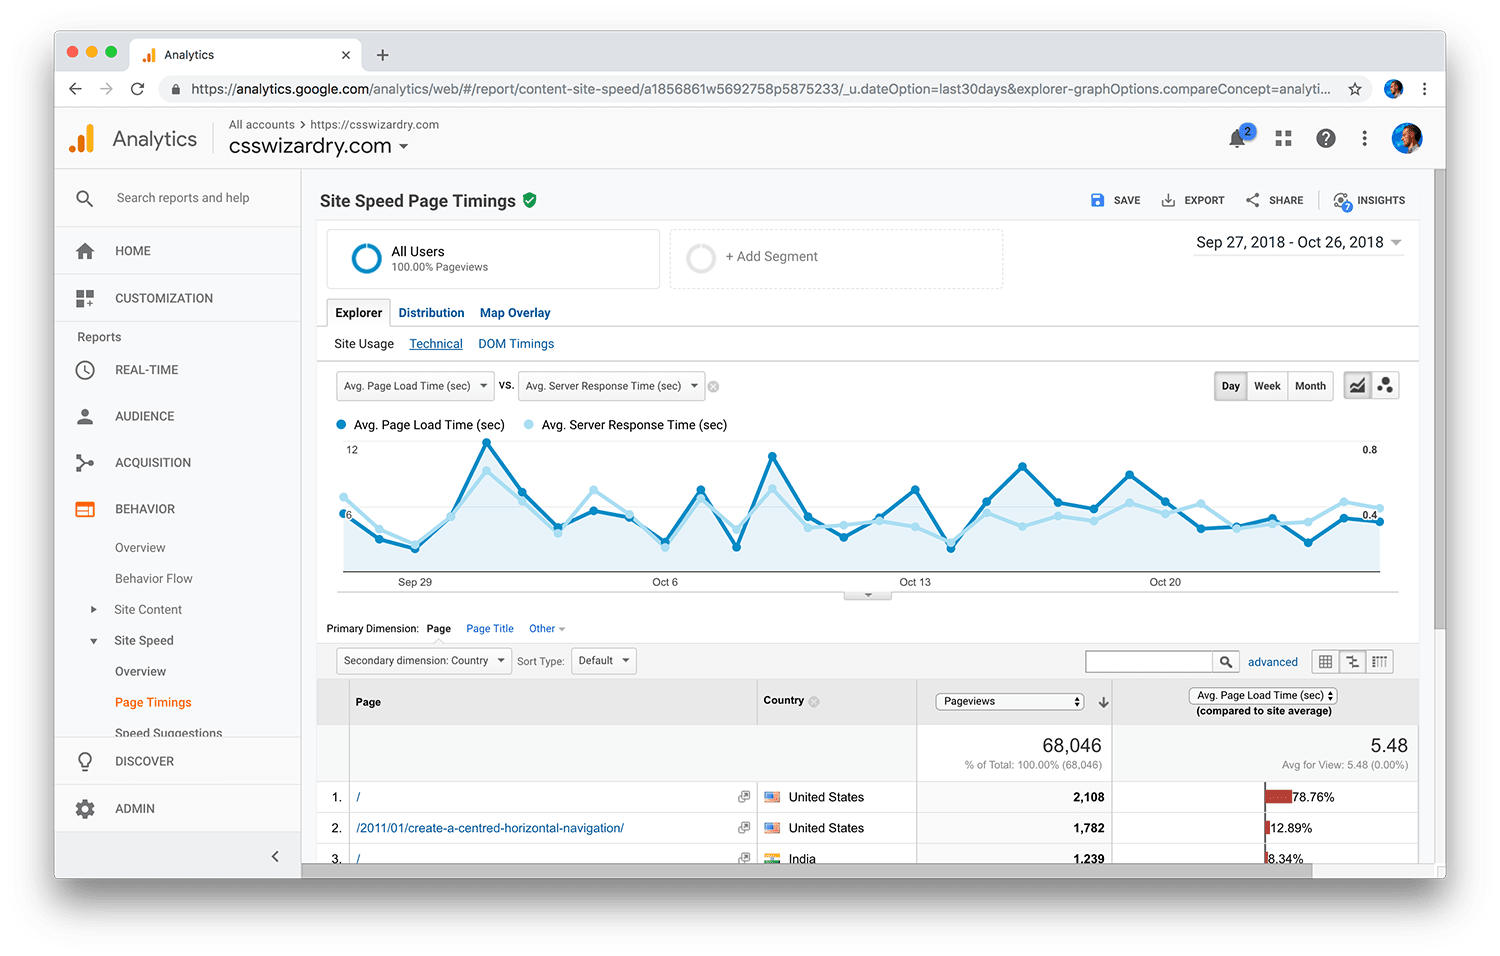
Issues captured here often take longer to fix as we need to gather and assess the data, and then feed the changes back into the backlog (unless we have something critical that we swarm), but they will head back into the Proactive stage so that we can test and verify locally that we’re headed in the right direction.
My involvement with clients here is either assessing existing RUM data to identify what their performance issues are, and helping them to define a strategy for fixing them, or helping the business decide sensible and relevant metrics to track.
Developers now have a clear understanding of what is expected of them. Things should be scrutinised early and often, and regressions should be found and fixed before they leave their machine.
They have clear milestones throughout a project that will help them identify and remedy performance issues, as well as visibility in front of the business, who should by now be supporting their efforts.
I feel like a lot of businesses are still unsure where to even start when it comes to performance monitoring, and as such, they never do. By demystifying it and breaking it down into three clear categories, each with their own distinct time, place, and purpose, it immediately takes a lot of the effort away from them: rather than worrying what their strategy should be, they now simply need to ask ‘Do we have one?’
By formalising what they are, and how and when to do them, it helps to make performance monitoring become second nature. This means we capture regressions much sooner, and ultimately make and save the business money.
This article frames them as proactive, reactive, and passive testing: work done before problems happen, work done in response to issues, and ongoing monitoring that watches performance continuously.
Proactive testing is the work you do ahead of time to prevent problems, such as benchmarking, profiling, auditing, and making performance part of your development process.
Reactive testing happens when a problem has already appeared and you need to investigate, diagnose, and fix it.
Passive testing is continuous measurement and monitoring in the background, often through tools that track real-world performance over time.
You usually need all three eventually, but the right starting point depends on your situation: proactive work prevents issues, reactive work solves current ones, and passive monitoring keeps you informed over time.
此内容由惯性聚合(RSS阅读器)自动聚合整理,仅供阅读参考。 原文来自 — 版权归原作者所有。