


Written by on CSS Wizardry.
Independent writing is brought to you via my wonderful Supporters.
More and more frequently I’m finding myself presenting data to clients. Wether
it’s through code reviews or performance
audits, taking a statistical look at code
is an important part of my job, and it needs presenting to my clients in a way
that is representative and honest. This has led me more and more into looking at
different averages, and knowing when to use the correct one for each scenario.
Interestingly, I have found that the mean, the average most commonly referred to
as simply the average
, is usually the least useful.
I want to step through the relative merits of each, using some real life examples.
Disclaimers: Firstly, I’m by no means a statistician or data scientist; if anything in here isn’t quite correct, please let me know. Secondly, I deal with relatively small data sets, so we don’t need to worry about more complex measurements (e.g. standard deviation or interquartile ranges); sticking with simplified concepts is fine. Finally, all of the data in this article is fictional, please do not cite any figures in any other articles or papers.
The mean is the most common average we’re likely to be aware of. It works well when trying to get a representative overview of a data set with a small range; it is much less representative if we have extremities in our data. If you’ve ever split a bill at a restaurant, you’ve used a mean average. We arrive at the mean by adding all of our data points together and then dividing by the number of data points there were, e.g.:
| Person | Cost |
|---|---|
| Harry | £42 |
| Stephanie | £39 |
| Amit | £41 |
| Anna | £47 |
| Laura | £39 |
If we’re going to split this bill, then we’d work out the mean:
(42 + 39 + 41 + 47 + 39) ÷ 5 = 41.6
I’m sure you’d all agree that £41.60 is a pretty fair price to pay for your meal if we’re splitting the bill.
However, if Chad comes along and orders the wagyu steak at £125, we’re going to have a different outcome altogether:
| Person | Cost |
|---|---|
| Harry | £42 |
| Stephanie | £39 |
| Amit | £41 |
| Anna | £47 |
| Laura | £39 |
| Chad | £125 |
(42 + 39 + 41 + 47 + 39 + 125) ÷ 6 = 55.5
Paying £55.50 each to subsidise Chad’s expensive taste isn’t quite so fair.
I’ve mentioned issues with the mean before, in my previous post about Parker. Sometimes it’s nicer to know either a more representative single number, or to know that most values are x.
Use the mean if you want a fair or representative take on a data set with a very small range. Honestly, I find that the mean is seldom useful in the work I do, so let’s leave it there.
The median is great for working out a good representation of a data set that contains statistical outliers, or data with a large range. The median is simply the middlemost data point in a set that has been arranged in ascending order; finding the middle point helps us to trim off any statistical outliers and anomalies.
Here’s an actual use case from just yesterday. I was doing a code review for a client and was concerned that their Gulp task took a long time to complete. I took a measurement of five runs and ascertained the median value:
| Run | Duration (s) |
|---|---|
| 1 | 74 |
| 2 | 68 |
| 3 | 70 |
| 4 | 138 |
| 5 | 69 |
So you take your data points: 74, 68, 70, 138, 69
Reorder them: 68, 69, 70, 74, 138
And pick the centre point: 68, 69, 70, 74, 138
Tip: Whenever you run tests like this one, run an odd number of them (e.g. 5) so that the median is easier to find.
As you can see here, run 4 took an unusually long time to complete. This would skew the data if we were to take the mean:
(74 + 68 + 70 + 138 + 69) ÷ 5 = 83.8
83.8 seconds isn’t a very fair reflection when most runs were in the high
sixties/low seventies, so the mean is not appropriate here. It turns out that
the median (at exactly 70) is a very good representation. This means that I will
be telling the client that compilation took an average of 70 seconds to
complete (median run of five runs)
.
Another good use of the median is in representing page load times: load the same page five times from an empty cache, record your outcomes, find the median. This means that you won’t get skewed results from things like DNS latency that might be out of your control. Again, this happened to me just the other day, and the mean would have been an unfair and inappropriate representation of the page’s general performance. Take a look at the DNS delays on this waterfall:
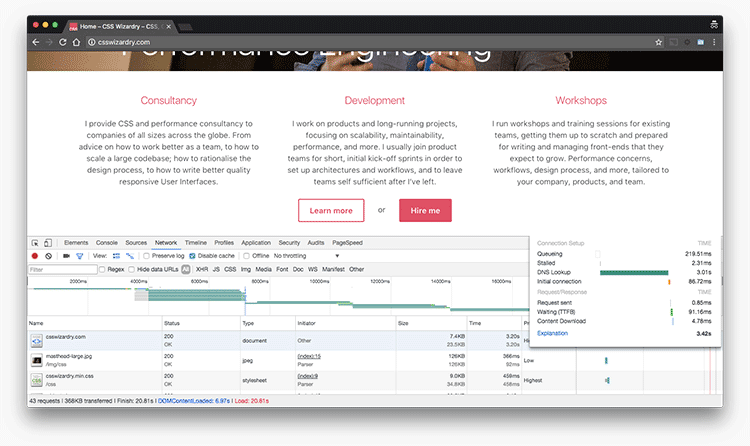
This page took over 20 seconds to load, which is not at all representative. Unusual DNS slowdowns were causing unexpected delays, so the median measurement makes allowances for this.
Use the median if you want to get a good view of a data set that has a large range and/or statistical outliers.
The mode is a little harder to explain, but it works best with grouped data sets. With means and medians, the data is usually whatever-it-ends-up-being. That is to say, if run 1 takes 62s then the data point is 62; if it takes 93s then it is 93.
However, if we were to make our own silos of data points, we can begin looking at finding a mode: instead of representing each data point individually, we put in into a pre-defined bin, e.g. ≤60s, >60s, ≤90s, etc. Now our data isn’t whatever-it-ends-up-being, it’s actually inside a category we’re already aware of.
Let’s look at a better scenario. If a client wants to know how well their site performs in general, I could do something like this:
There are a couple of issues here: firstly, I’m going to end up with a very long x axis if I have profiled each individual page, meaning I’m having to work over a lot of data; secondly, this still only tells me how each page performs, and doesn’t give me a very good overview of the site’s performance like we wanted.
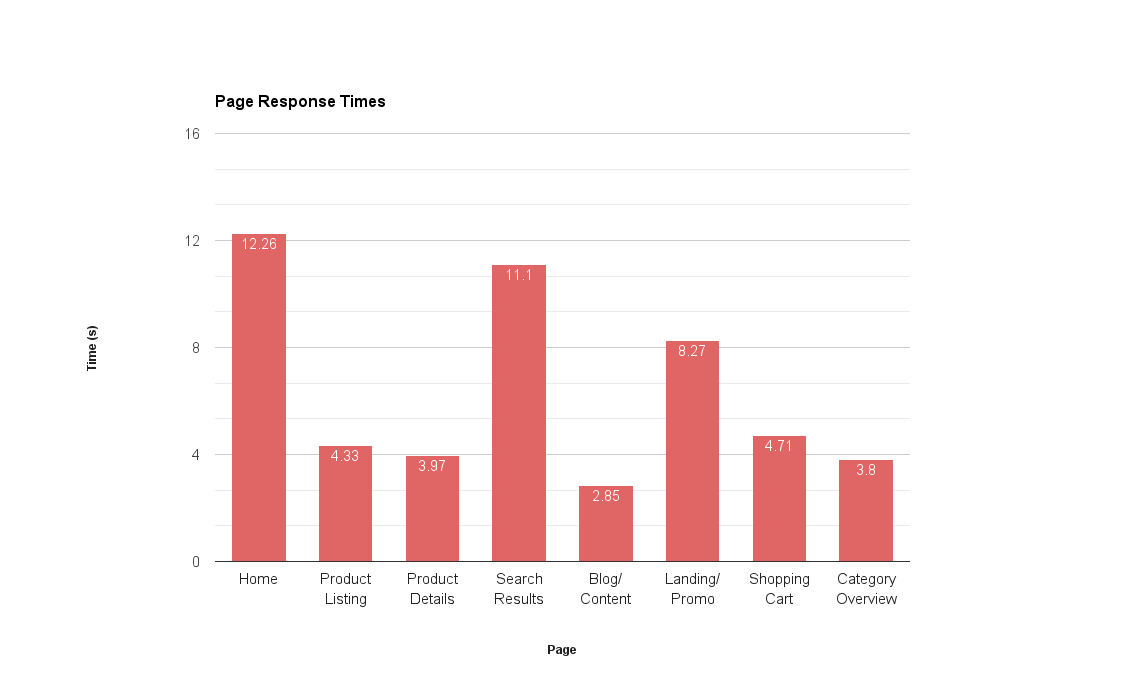
This has told me little of any value. What would be better would be to chunk the data points into bins like ‘under 3s’, ‘between 3s and 5s’, ‘over 10s’, etc., and then represent it as a histogram. A histogram plots the frequency of a data point, not the data point itself. This allows us to very easily identify the mode:
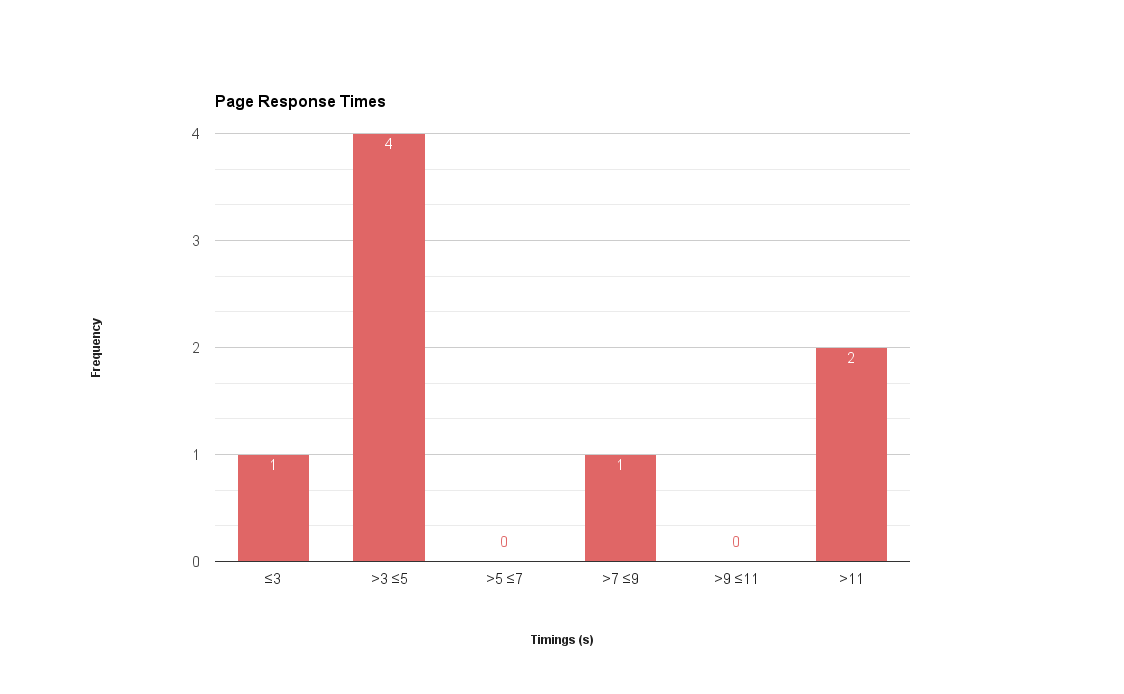
Now I have a much better of how the site performs in general, noting that most pages on the site load between 3 and 5 seconds. Most pages aren’t terrible, but we do also have a few outliers that we should probably focus on first.
Here I can get a good idea of the distribution in general, and see a good holistic snapshot of the current site.
Use the mode if you want to get a feel for what most things are like. E.g. ‘most images on the product page are under 75KB’.
If you’re going to be measuring, analysing, or auditing anything for work/clients, make sure you represent your findings as truly and usefully as possible. We usually find that the median is the most accurate representation for measuring things like speed or performance. Any data that is subject to statistical outliers should not be represented by the mean, as results are easily skewed. If we want to get a general overview of what most things are looking like, the mode might be the one to go for.
此内容由惯性聚合(RSS阅读器)自动聚合整理,仅供阅读参考。 原文来自 — 版权归原作者所有。