


The Performance Panel is used for detailed investigations on traces captured during page load or during user interactions. It’s a critical tool for understanding and debugging performance issues, but it can be overwhelming to newcomers. Previously I wrote about the Landing screen released back in Chrome 129 but I didn’t cover recording and analysing actual performance traces.
From my own experience analysing and explaining performance traces to others, it can be difficult to know where to focus.
Using some of the new and older features to the performance panel I have become more comfortable using the performance trace feature. Let me walk you through five tips I have based on my journey.
Before we get started, if you have not used the Performance Panel before, you can find it in the Developer Tools of Chrome as a part of the top navigation, if it is missing from there you can find it by following Chrome for developers guide.
From the landing page of the performance panel you can set your CPU and network throttling up to make sure your experience is closer to that of your real users.
When I’m performing investigations via the Performance Panel, I tend to open a blank Chrome profile with no extensions to avoid polluting the recording trace with unrelated work.
From this screen you can capture two types of trace recording, the first being a simple Record option (the circle icon) which is useful for investigating performance after page load such as interactions, the second being Record and Reload which helps us investigate what is happening during page load. The buttons for both can be found in the top left handle corner (highlighted in green below).
Below is an example performance trace, with the network requests at the top (highlighted in blue) and what running on the main thread further down (highlighted in yellow):
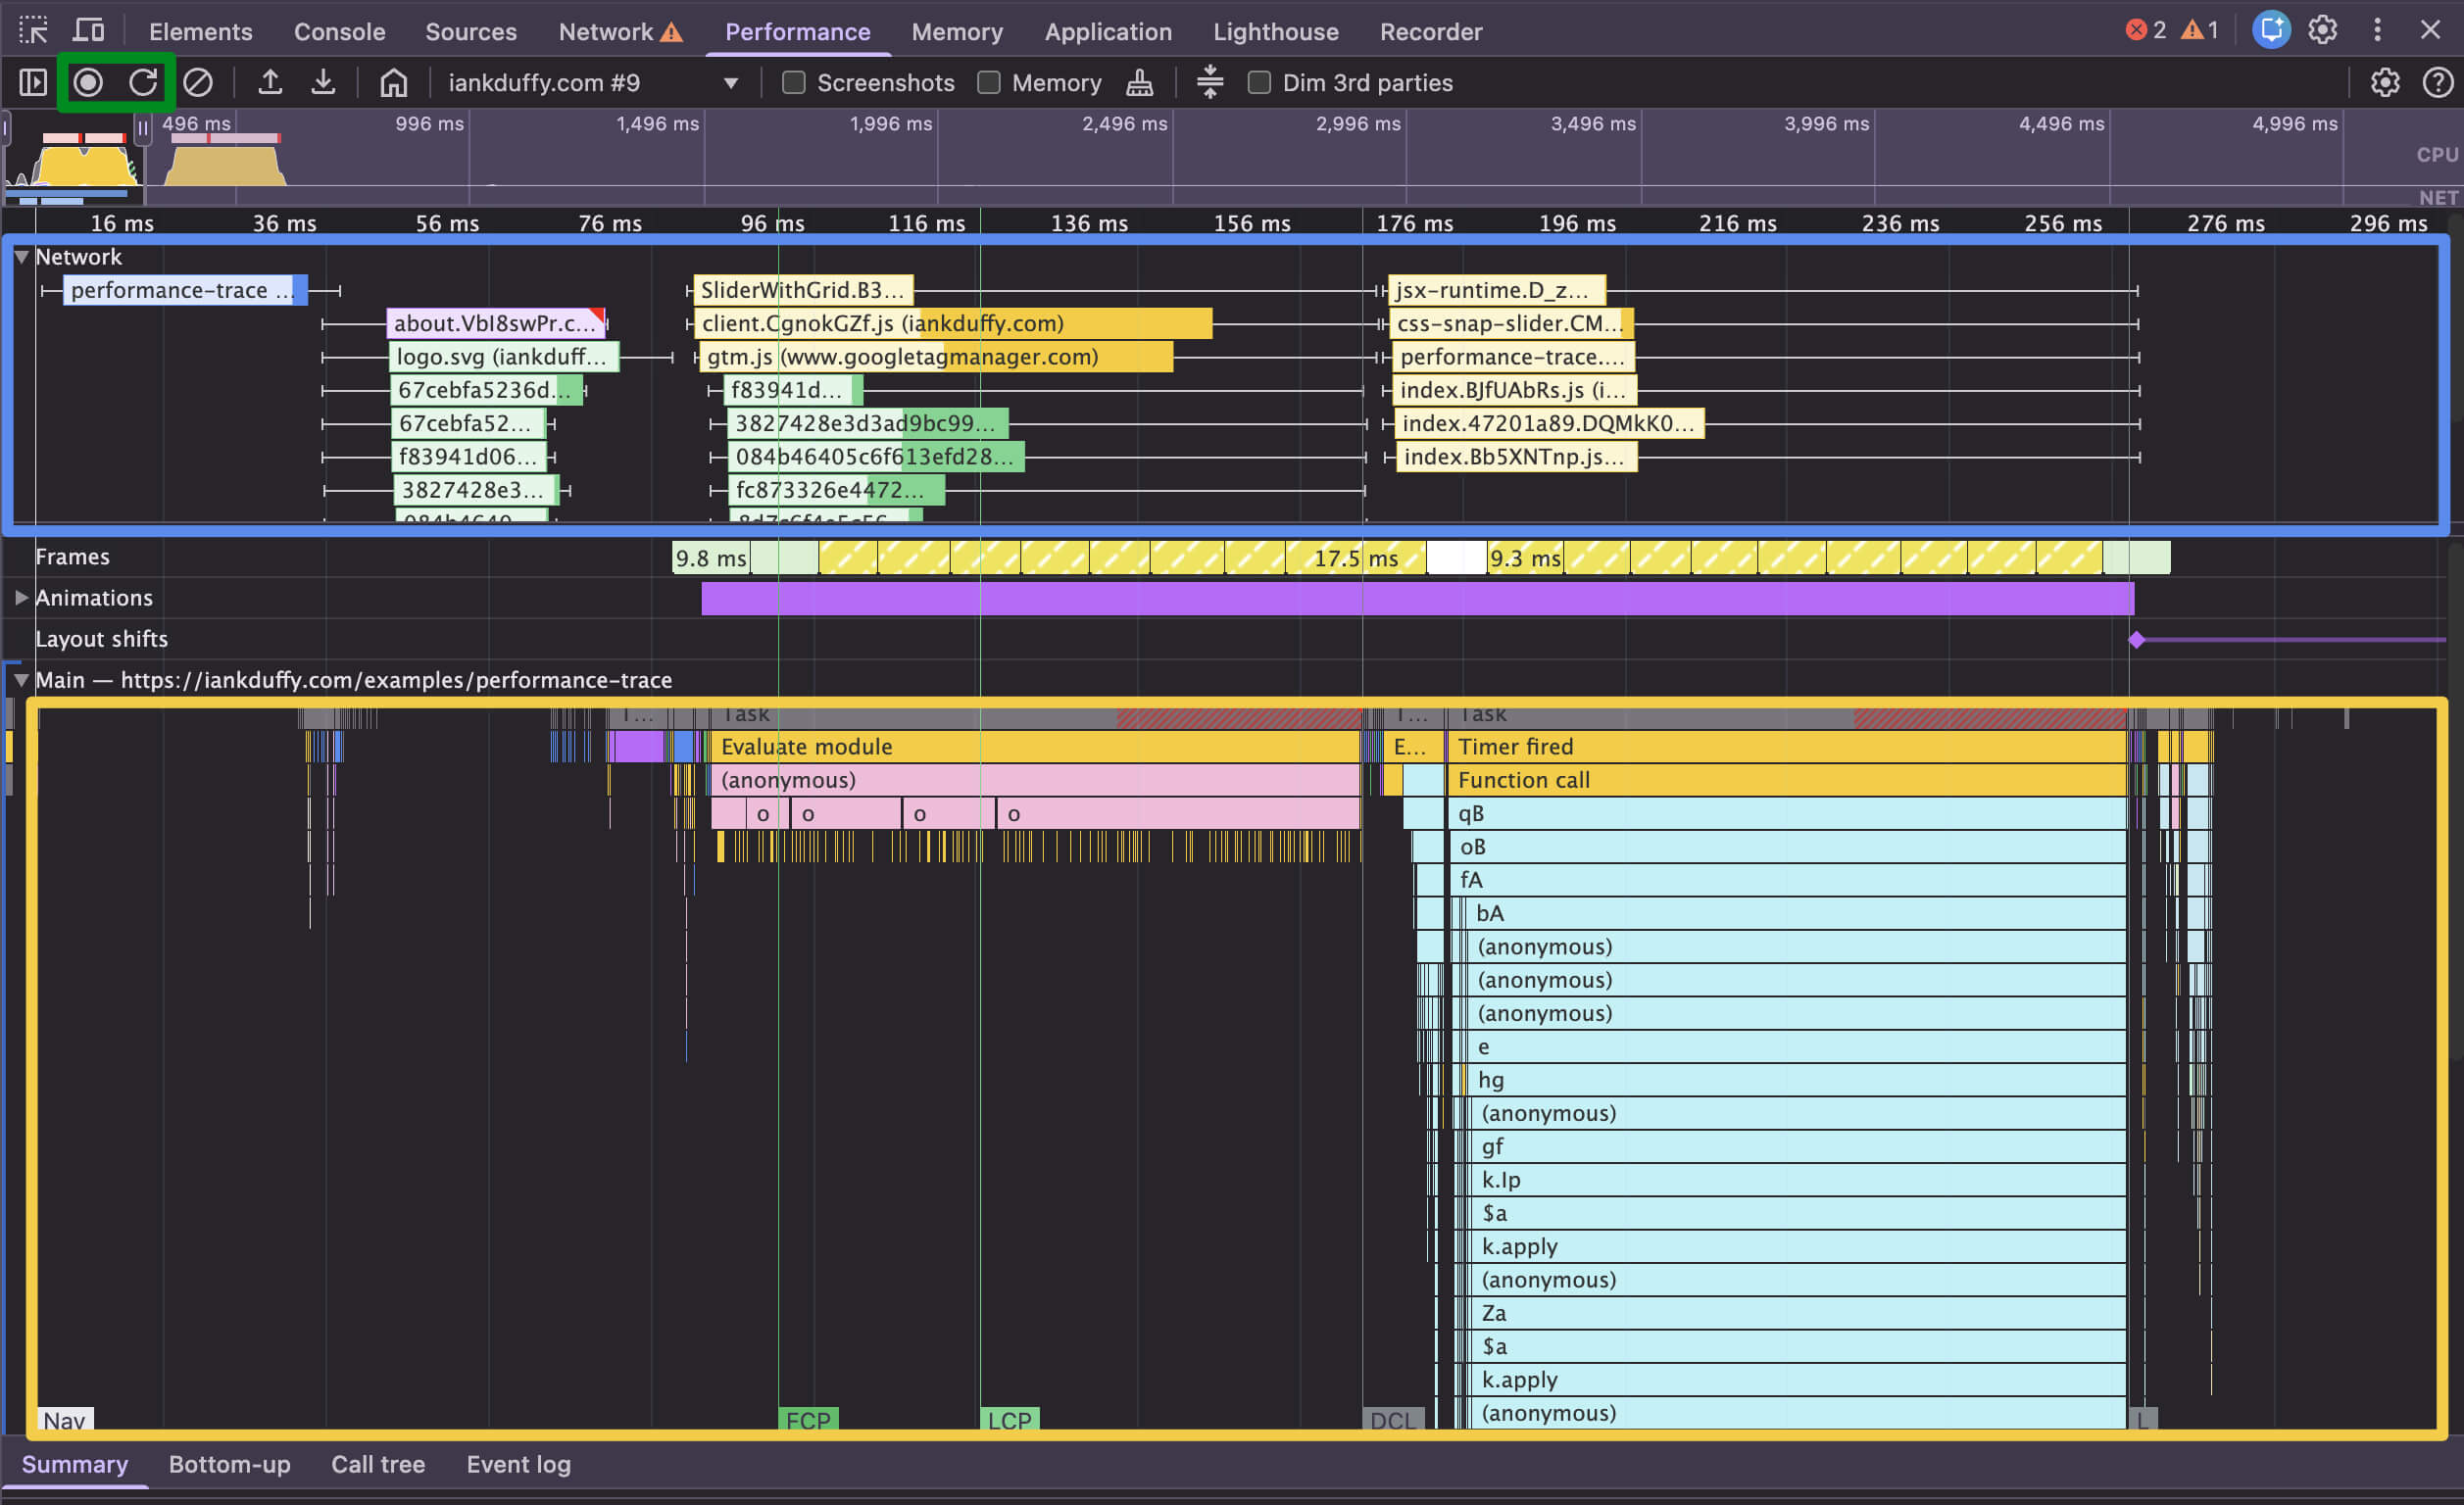
Usually when analysing a performance trace I am looking for what caused a performance issue such as a slow interaction, e.g. was it caused by first party JavaScript or was it a third party script such as chat widget or a tag manager?
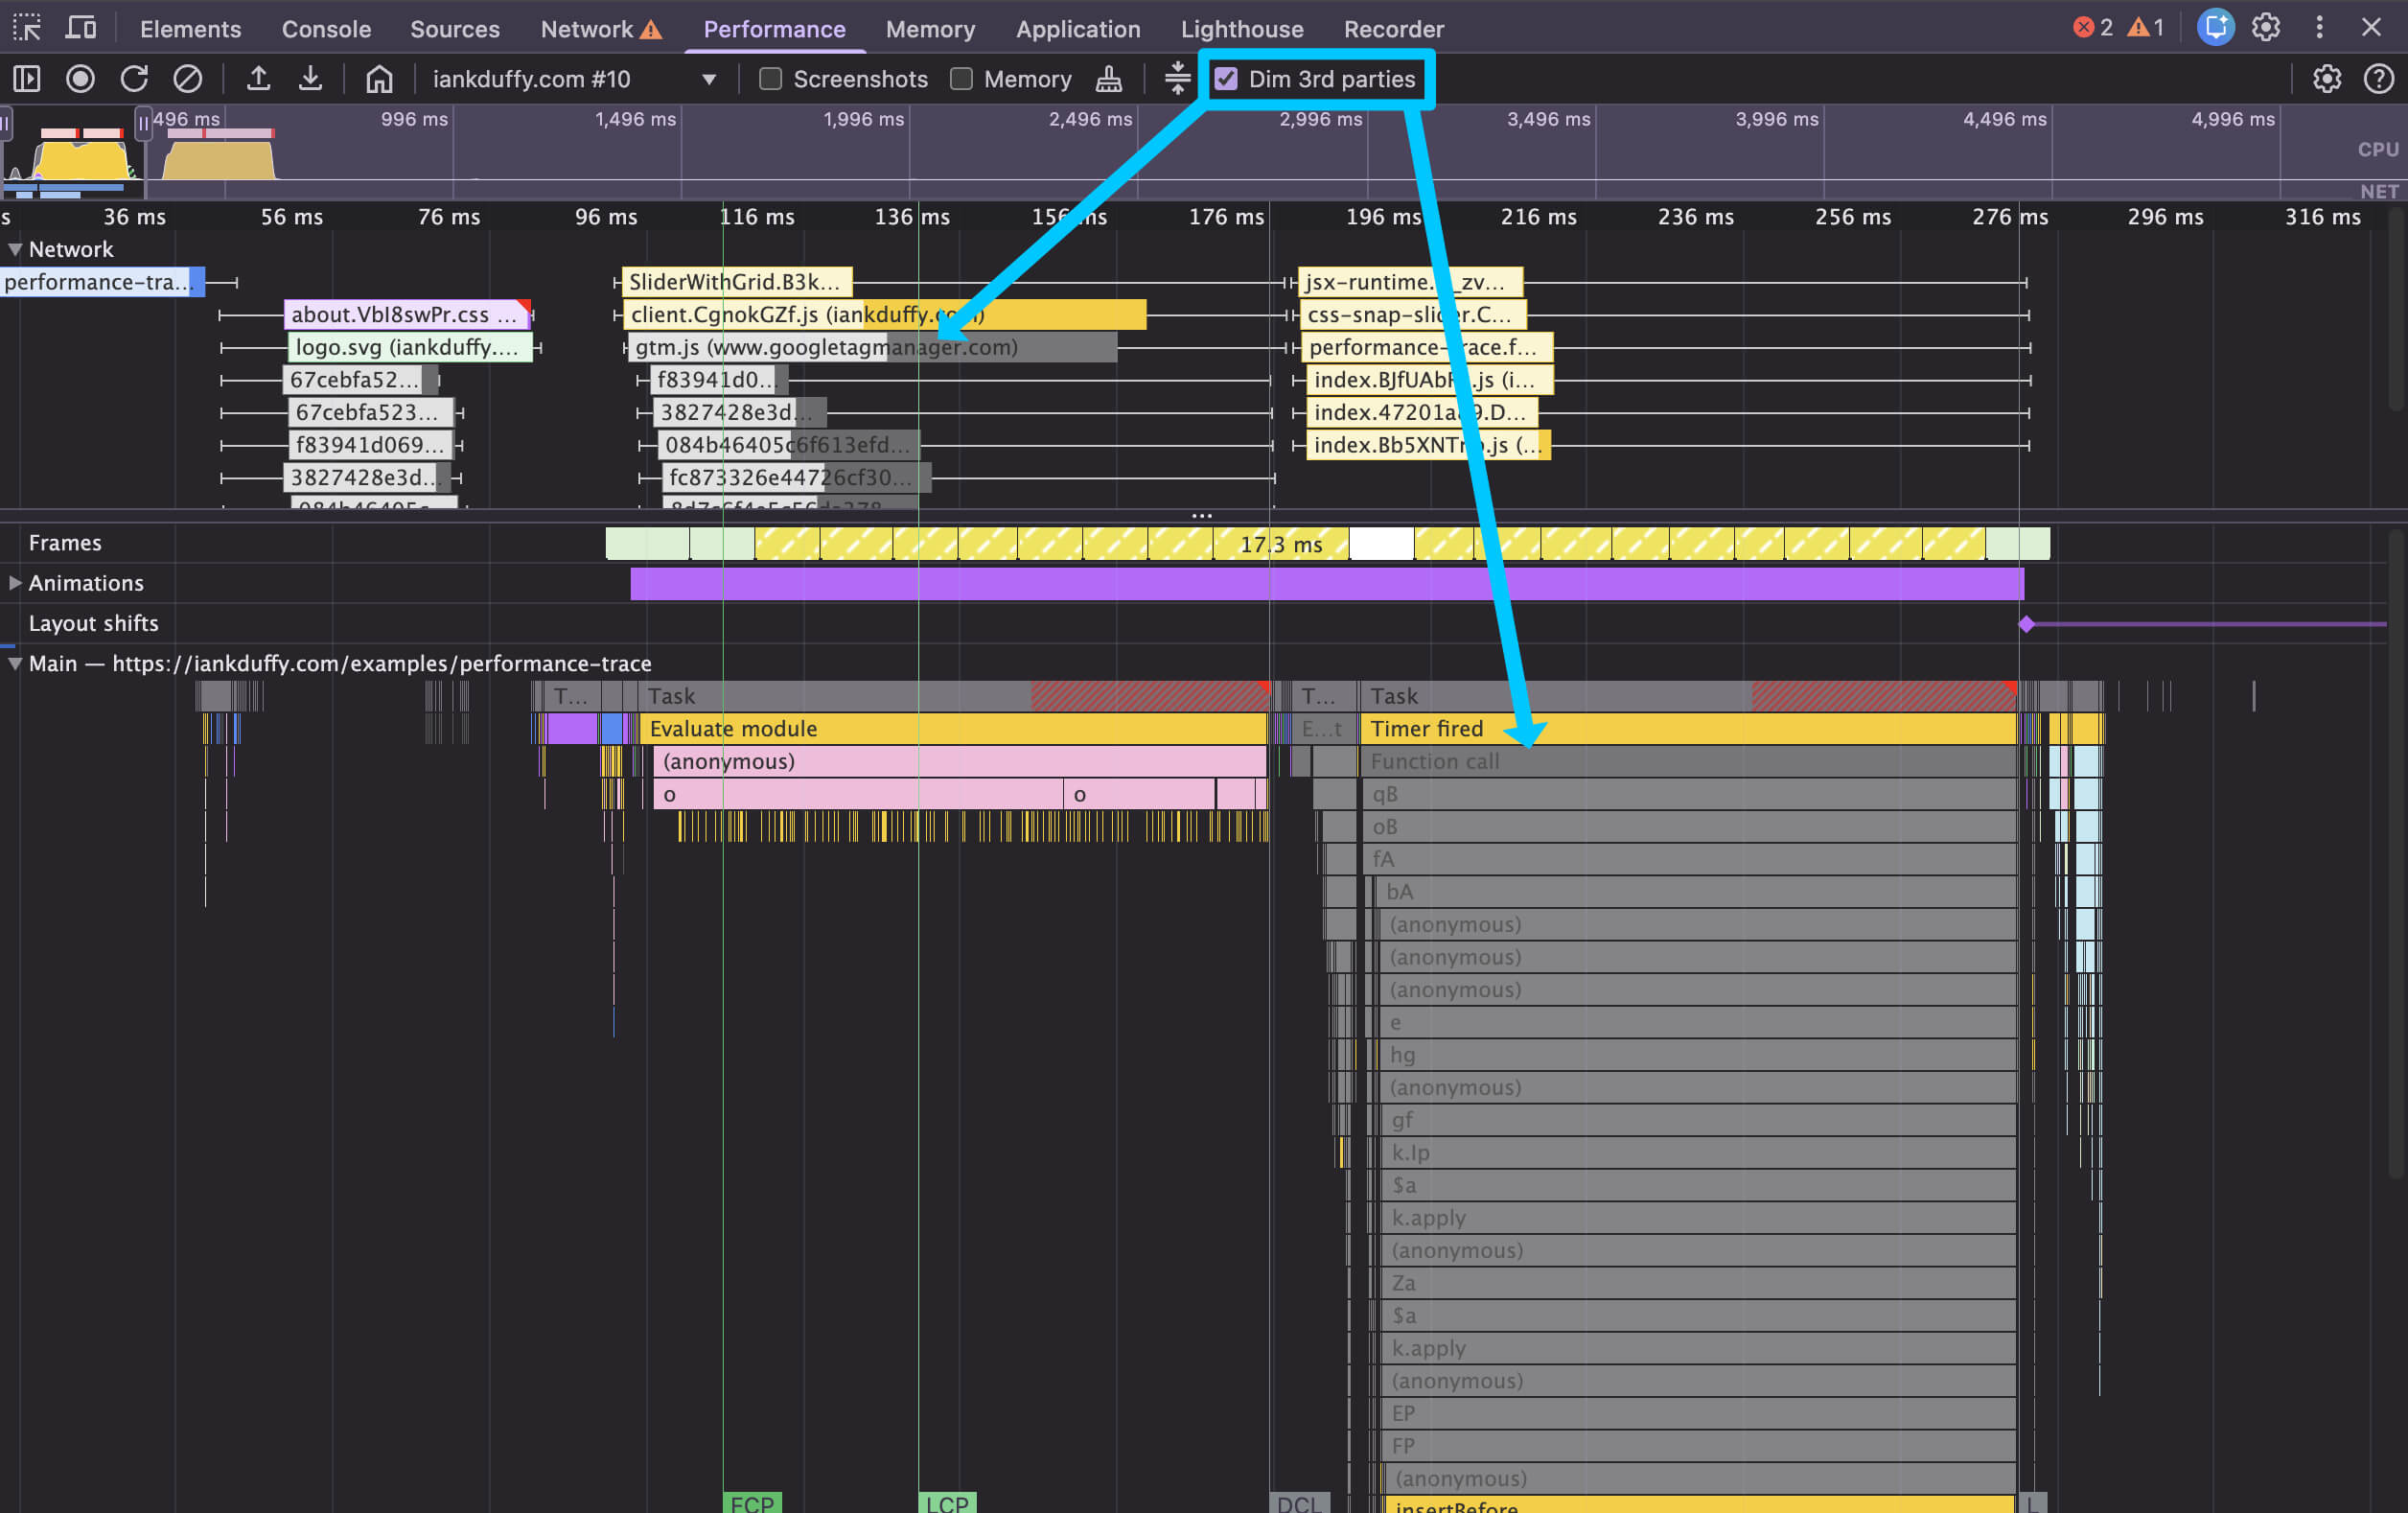
To make it easier to focus on first party code or see the which is causing the biggest issues you can dim all third party parts the performance trace via a checkbox in the top of the performance panel, this will grey out execution tasks from third parties and any network requests to third party resources including scripts and images hosted on other domains, while still allowing you to interact with them.
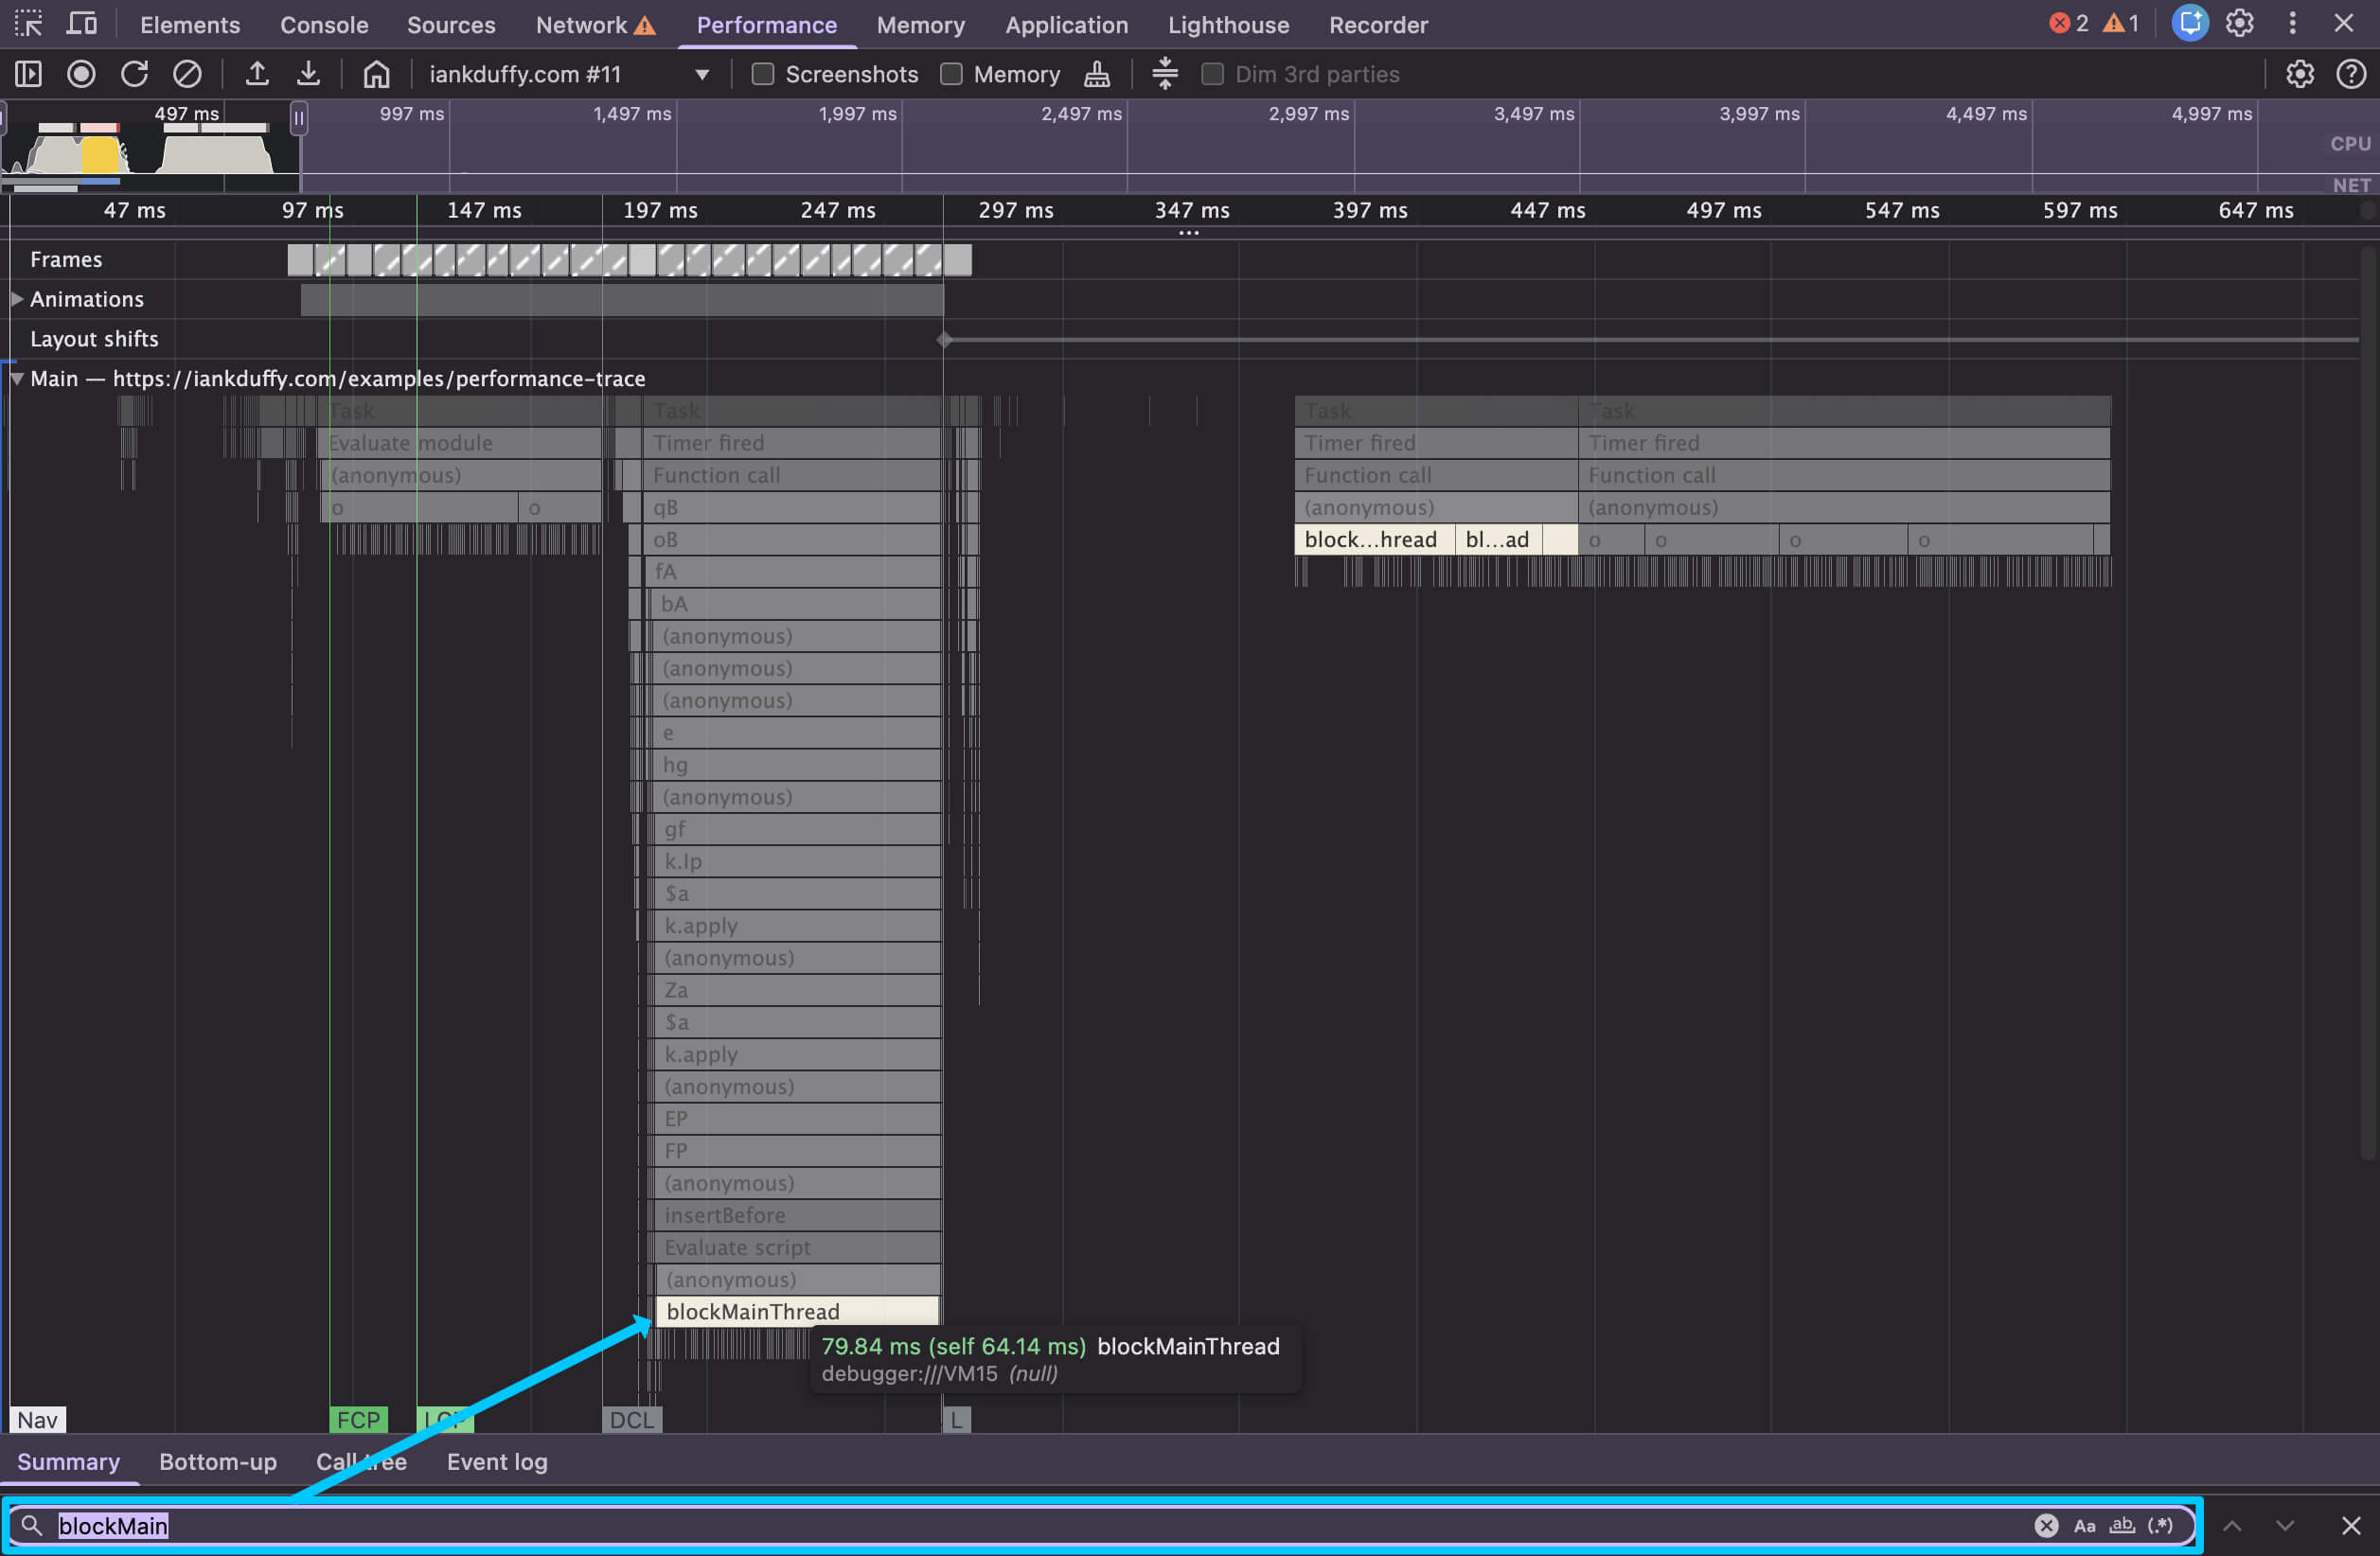
Say you are hunting for a particular named function, all functions belonging to a specific file/domain or certain network requests, inside the performance panel you can trigger search function. On macOS it is command + f, (Windows it’s ctrl + f).
This will open a search bar at the bottom of the performance panel, from here you can type a search term such as an event handler, function name or a file extensions and it will highlight any instances that match this across the performance trace, for example you can search for blockMain and it will highlight any events function names that start with blockMain:
Once you’ve identified parts of the performance trace, you can use annotations to keep track of what is happening in the trace and why, this is a great way to build a story of what is happening both for yourself and for sharing traces with others.
To add an annotation to an item in a performance trace you can double click or press enter, this should create a small box that you can use to attach a label to, this is great for highlighting different parts of a long animation frame, identifying which functions are called and how long they take.
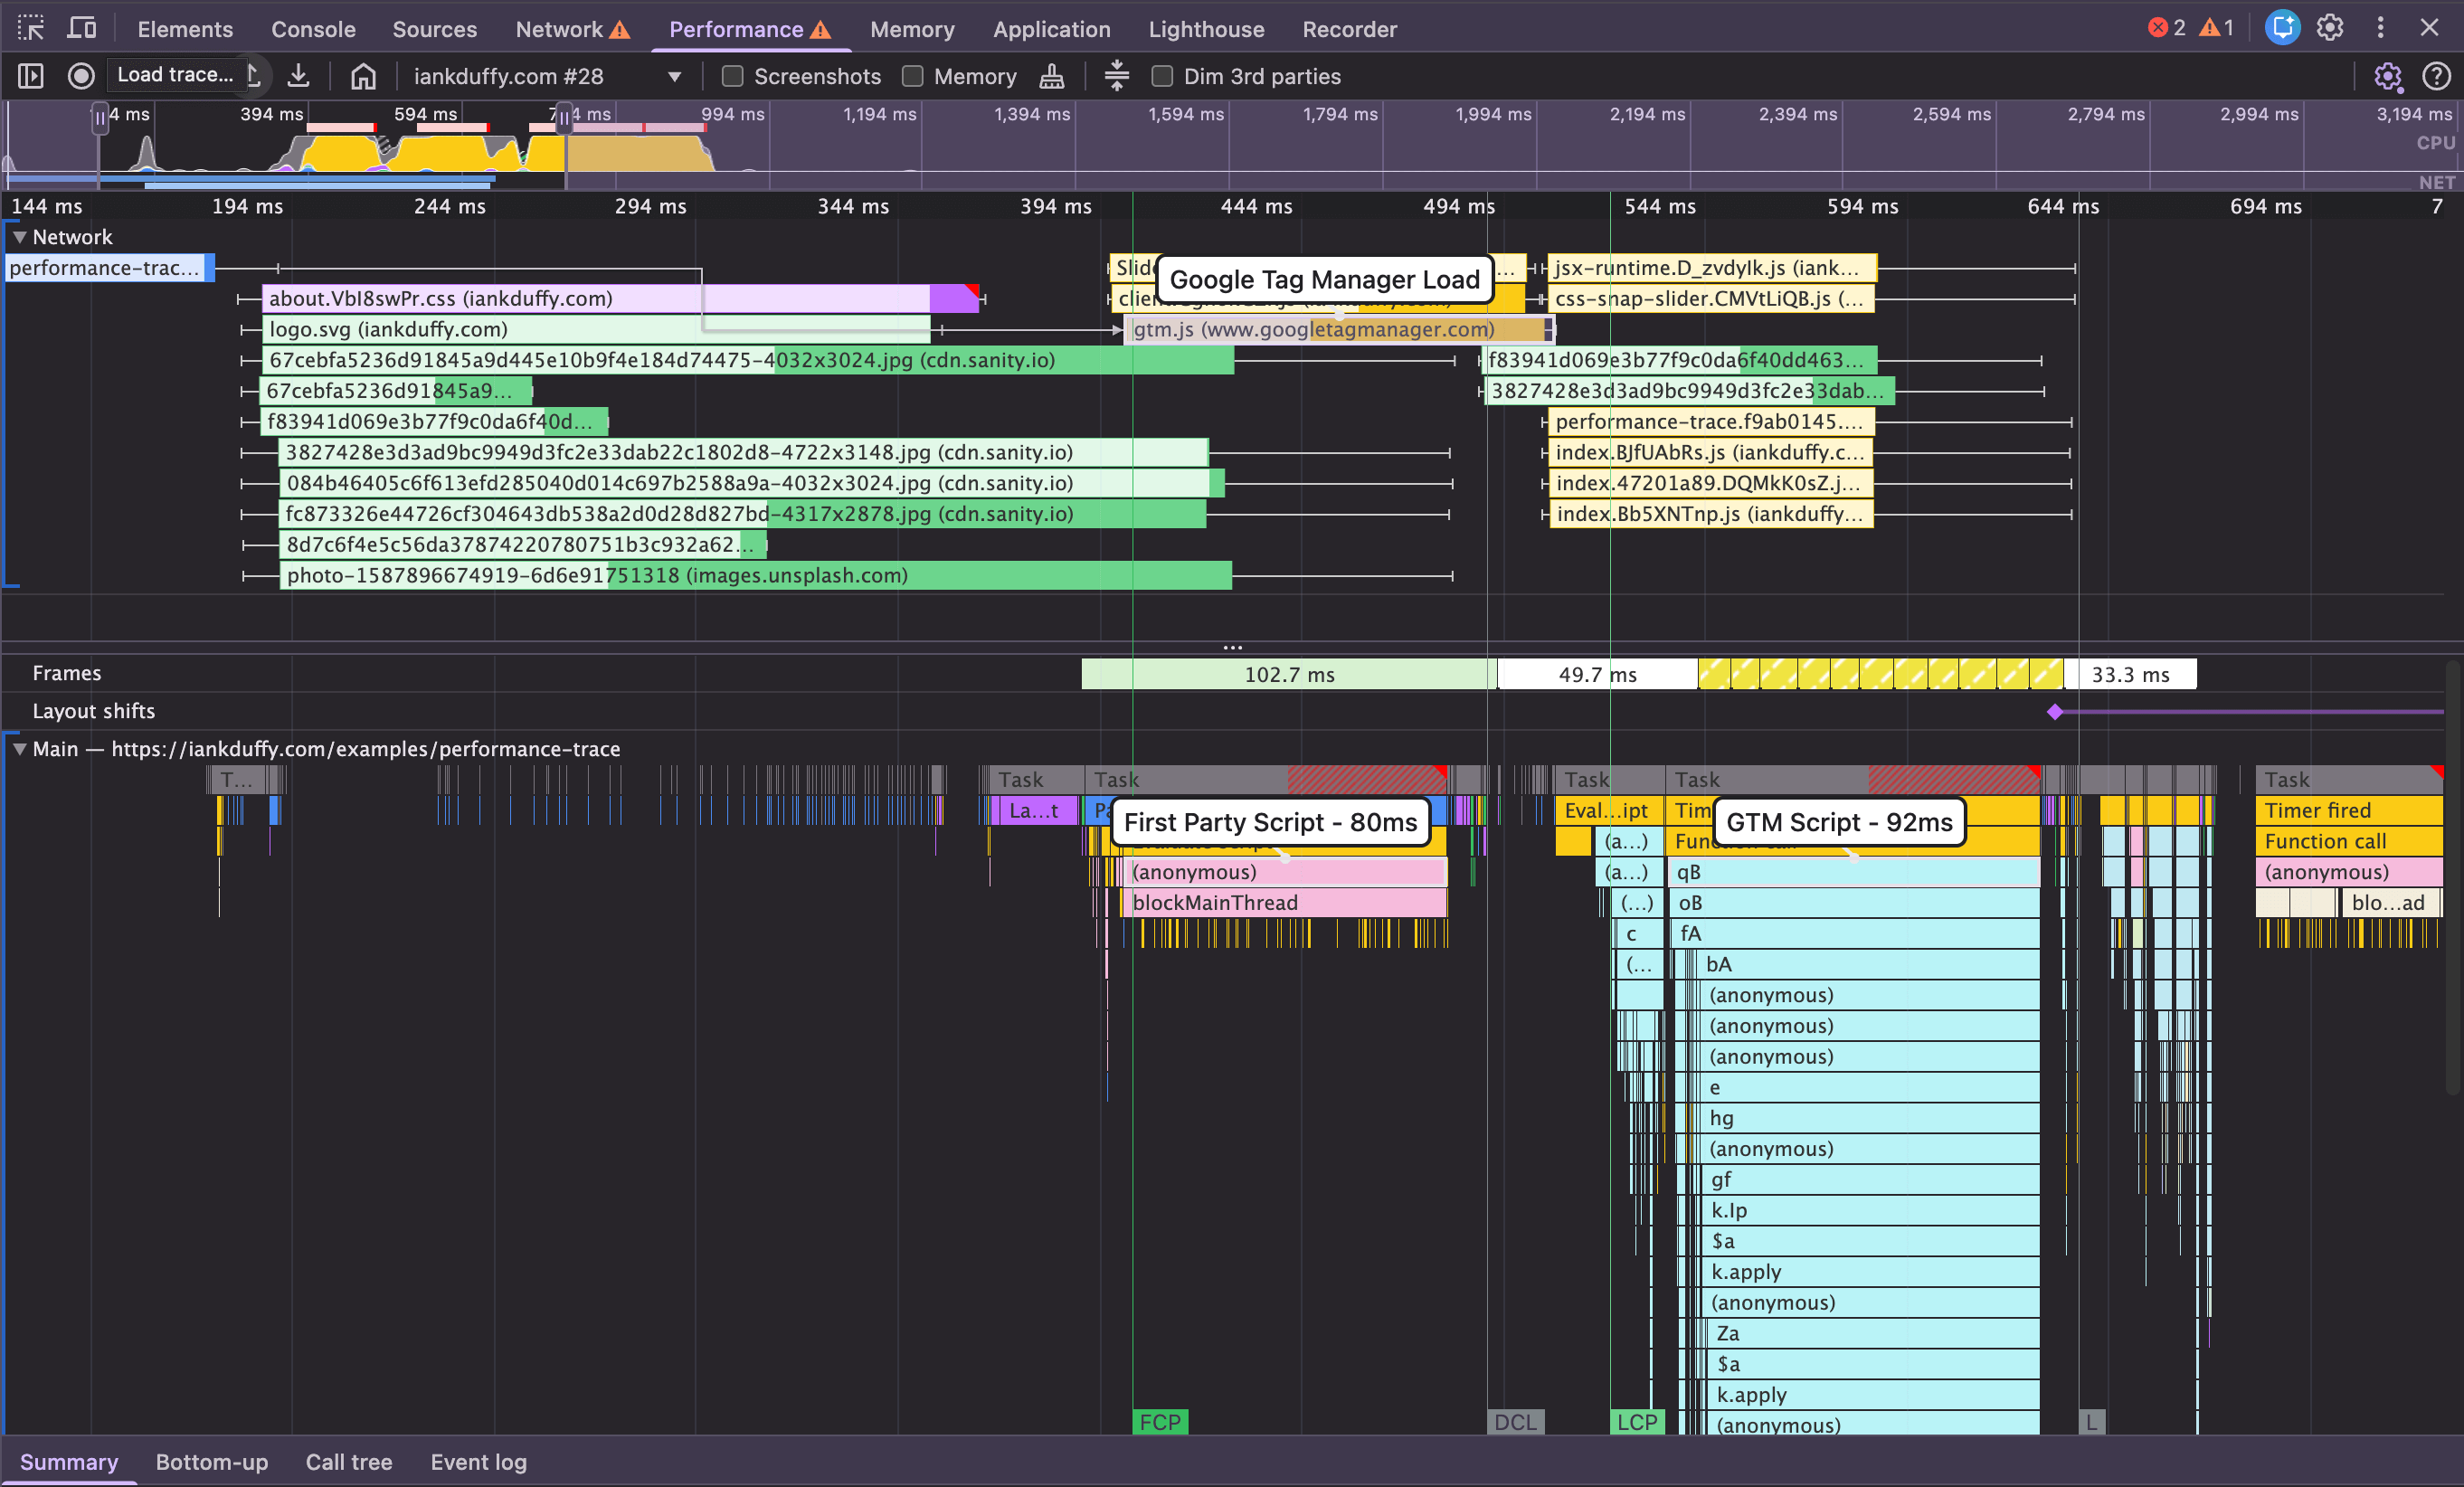
It’s also possible to add annotations over a time span, allowing you to group multiple items in a trace. To do this you can press shift and drag your mouse over the area you want to annotate, which creates a pink bar with in which you can add your notes.

Once you have annotated a performance trace, it’s possible to export and import the trace via the buttons next to the record buttons, so you can prepare a performance trace on an issue before sharing it with others.
A useful website to bookmark is trace.cafe, you can use this to share traces without needing the other person to understand how to import traces into DevTools.
The next part of the performance panel that can help identify very common performance issues is the Insights Panel, the button for which can be found in the top left of the performance panel (highlighted in blue). This is great at identifying common web performance issues and will automatically highlight parts of the trace that are relevant and dim out the rest.
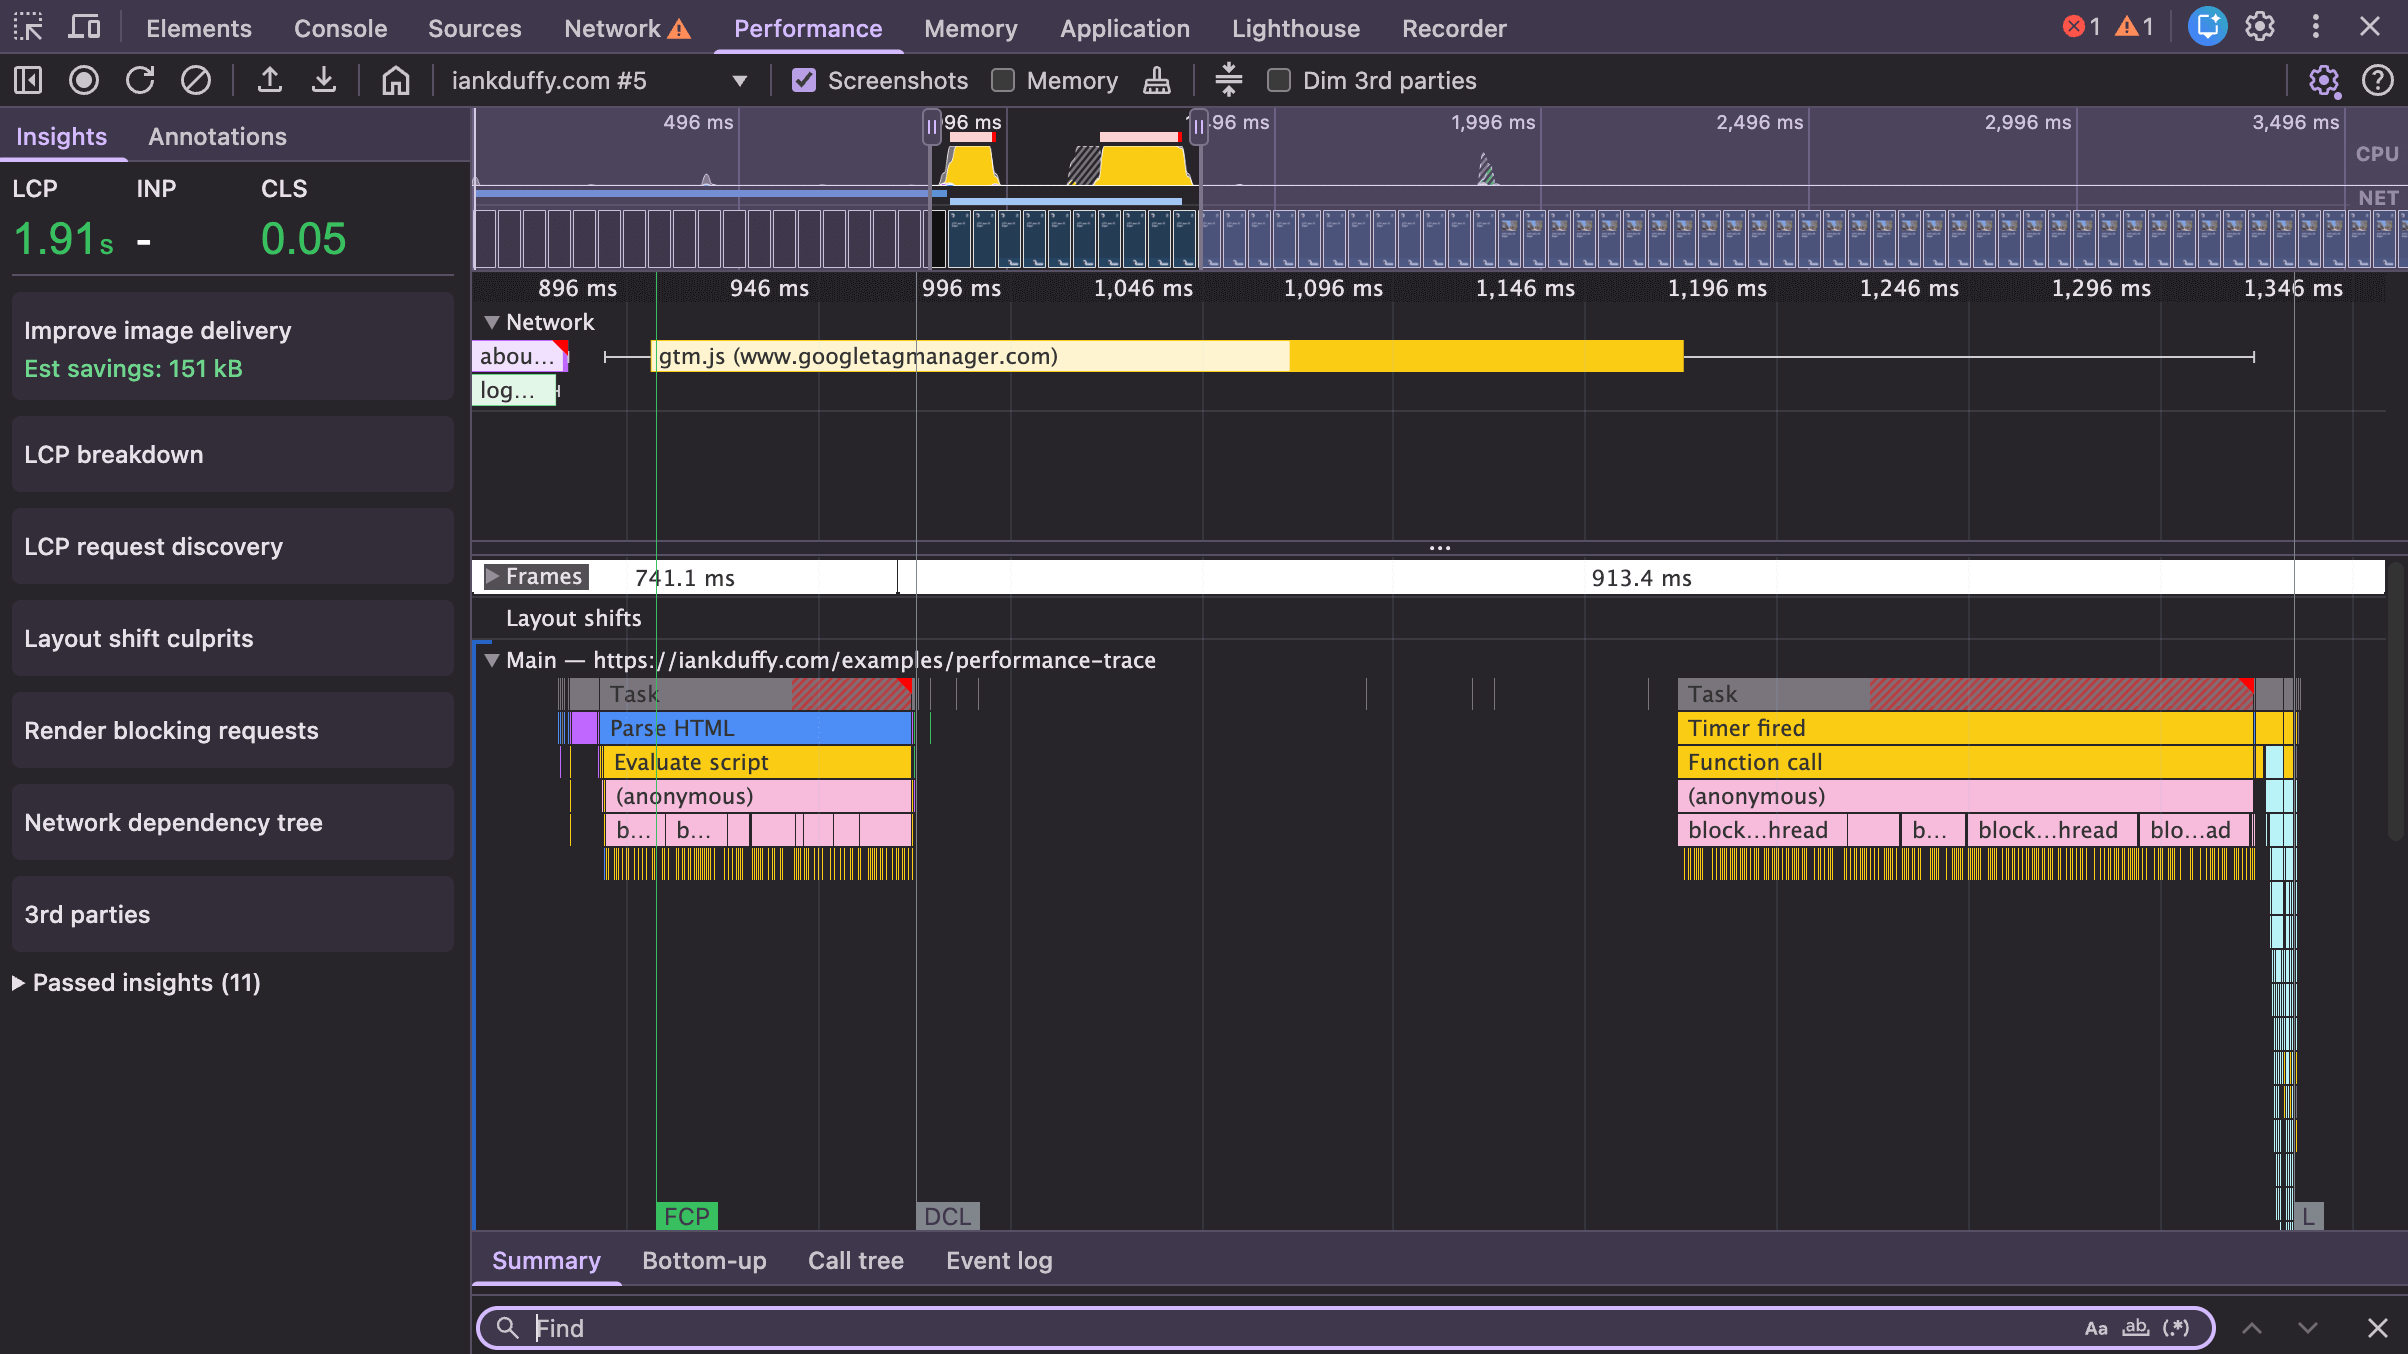
The top section of this drawer will give you local values for the 3 Core Web Vitals, and if the site you are testing has CrUX data it will show that for comparison to real world experiences.
Next should be a list of insights into common performance problems related to your performance trace, this can range from looking at breakdown for LCP image, image delivery and looking at the impact of third party scripts. You can see a full list of the possible insights here.
Clicking on any of these sections will expand to provide deeper information, insights related to your trace, and can show highlights of the issue in the main trace. For example, LCP breakdown will give you information on the sub parts like element render delay, and show it on the performance trace making it easy to spot what might be causing delay.
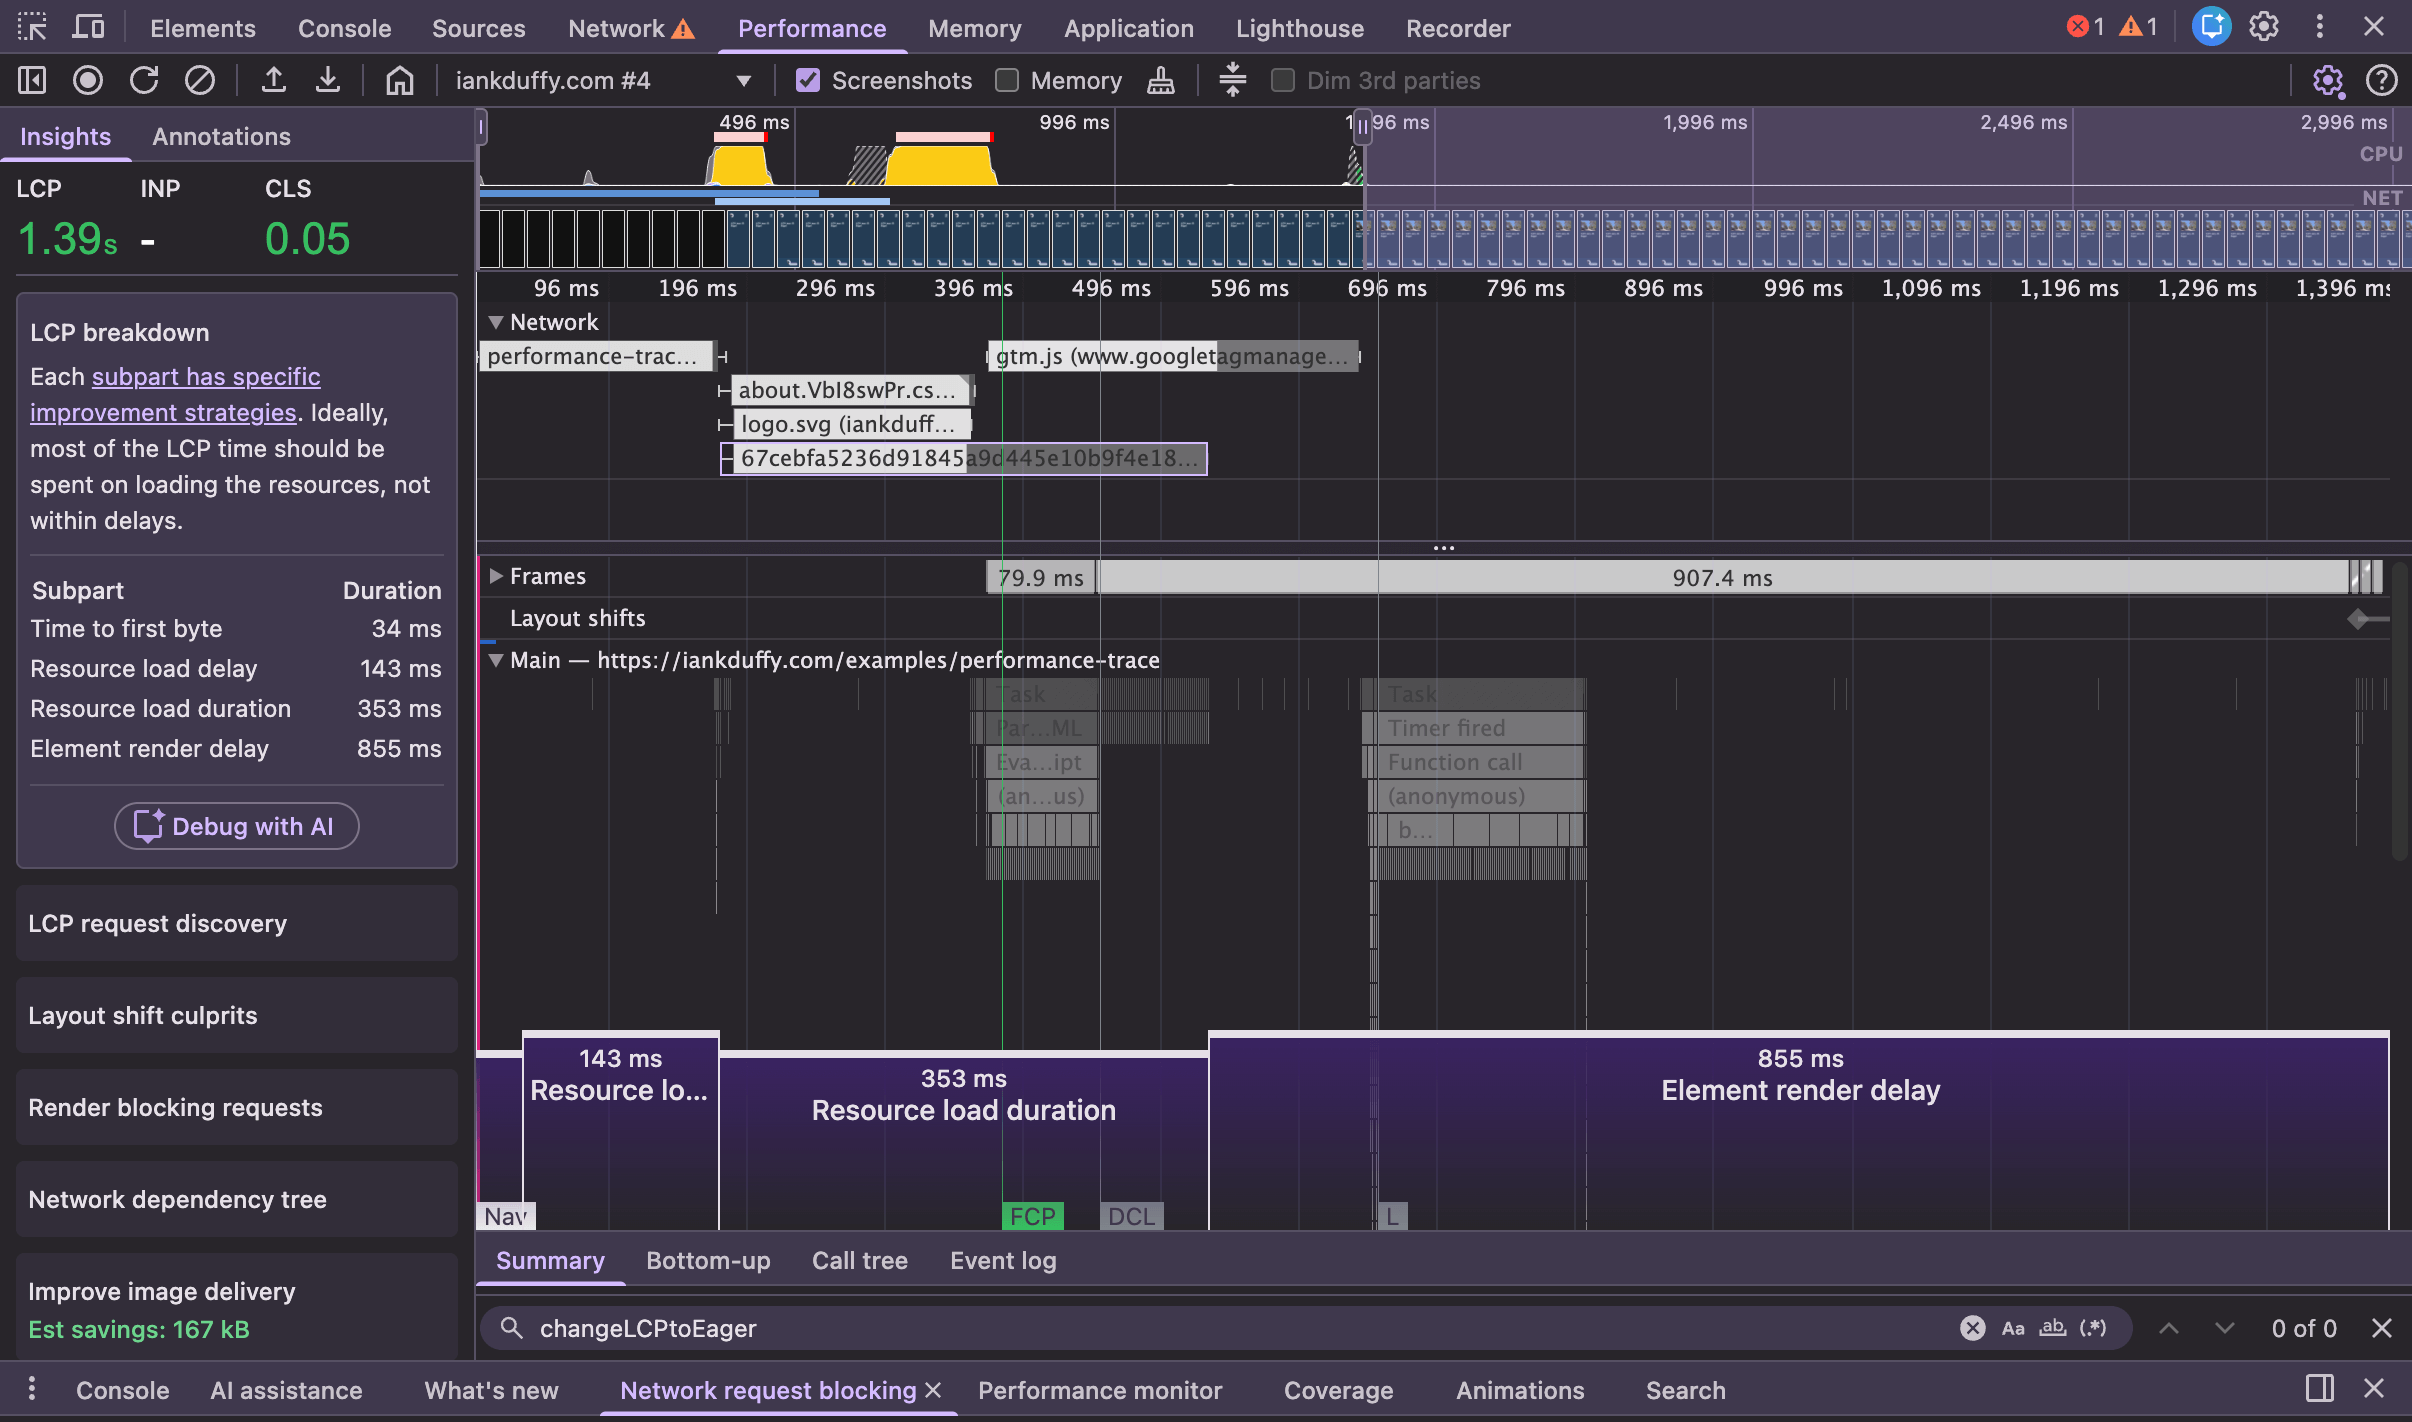
I often use these as a starting point when looking at performance issues on a page and work from there. For example, I will look at the break-down of Interaction to Next Paint and look to see if other interactions are similar.
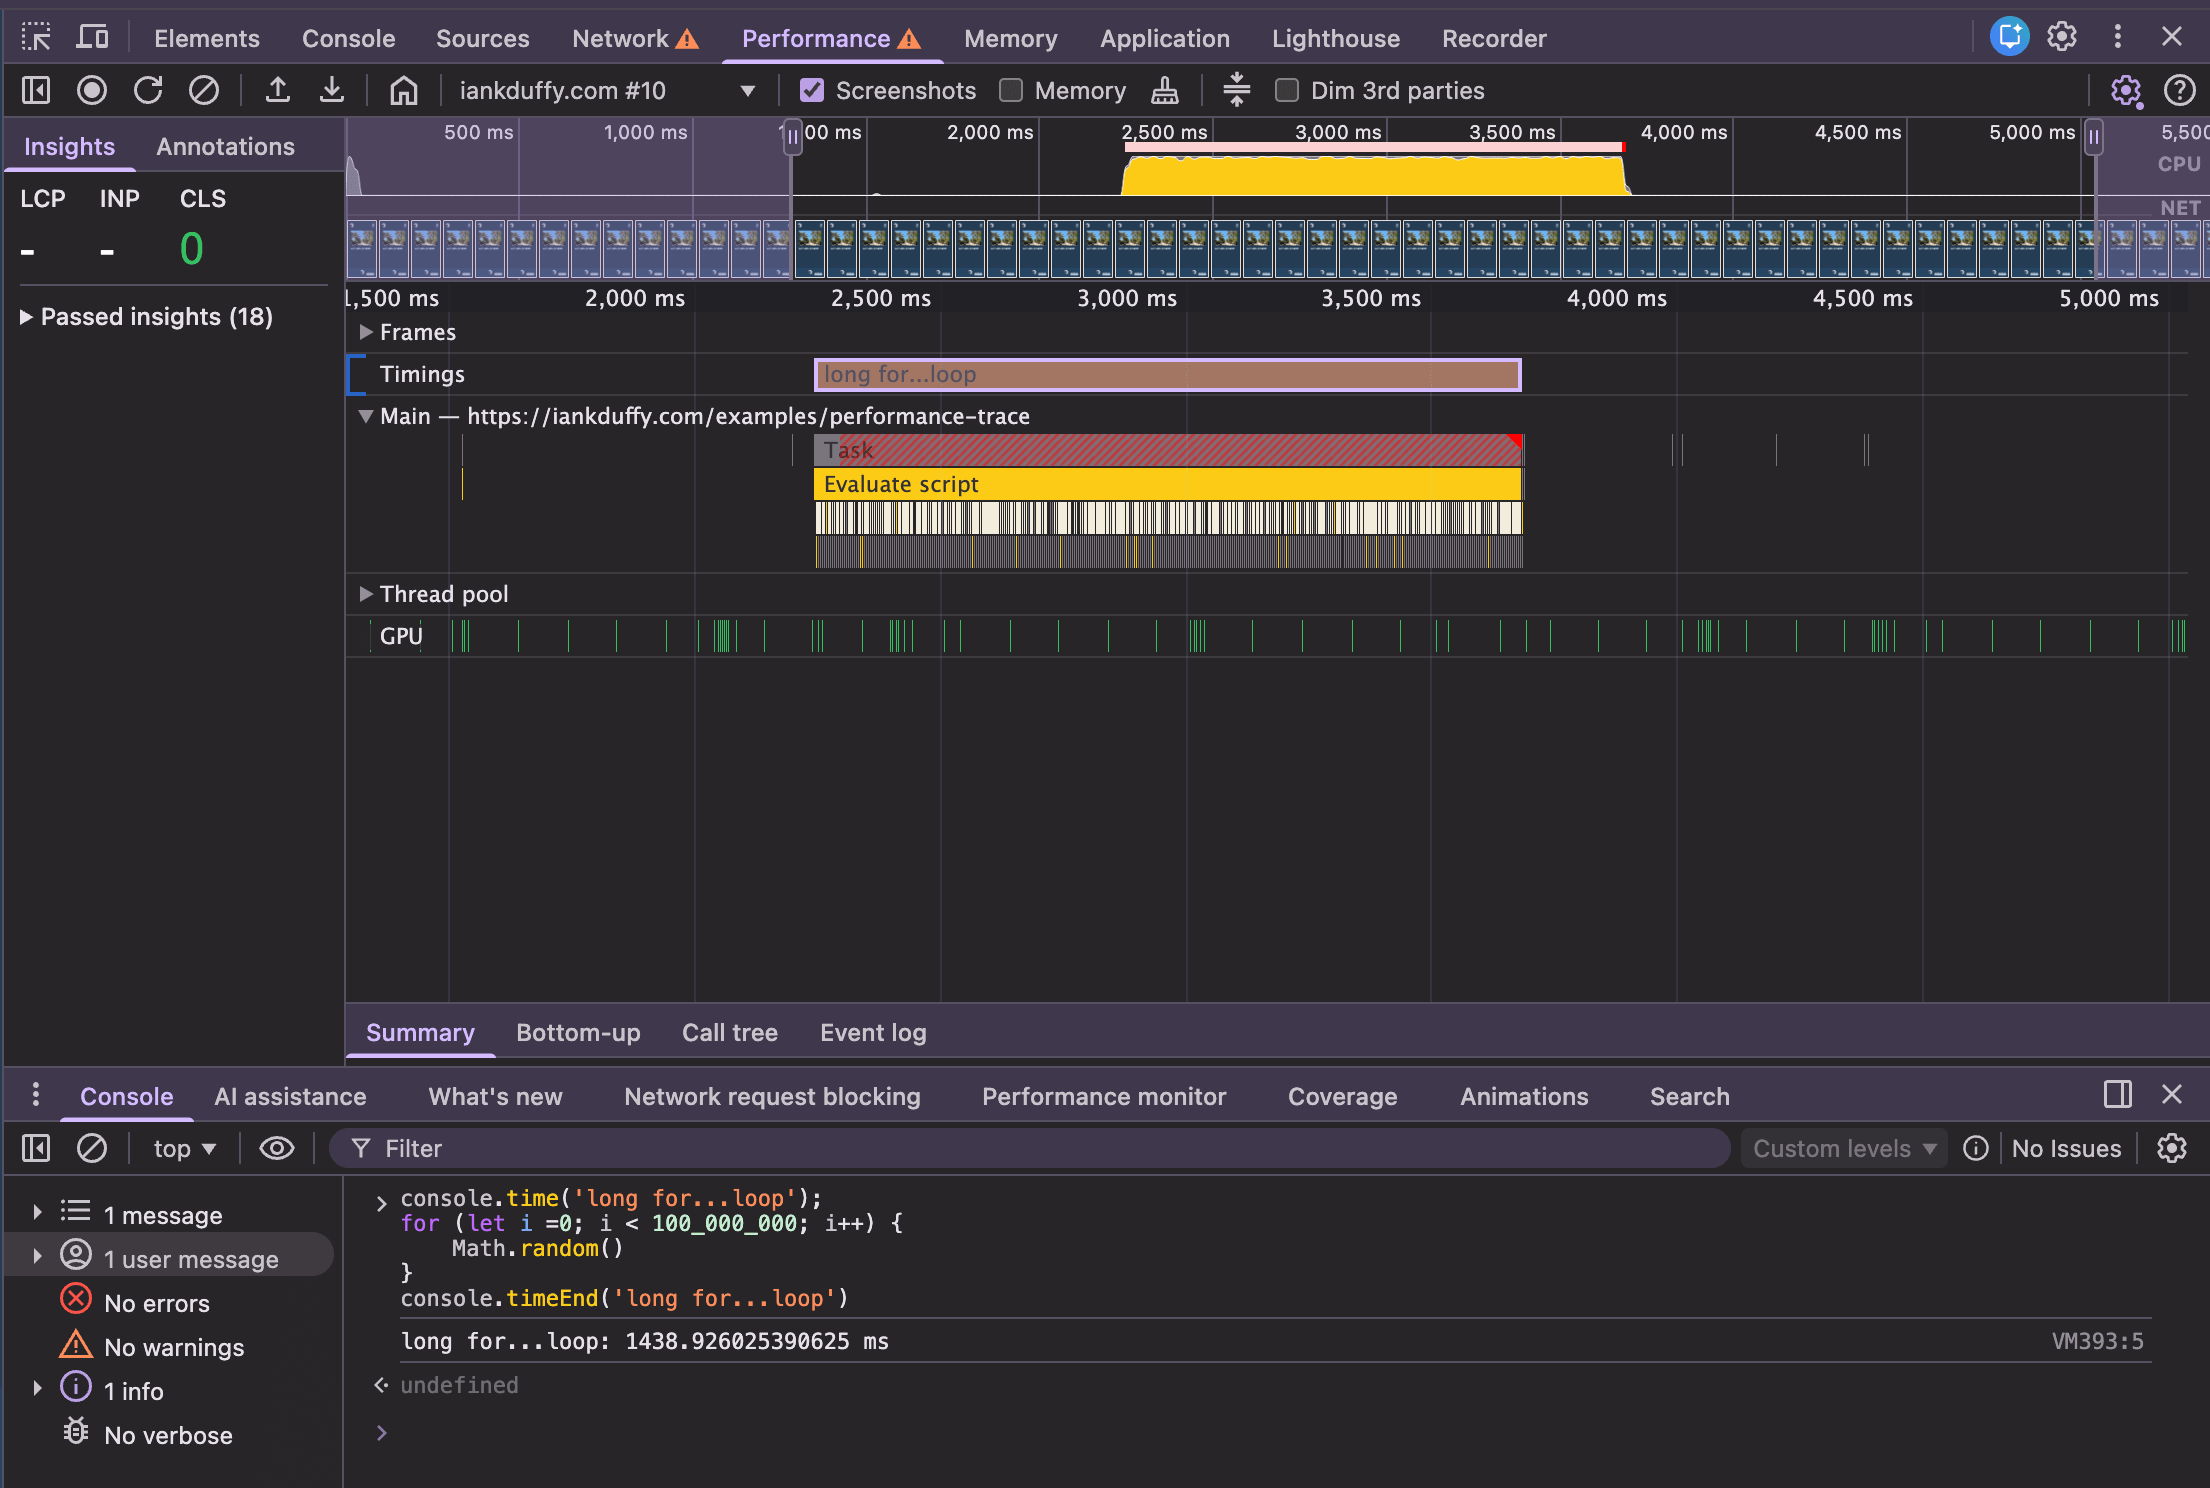
Sometimes you want to focus on refining particular parts such as a function call and want to see them in the performance track. This can be done a number of ways, the most simple is using console.time() before a function call and console.timeEnd() after the function call: this will output the duration to the console. It will also add a track in the performance trace, with name default or the label if provided as an argument, for example in the below screenshot I have wrapped console time/timeEnd around a large for loop while running a performance trace.
For more advanced use cases there is the Performance Measure API which can be used to add custom tracks via extensibility api, which gives more control of the track added to the performance trace.
This can be used by creating a named performance.mark() before and after a function call, and then passing these identifiers to the performance.measure() API as start and end value, and a detail object which allows you to configure the DevTools track.
performance.mark('start')
for (let i = 0; i < 100_000_000; i++) {}
performance.mark('end');
performance.measure('for loop', {
    start: 'start',
    end: 'end',
    detail: {
        devtools: {
            dataType: "track-entry",
            track: "Custom Track Name",
            trackGroup: "Performance Timeline",
            color: "tertiary-dark",
            tooltipText: 'for loop'
        }
    }
});
Running this in the console, we can see it create a custom track placed in a ‘Custom’ track group and a track with the labels we provided
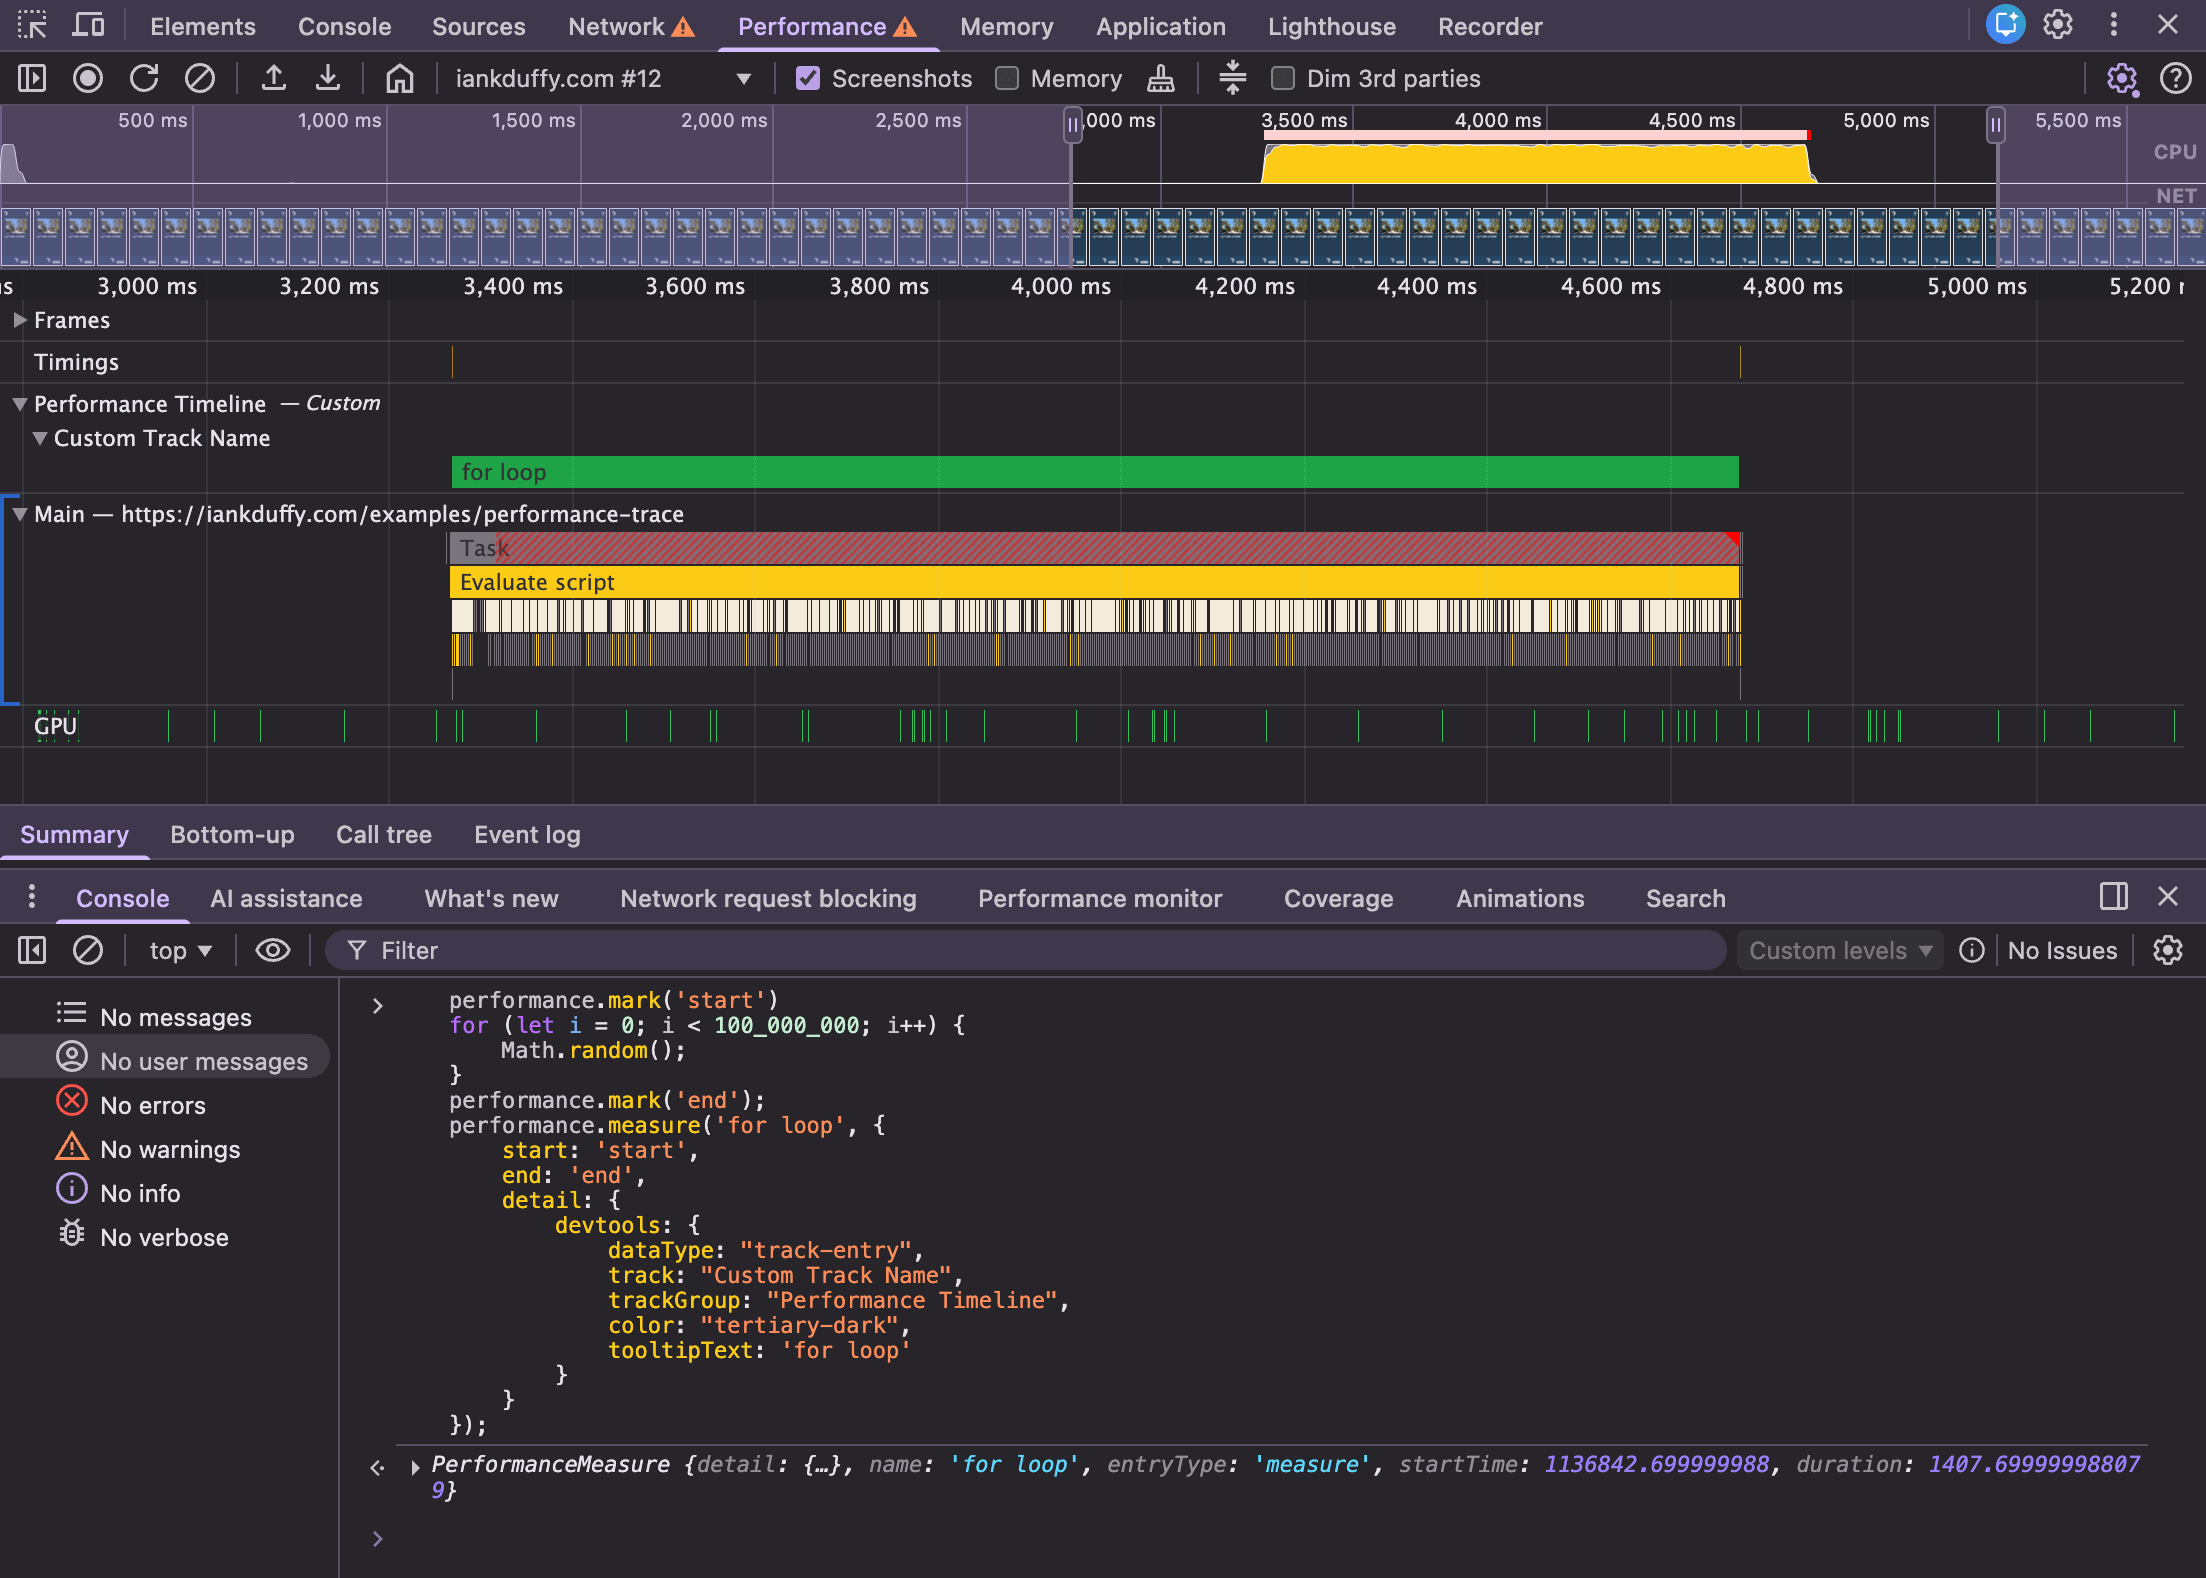
These methods to add custom tracks to a performance trace can be great for measuring sensitive functions that could cause performance issues. For React apps, I use these methods when looking for function calls in React components that could benefit from memoization.
I also often use these custom tracks in my workflow with Chrome overrides so I can measure parts of the first party / third party scripts that are creating issues or bookmarklets script to help me debug performance issues like long animation frames.
Looking at large performance traces can be overwhelming with a lot of information on the screen, but using a mix of performance panels features can make it easier to focus on the important parts, and explain complex performance issues to others.
Huge thanks to Ryan Townsend for reviewing this article and providing feedback.
此内容由惯性聚合(RSS阅读器)自动聚合整理,仅供阅读参考。 原文来自 — 版权归原作者所有。