


Most developers open Chrome DevTools, check a couple of network requests, maybe refresh the page once or twice — and that’s it.
I used to do the same.
Over time, DevTools became something else entirely for me. Not just a debugging tool, but a way to understand how the browser actually experiences my code — and how users do.
These are the Chrome DevTools features I keep coming back to. Not because they’re flashy, but because they change how I think about building the web.
The DOM is not what screen readers see.
Assistive technologies rely on the Accessibility Tree, a semantic representation derived from the DOM. Chrome DevTools lets you inspect it directly from the Elements panel by clicking the small “person” icon in the top-right corner.
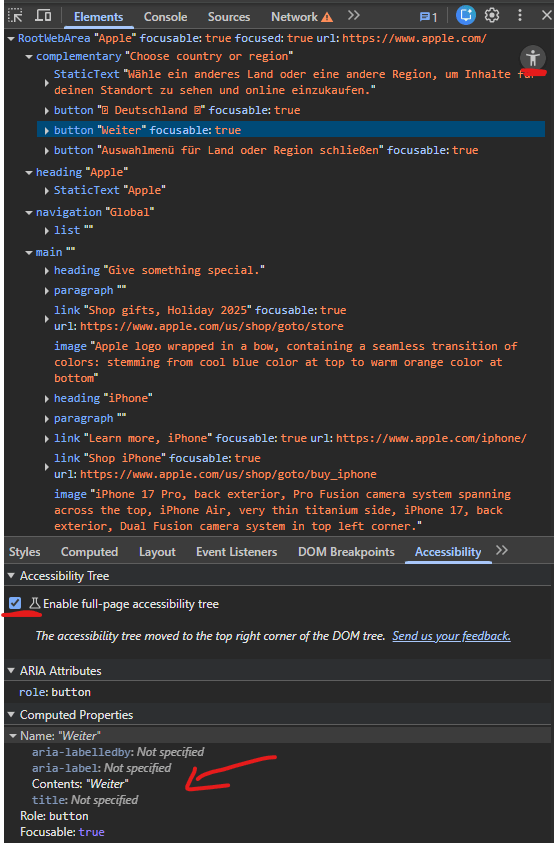
Once you do, you start noticing things:
Comparing the DOM tree with the accessibility tree is one of the fastest ways to understand whether your UI actually makes sense beyond visuals.
If accessibility matters to you — and it should — this view is invaluable.
Lighthouse is often treated as a one-off audit you run on initial page load.
But users don’t experience websites as static pages. They click, type, navigate, and wait.
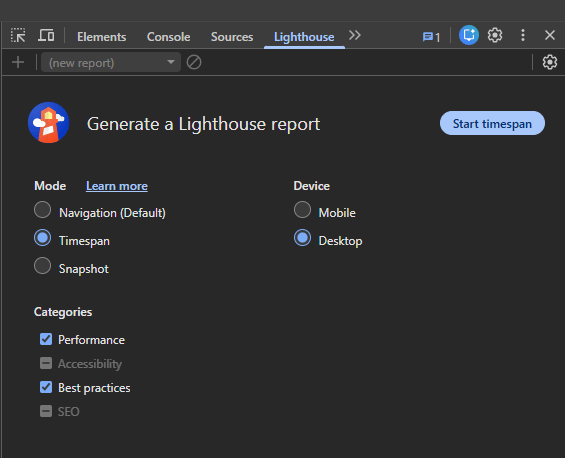
Lighthouse timespans let you measure performance across real interactions:
This is especially useful for authenticated experiences, dashboards, and checkout flows — places where performance issues tend to hide.
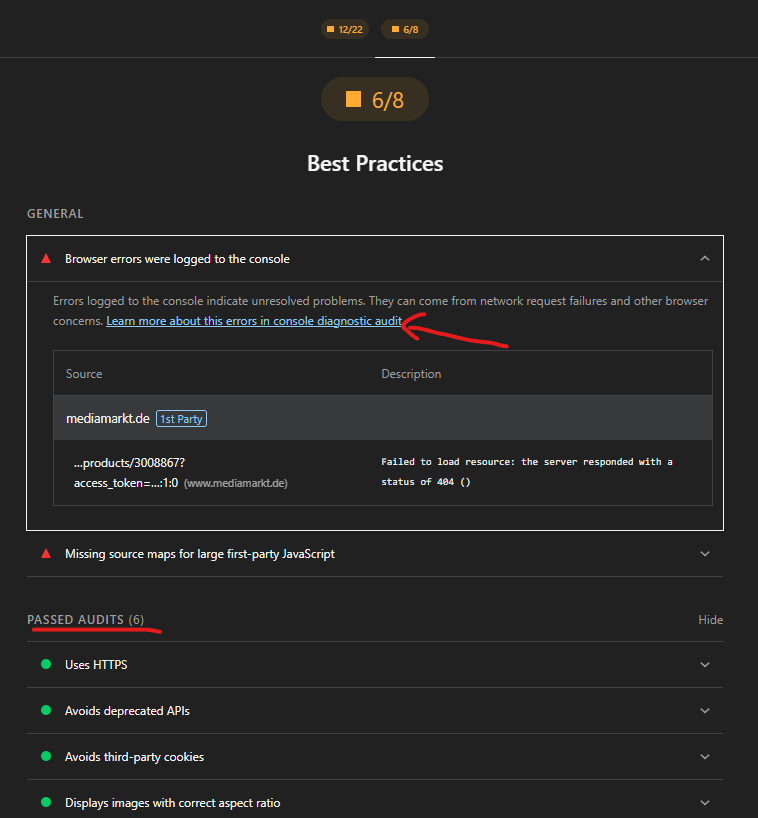
The Lighthouse audit evaluates against a standard list of performance ideals and best practices and gives detailed info for the improvements necessary when a rule is violated in the audit.
In the Network panel, you can right-click any request and block it.
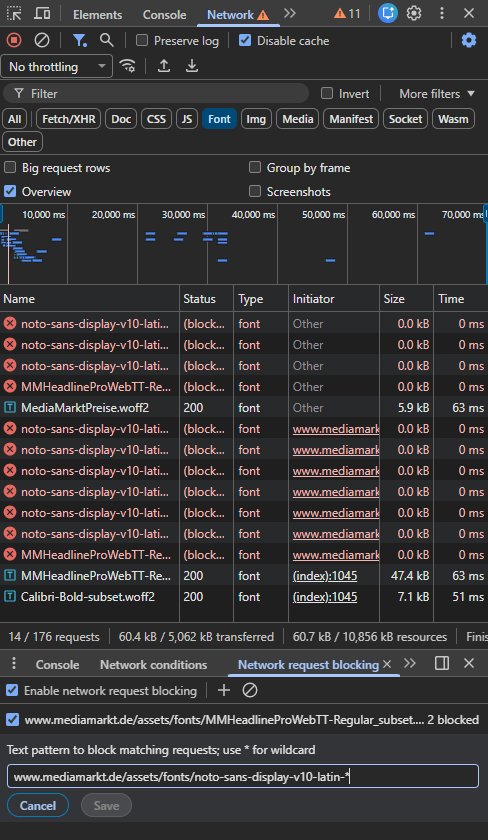
It sounds simple, but it unlocks powerful questions:
You can even block entire URL patterns using wildcards.
This feature forces you to think less like a developer on fast Wi-Fi — and more like a real user on an unreliable connection.
The Performance panel is intimidating at first. Flame charts, timelines, colors everywhere.
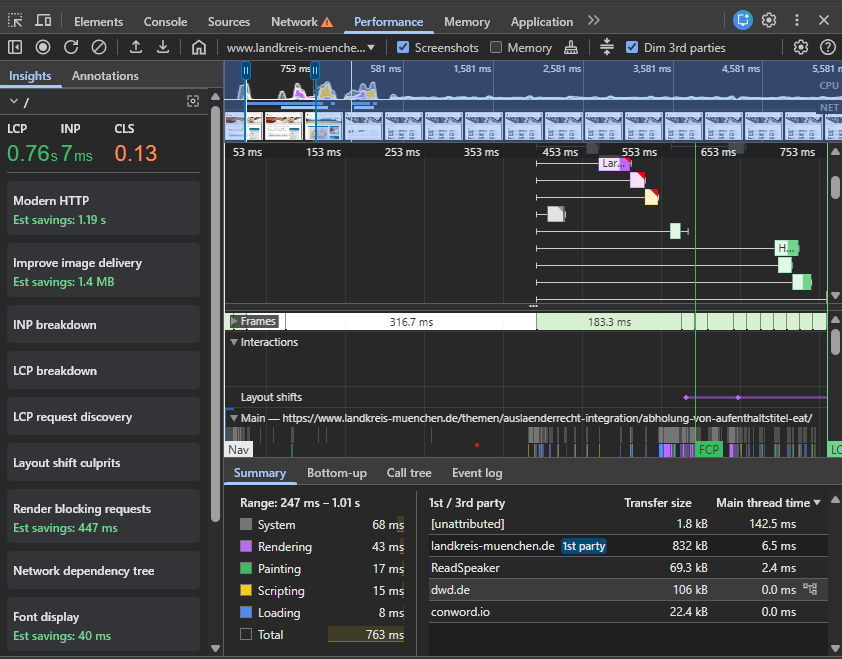
But it’s also where browser behavior becomes visible.
Here’s what I mainly use it for:
Beyond the metrics, the panel teaches you how the browser works:
If you care about performance, this panel is worth the time investment.
Modern websites are full of third-party scripts. Analytics, ads, widgets, A/B testing tools.
They clutter performance profiles.
Chrome DevTools has a simple option in the Performance panel: Dim 3rd parties.
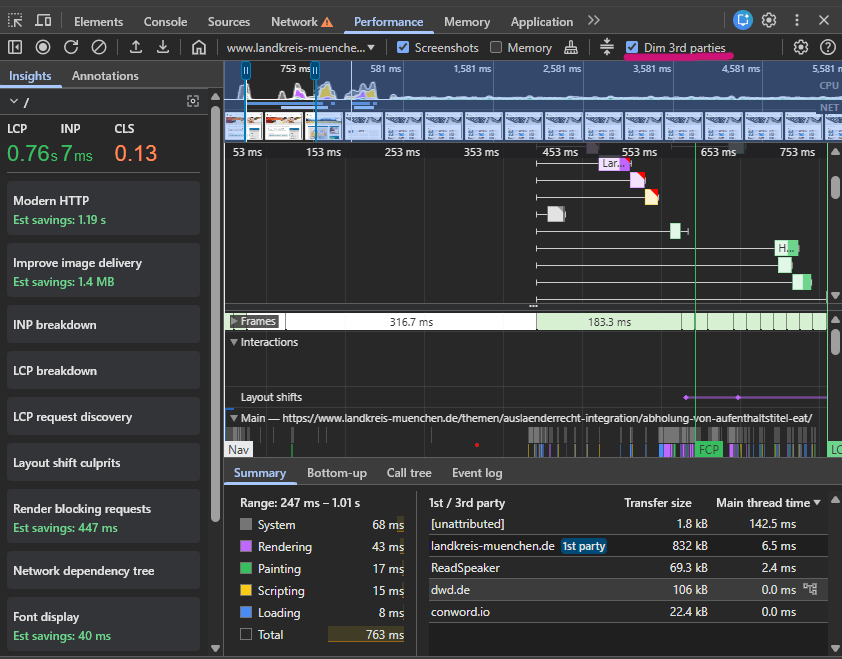
Once enabled:
It’s a small toggle with a big impact on readability.
The Recorder panel is one of the most underrated features in DevTools.
It lets you:
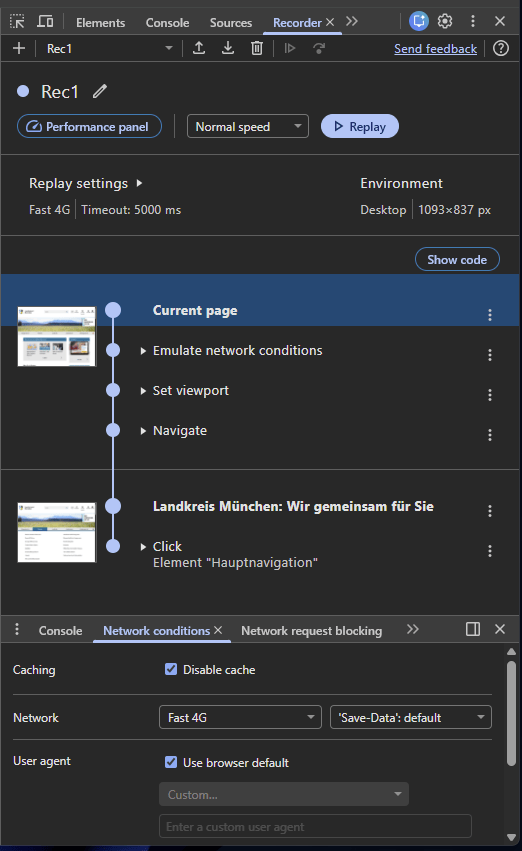
You can even export flows as Puppeteer scripts or generate performance profiles from them.
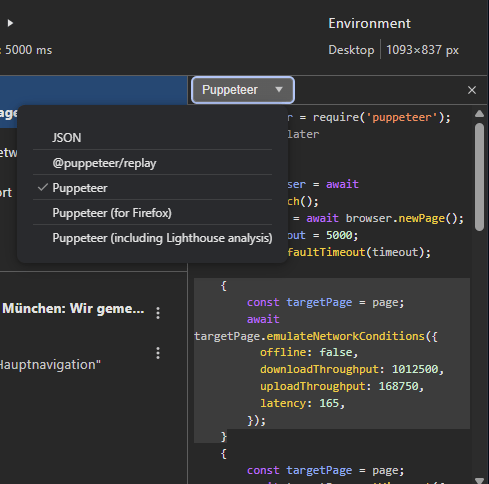
Recorder bridges the gap between:
Desktop Chrome is convenient.
Mobile devices are reality.
With remote debugging, you can inspect Chrome running directly on an Android device via chrome://inspect.
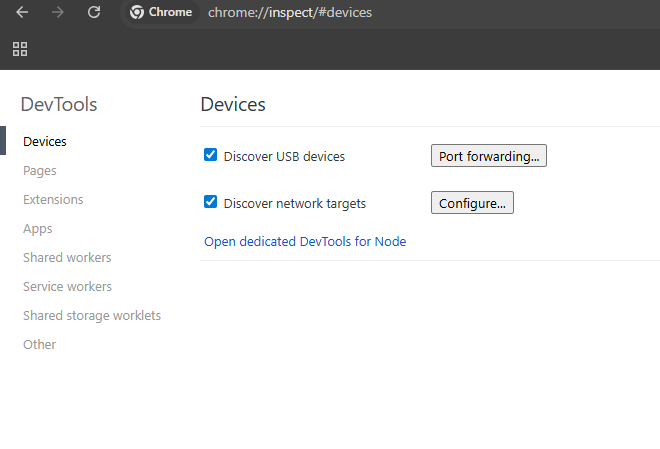
This matters because:
If you’ve never debugged on an actual phone, you’re missing an important part of the picture.
Chrome DevTools isn’t just about fixing bugs faster.
It’s about:
Everything in this article is just a starting point. But if you regularly use even a few of these features, your frontend instincts will improve — almost automatically.
And yes, reading DevTools changelogs makes you real fun at parties.
Thanks for reading!
此内容由惯性聚合(RSS阅读器)自动聚合整理,仅供阅读参考。 原文来自 — 版权归原作者所有。