








Today, we’ll look at measuring React component render performance with the React Profiler API, measuring interactions with React’s new experimental Interaction Tracing API and measuring custom metrics using the User Timing API.
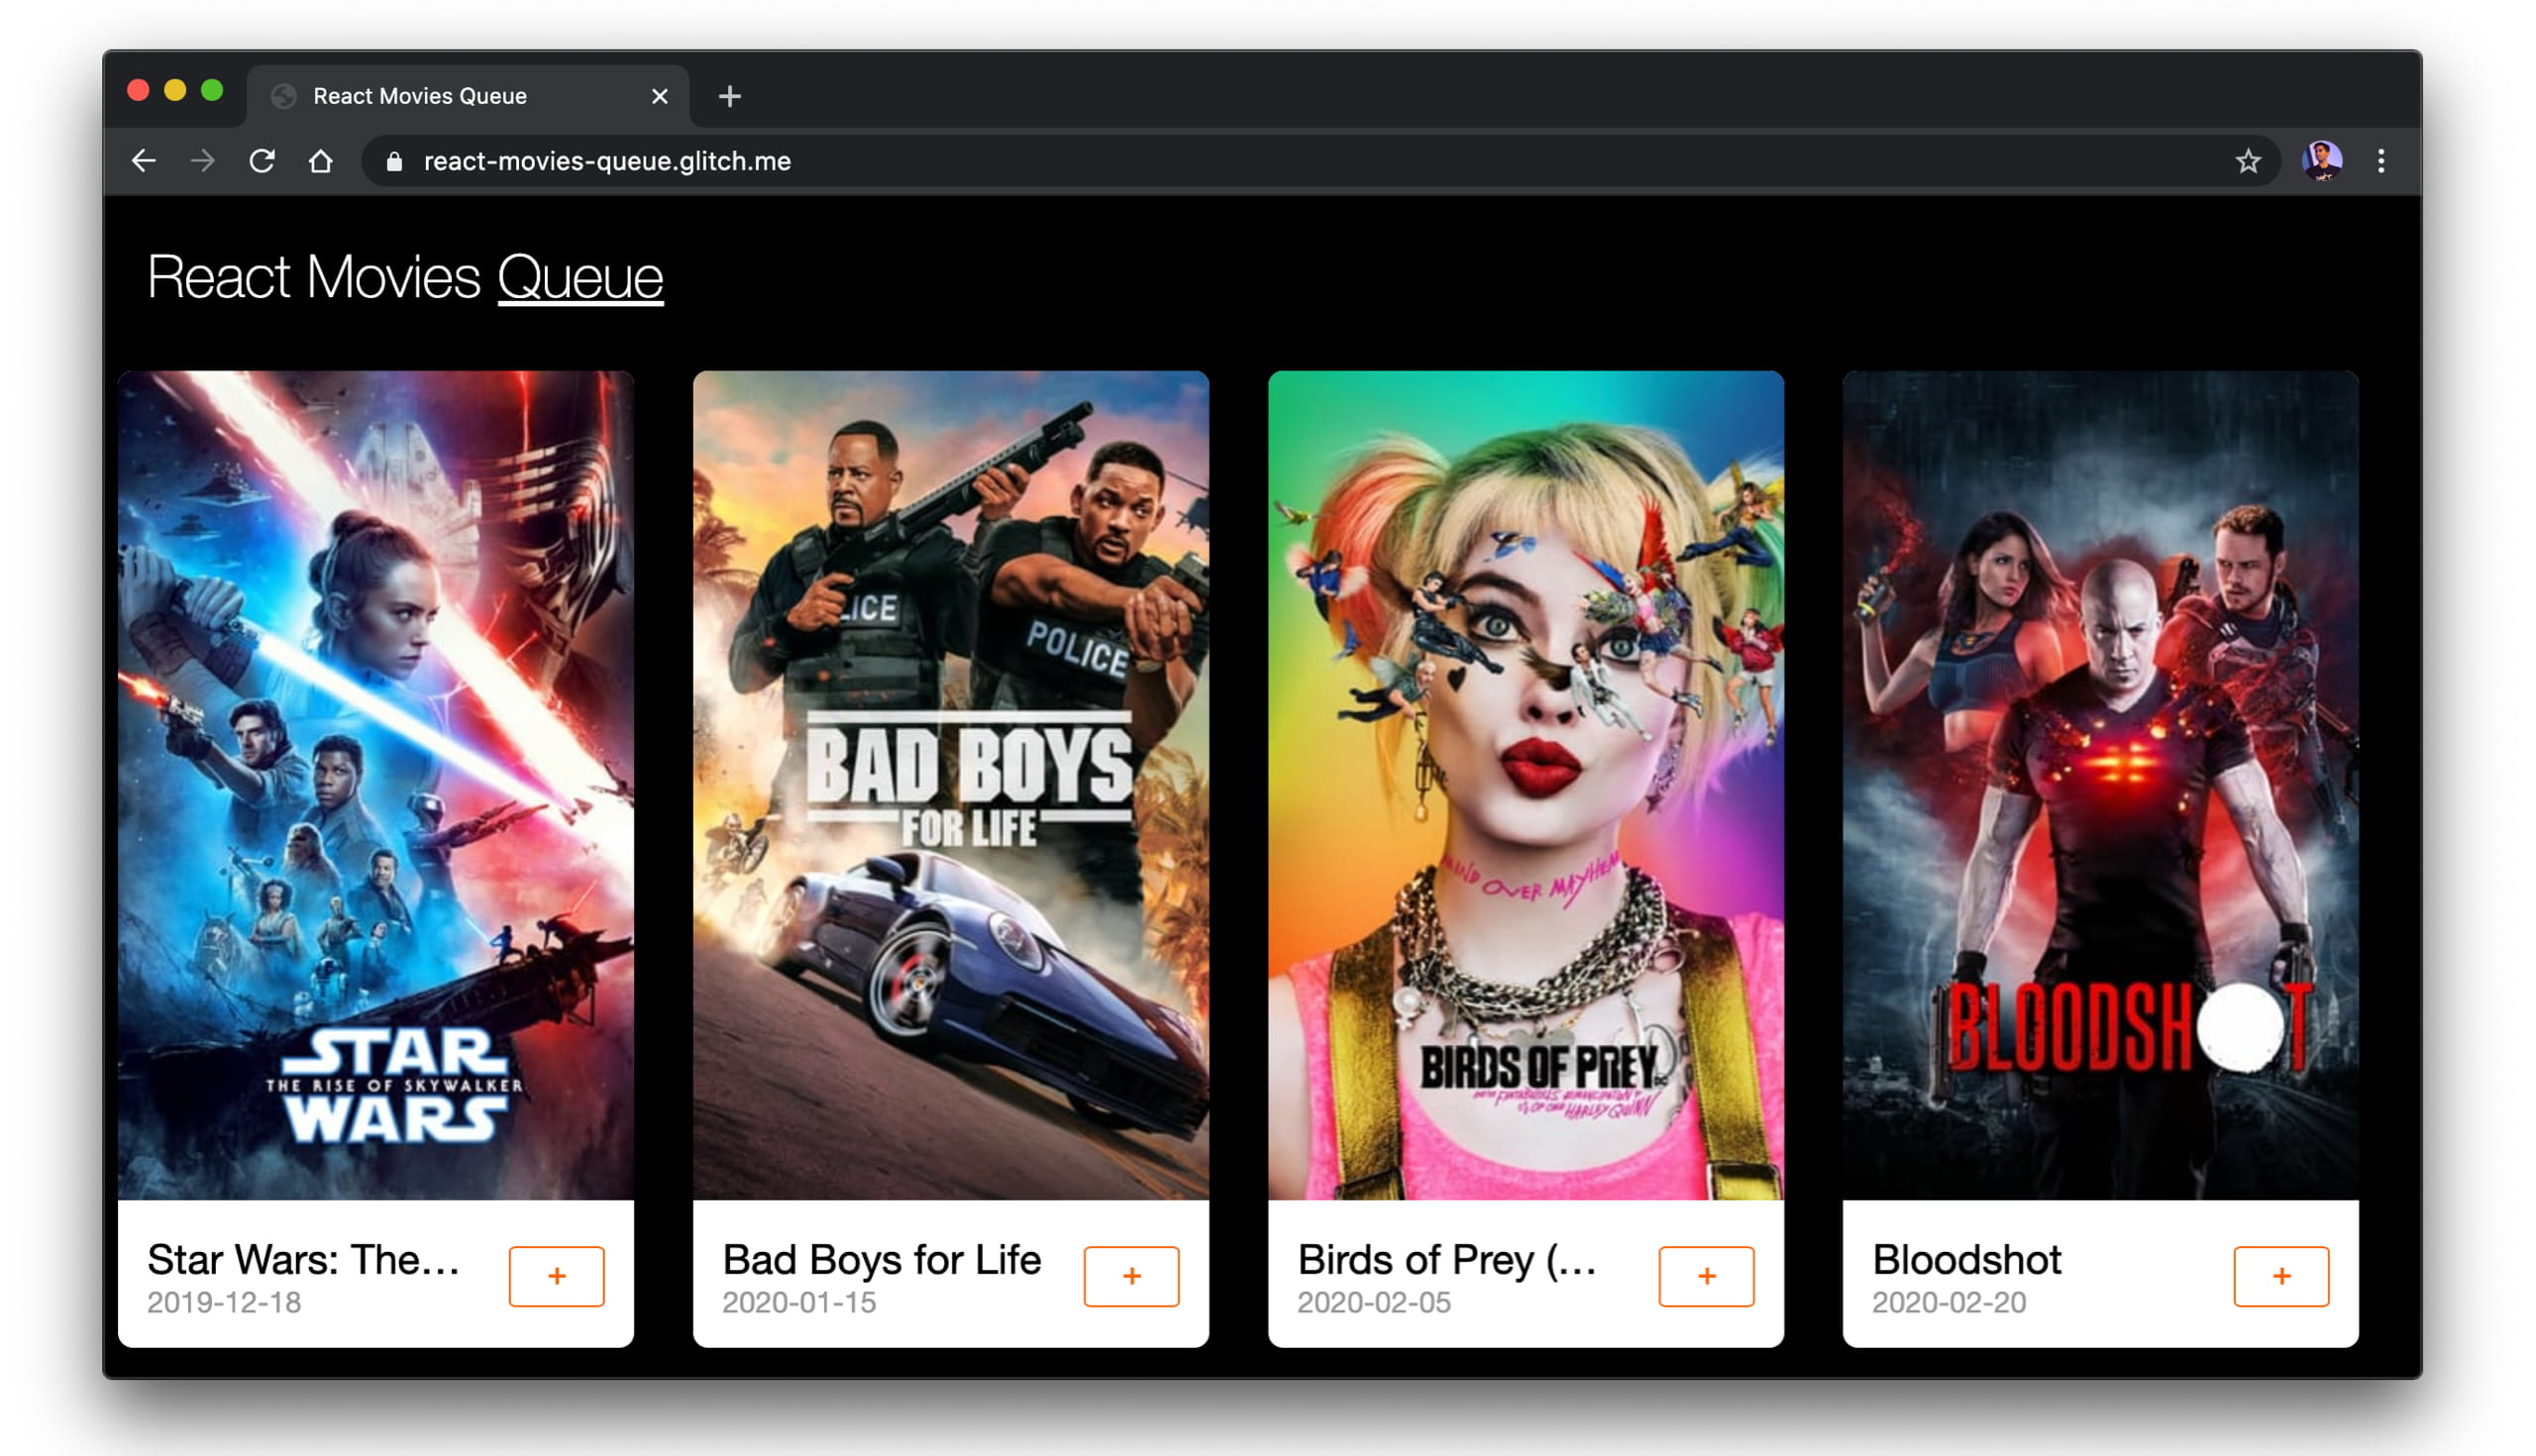
For demonstration purposes, we’ll be using a Movie queueing app.
The React Profiler API measures renders and the cost of rendering to help identify slow bottlenecks in applications.
import React, { Fragment, unstable_Profiler as Profiler} from "react";
The Profiler takes an onRender callback as a prop that is called any time a component in the tree being profiled commits an update.
const Movies = ({ movies, addToQueue }) => (
  <Fragment>
    <Profiler id="Movies" onRender={callback}>
For testing purposes, let’s try measuring the rendering time of parts of a Movies component with the Profiler. It’s this:
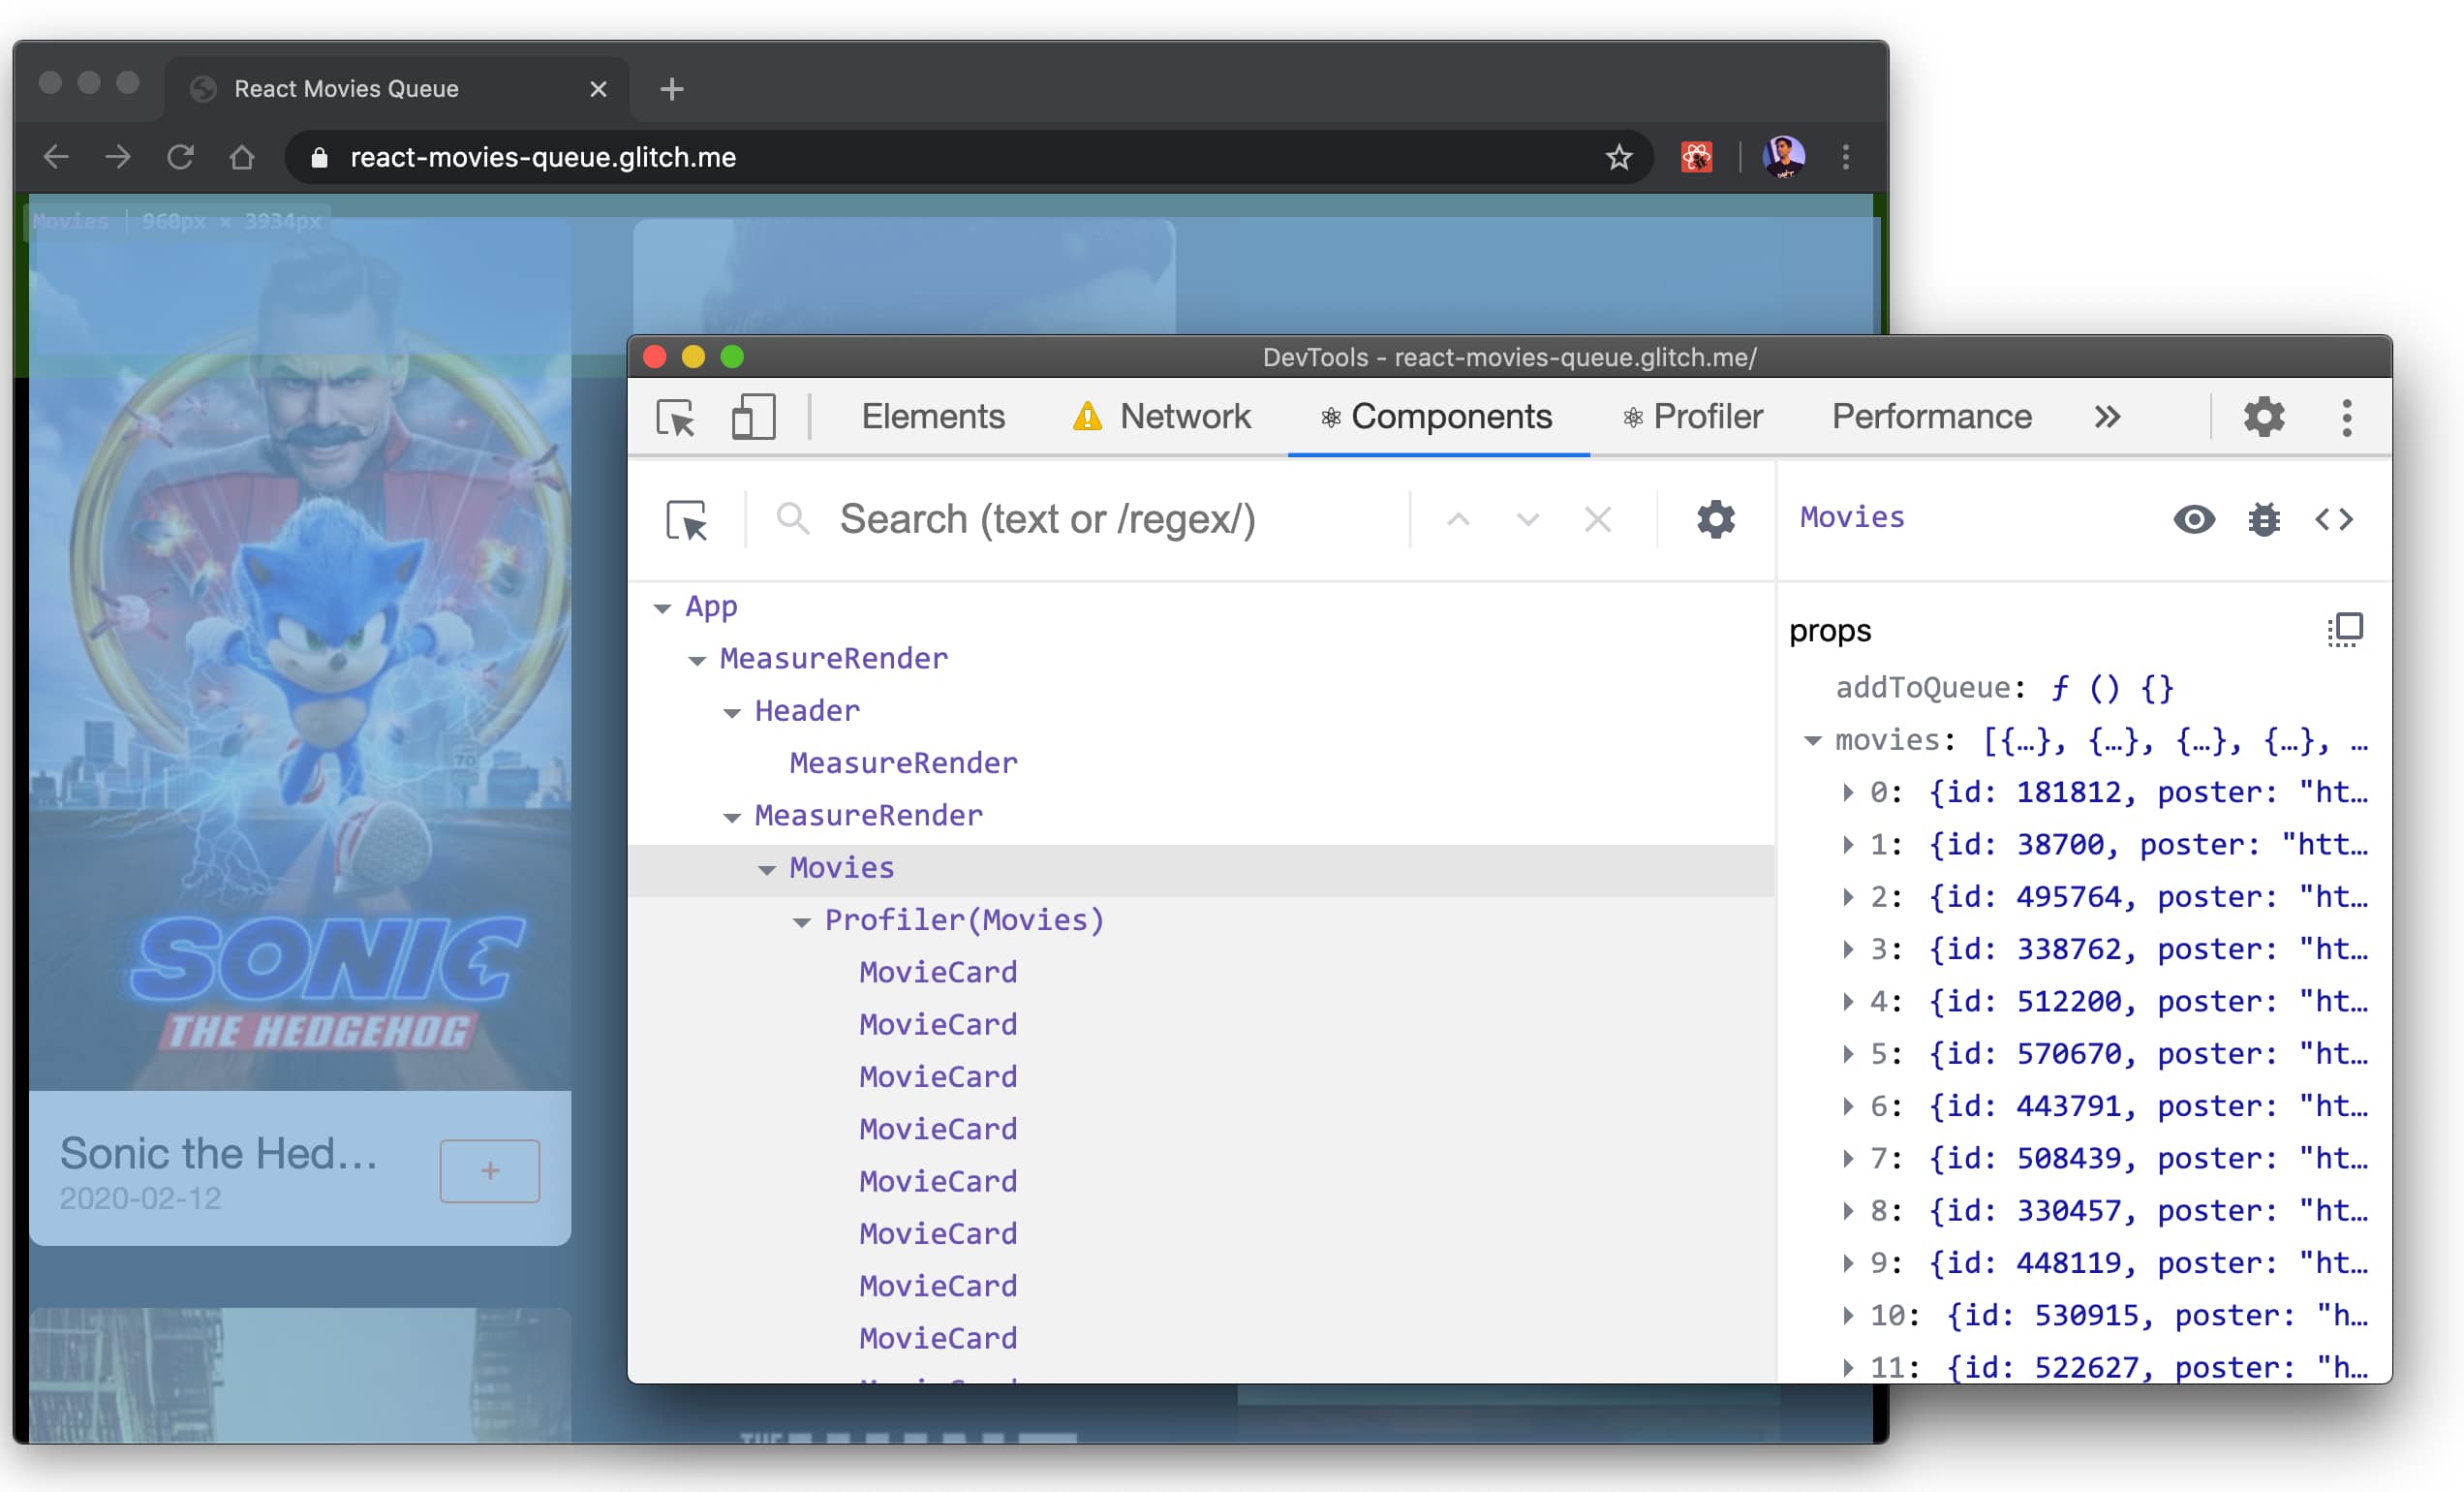
The Profiler’s onRender callback accepts parameters that describe what was rendered and the length of time it took. These include:
const callback = (id, phase, actualTime, baseTime, startTime, commitTime) => {
    console.log(`${id}'s ${phase} phase:`);
    console.log(`Actual time: ${actualTime}`);
    console.log(`Base time: ${baseTime}`);
    console.log(`Start time: ${startTime}`);
    console.log(`Commit time: ${commitTime}`);
}
We can load our page, head over to the Chrome DevTools console and should see the following timings:

We can also open the React DevTools, go to the Profiler tab and visualize our component Rendering times. Below is the Flame-graph view:

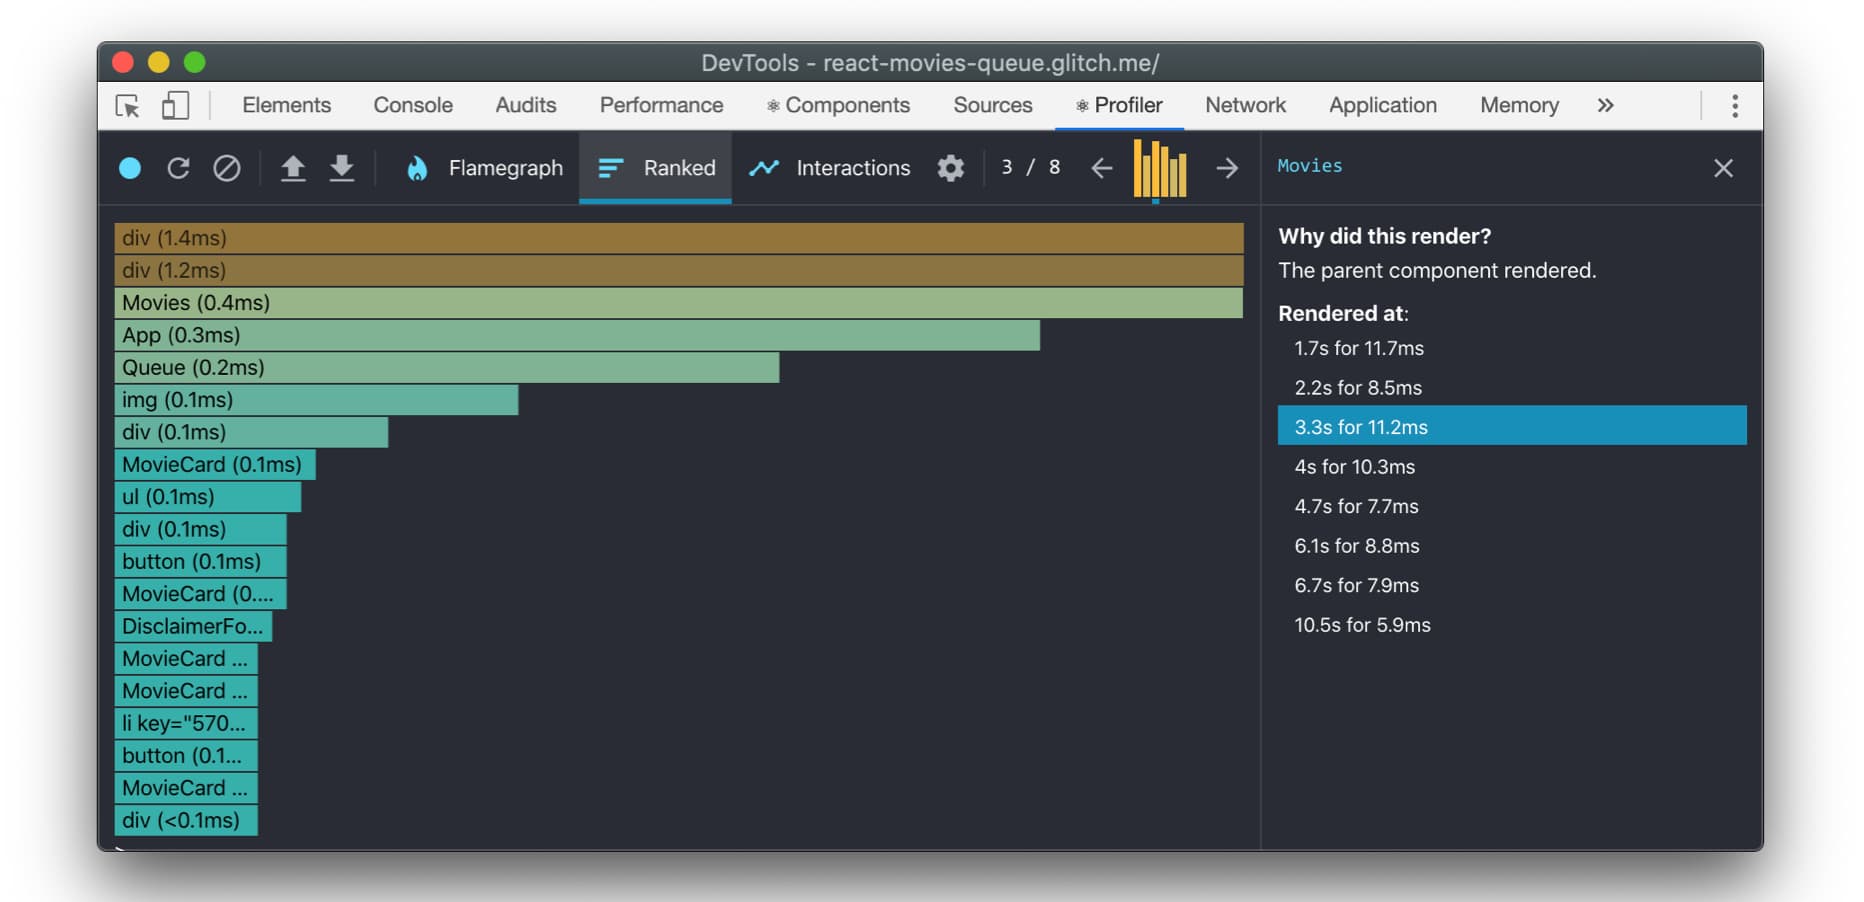
I also enjoy using Ranked view, which is ordered so components taking the longest to render are shown at the top:
It’s also possible to use multiple Profilers for measuring different parts of your application:
import React, { Fragment, unstable_Profiler as Profiler} from "react";

render(
  <App>
    <Profiler id="Header" onRender={callback}>
      <Header {...props} />
    </Profiler>
    <Profiler id="Movies" onRender={callback}>
      <Movies {...props} />
    </Profiler>
  </App>
);
But, what if you want interaction tracing?
It would be powerful if we could trace interactions (e.g clicking UI) to answer questions like “How long did this button click take to update the DOM?”. Thanks to Brian Vaughn, React has experimental support for interaction tracing via the interaction tracing API in the new scheduler package. It is documented in more detail here.
Interactions are annotated with a description (e.g “Add To Cart button clicked”) and a timestamp. Interactions should also be provided a callback where you can do work related to the interaction.
In our Movies application, we have an “Add Movie To Queue” button (“+”). Clicking this interaction adds the movie to your watch queue:

Below is an example of tracing state updates for this interaction:
import { unstable_Profiler as Profiler } from "react";
import { render } from "react-dom";
import { unstable_trace as trace } from "scheduler/tracing";

class MyComponent extends Component {
  addMovieButtonClick = event => {
    trace("Add To Movies Queue click", performance.now(), () => {
      this.setState({ itemAddedToQueue: true });
    });
  };
}
We can record this interaction and see the duration for it presented in the React DevTools:

It’s also possible to trace initial render using the interaction tracing API, as follows:
import { unstable_trace as trace } from "scheduler/tracing";

trace("initial render", performance.now(), () => {
   ReactDom.render(<App />, document.getElementById("app"));
});

Brian covers a lot more examples, such as how to trace async work, in his interaction tracing with React gist.
For even deeper scripted tracing of UI interactions, you might be interested in Puppeteer. Puppeteer is a Node library providing a high-level API for controlling headless Chrome over the DevTools protocol.
It exposes tracing.start()/stop() helpers for capturing a DevTools performance trace of work. Below, we use it to trace what happens when you click a primary button.
const puppeteer = require('puppeteer');

(async () => {
  const browser = await puppeteer.launch();
  const page = await browser.newPage();
  const navigationPromise = page.waitForNavigation();
  await page.goto('https://react-movies-queue.glitch.me/')
  await page.setViewport({ width: 1276, height: 689 });
  await navigationPromise;

  const addMovieToQueueBtn = 'li:nth-child(3) > .card > .card__info > div > .button';
  await page.waitForSelector(addMovieToQueueBtn);

  // Begin profiling...
  await page.tracing.start({ path: 'profile.json' });
  // Click the button
  await page.click(addMovieToQueueBtn);
  // Stop profliling
  await page.tracing.stop();

  await browser.close();
})()
Loading profile.json into the DevTools Performance panel, we can see all of the resulting JavaScript function calls from clicking our button:

If you are interested in reading more on this topic, check out JavaScript component-level CPU costs by Stoyan Stefanov.
The User Timing API enables measuring custom performance metrics for applications using high-precision timestamps. window.performance.mark() stores a timestamp with the associated name and window.performance.measure() stores the time elapsed between two marks.
// Record the time before running a task
performance.mark('Movies:updateStart');
// Do some work

// Record the time after running a task
performance.mark('Movies:updateEnd');

// Measure the difference between the start and end of the task
performance.measure('moviesRender', 'Movies:updateStart', 'Movies:updateEnd');
When you profile a React app using the Chrome DevTools Performance panel, you’ll find a section called “Timings” populated with processing time for your React components. While rendering, React is able to publish this info with the User Timing API.

Note: React is removing User Timings from their DEV bundles in favor of React Profiler, which provides more accurate timings. They may re-add it for Level 3 spec browsers in the future.
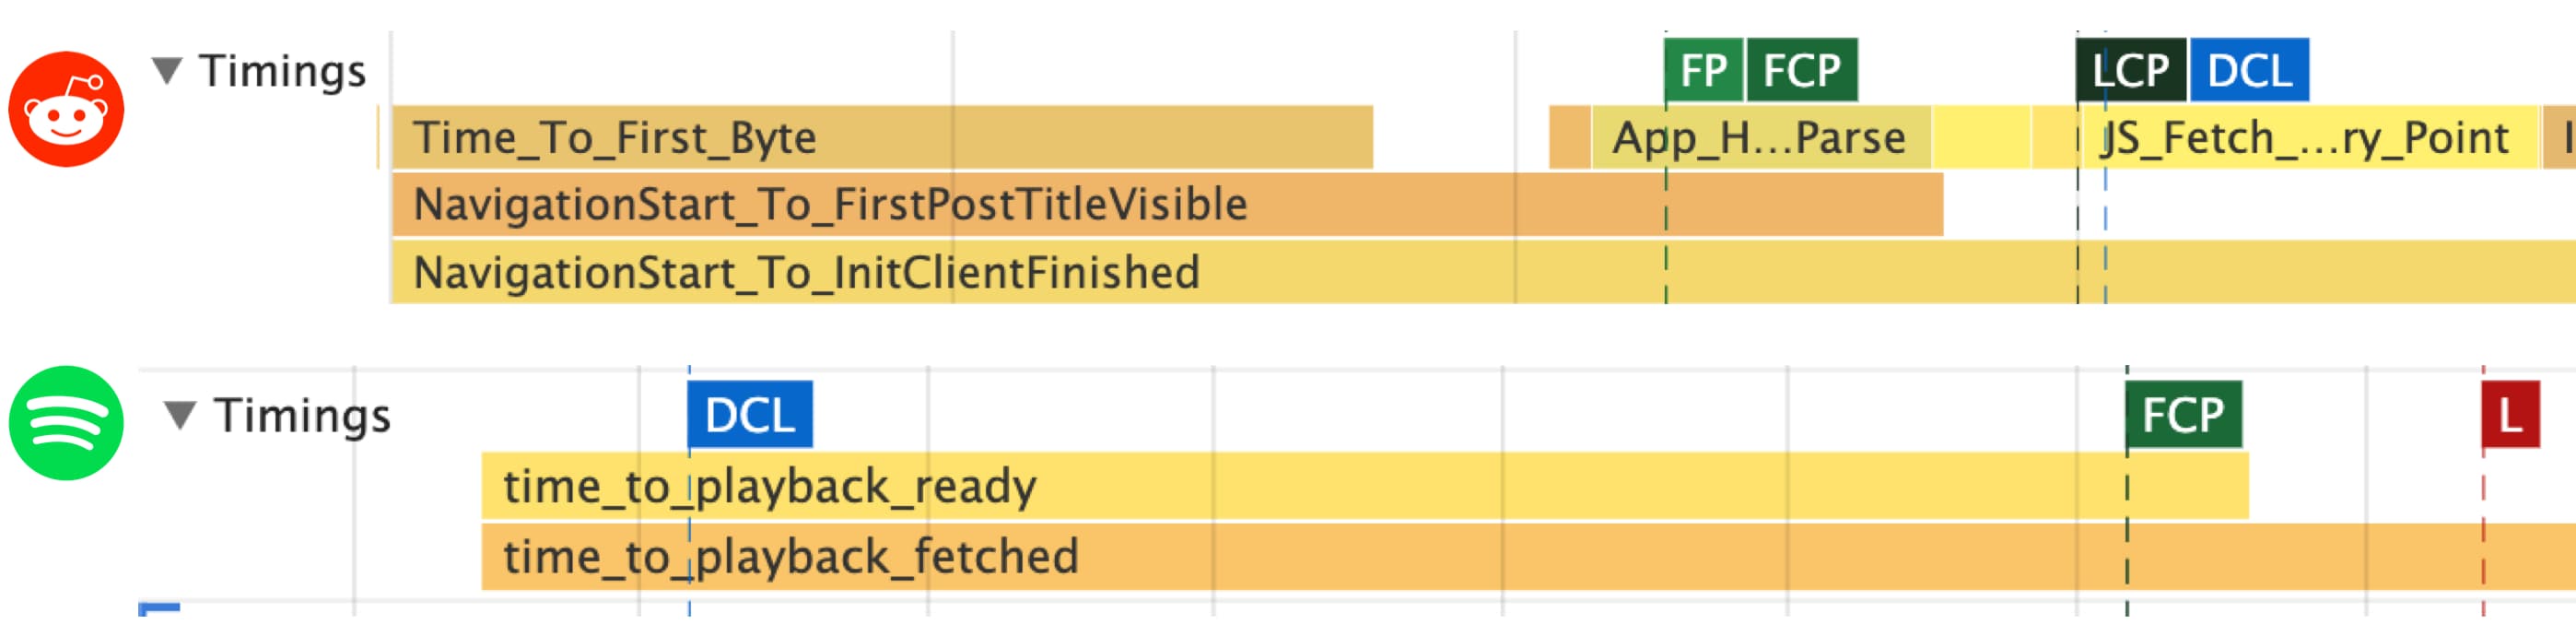
Across the web, you’ll find otherwise React apps leveraging User Timing to define their own custom metrics. These include Reddit’s “Time to first post title visible” and Spotify’s “Time to playback ready”:
Custom User Timing marks and measures are also conveniently reflected in the Lighthouse panel in Chrome DevTools:
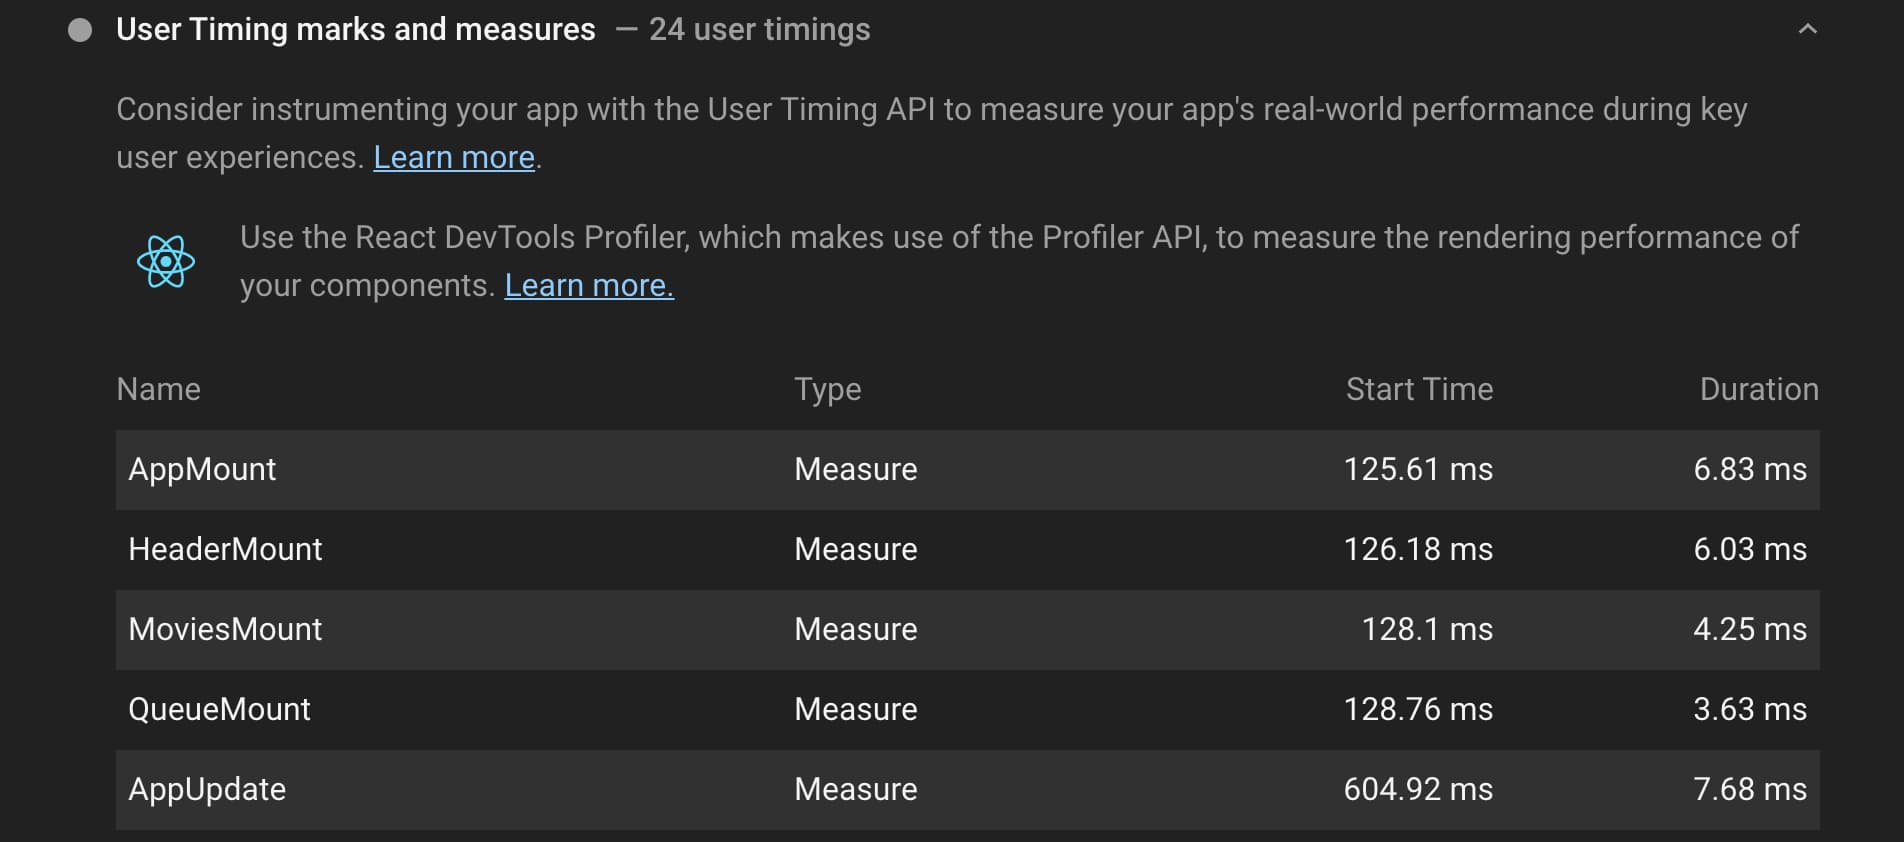
Recent versions of Next.js have also added more user timing marks and measures for a number of events, including:
All of these measures appear in the Timings area:

As a reminder, Lighthouse and the Chrome DevTools Performance panel can be used to deeply analyze load and runtime performance of your React app, highlighting key user-centric happiness metrics:

React users may appreciate new metrics like Total Blocking Time (TBT), which quantifies just how non-interactive a page is prior it to becoming reliably interactive (Time to Interactive). Below we can see the a before/after TBT for an app with Concurrent Mode on where updates are better spread out:

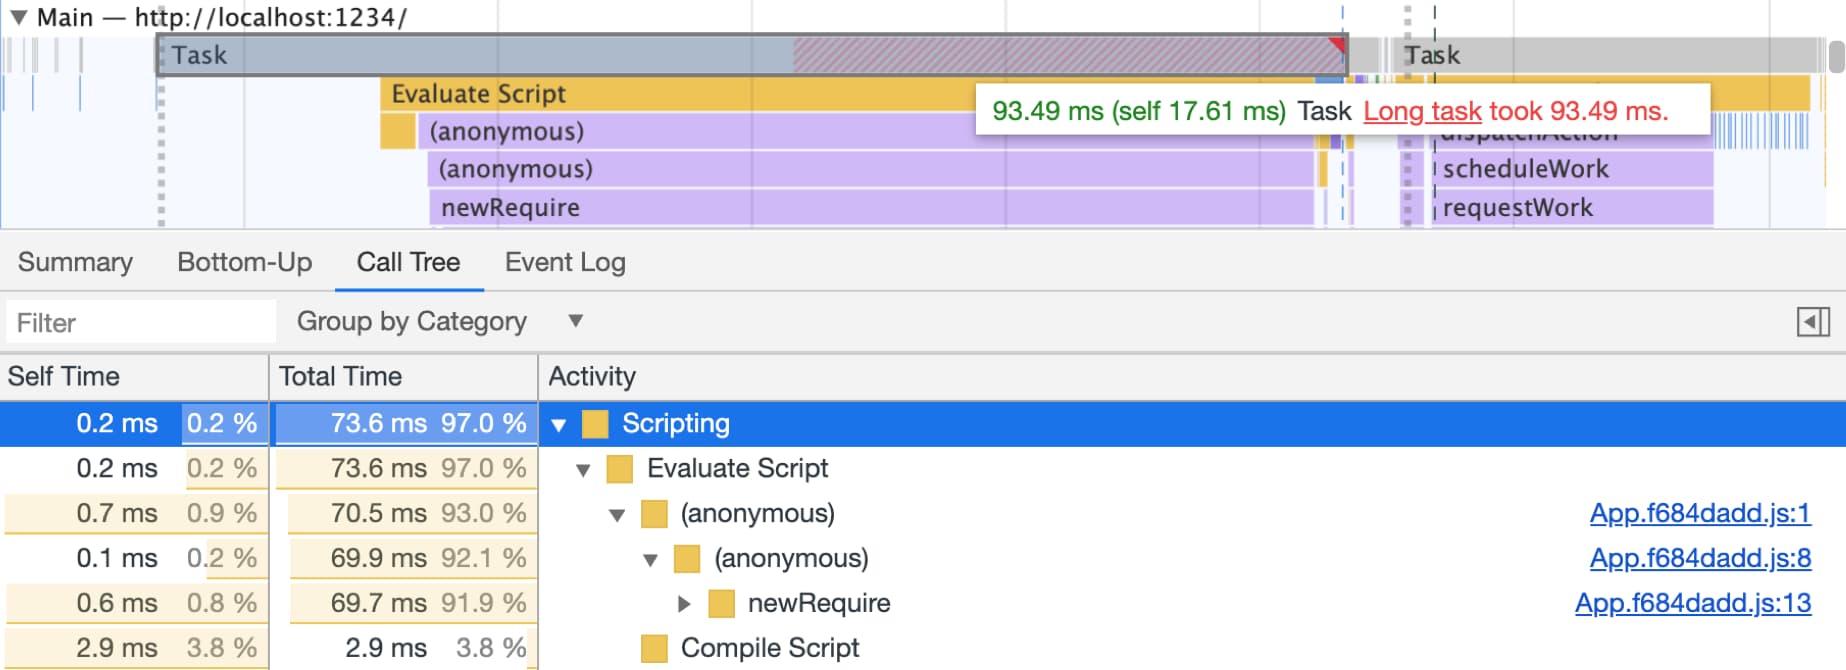
These tools are generally helpful for getting a browser-level view of bottlenecks such as heavy Long Tasks that delay interactions (like button click responsiveness), as seen below:
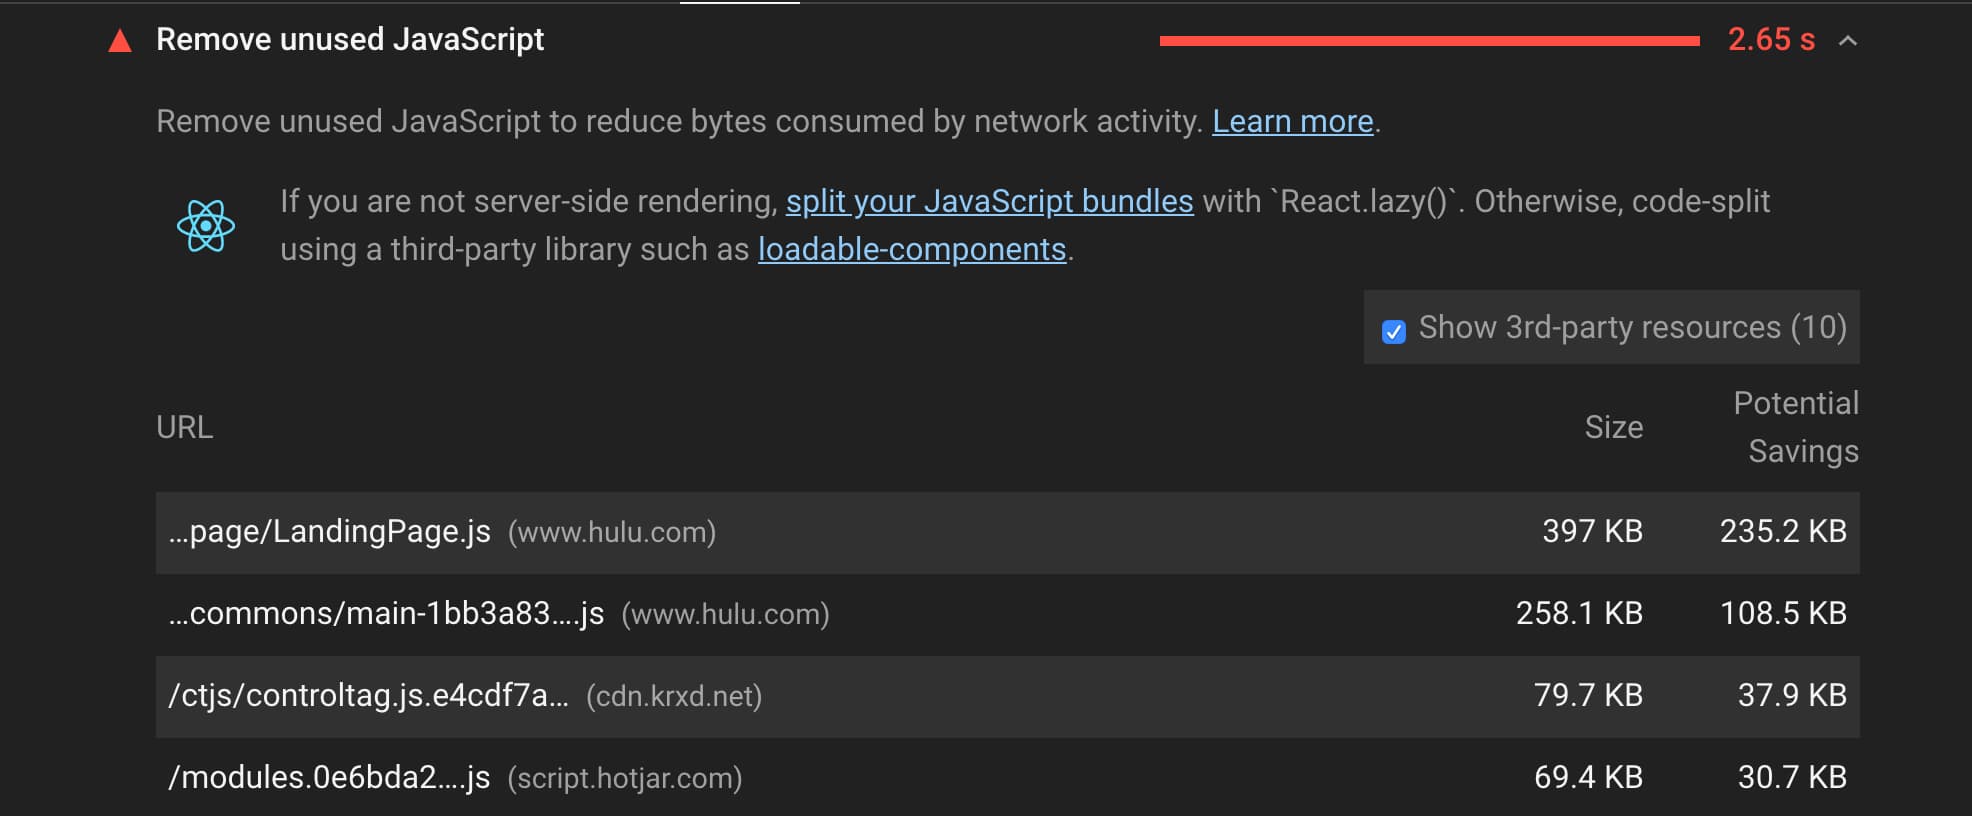
 Lighthouse also offers React-specific guidance for a number of audits. Below, in Lighthouse 6.0 you’ll see a remove unused JavaScript audit, highlighting unused onload JavaScript that could be dynamically imported using React.lazy().
It’s always good to sanity-check performance on hardware representative of your real users. I often rely on webpagetest.org/easy and field-data from RUM and CrUX to paint a more complete picture.
If you’re interested in experimenting with React Profiler on the demo app in this post, the dev demo and source are on Glitch.
此内容由惯性聚合(RSS阅读器)自动聚合整理,仅供阅读参考。 原文来自 — 版权归原作者所有。