Learn how to draw any polygon, ranging from one with just a few sides to a bazillion sides, using a handy trigonometric technique involving a virtual circle.
Earlier, we looked at one approach for drawing a triangle. In this approach, we calculated each of our triangle's three points (aka vertices) using various trigonometric techniques to calculate the proper dimensions:
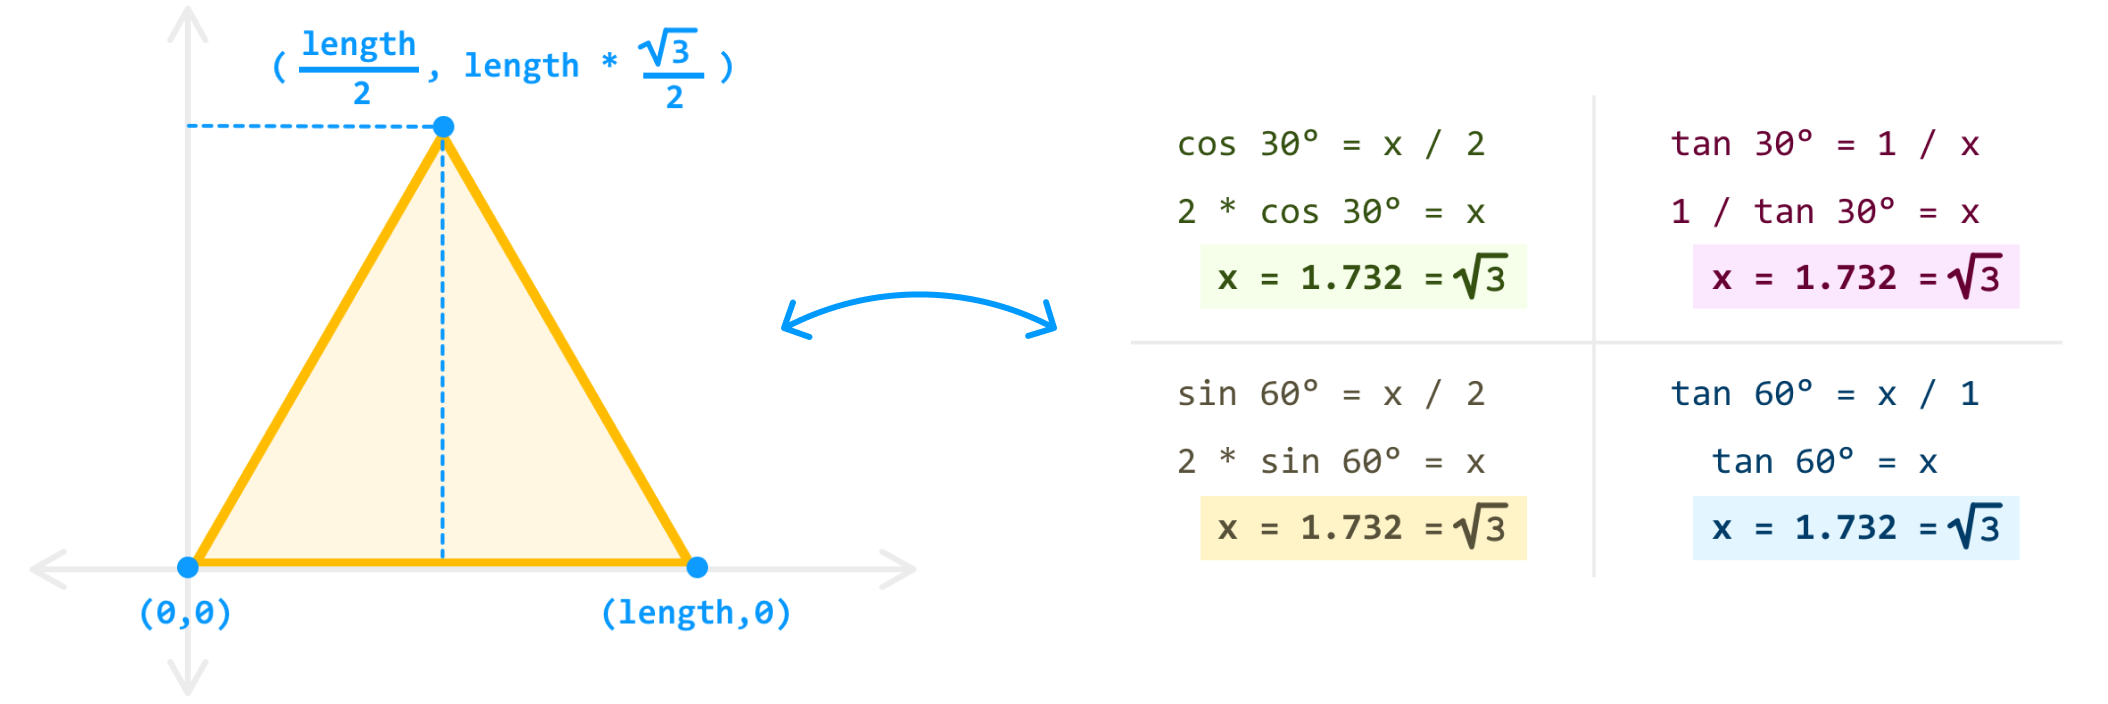
If we wanted to draw something other than a triangle - say a square, a pentagon, an octagon, or any n-sided polygon, we would need to special case our logic to calculate the position of each of our vertices. That's not very fun, especially given the large number of shapes we might want to draw:
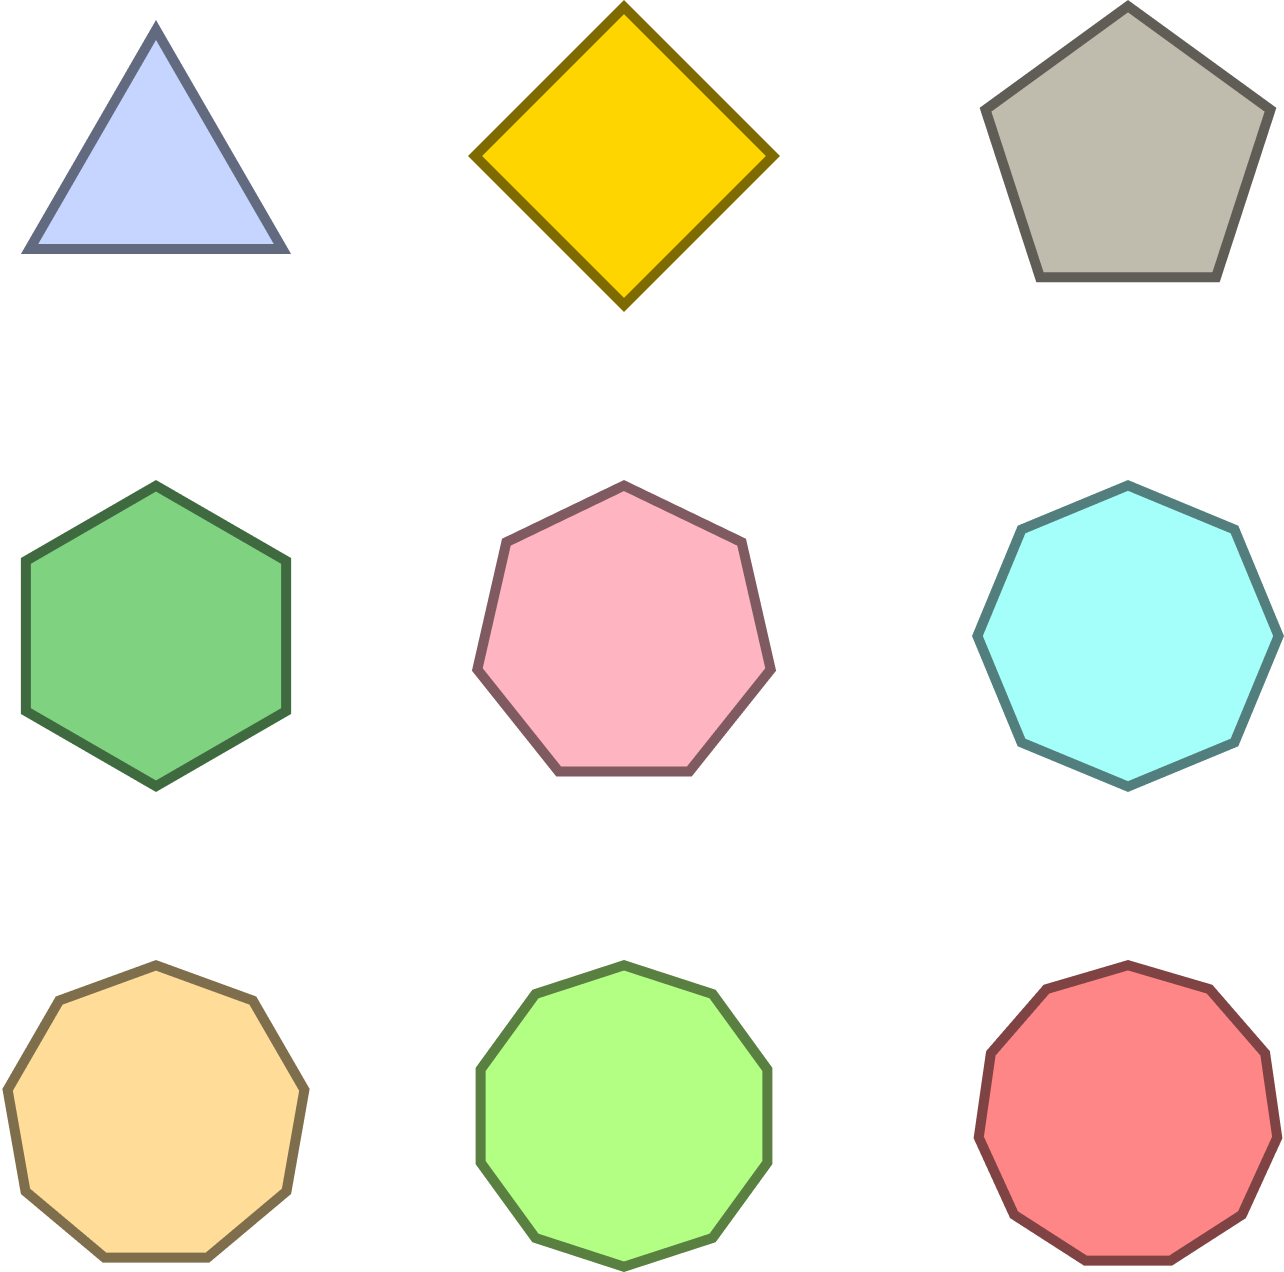
Fortunately, there is a more generalized approach that we can take that allows us to draw any shape we may want. In classic MacGuyver fashion, this approach will involve just a few things: a circle, a calculator, and our good old-fashioned Canvas drawing surface. In the following sections, we'll walk through what this approach is and how to use it.
Onwards!
The Generalized Approach
If we take a step back and look at all of the shapes we may want to draw, there is a detail that is going to help us out greatly. This detail is that all of our shape's vertices can be placed on a circle. This probably makes more sense with a visual, so take a look at the following:
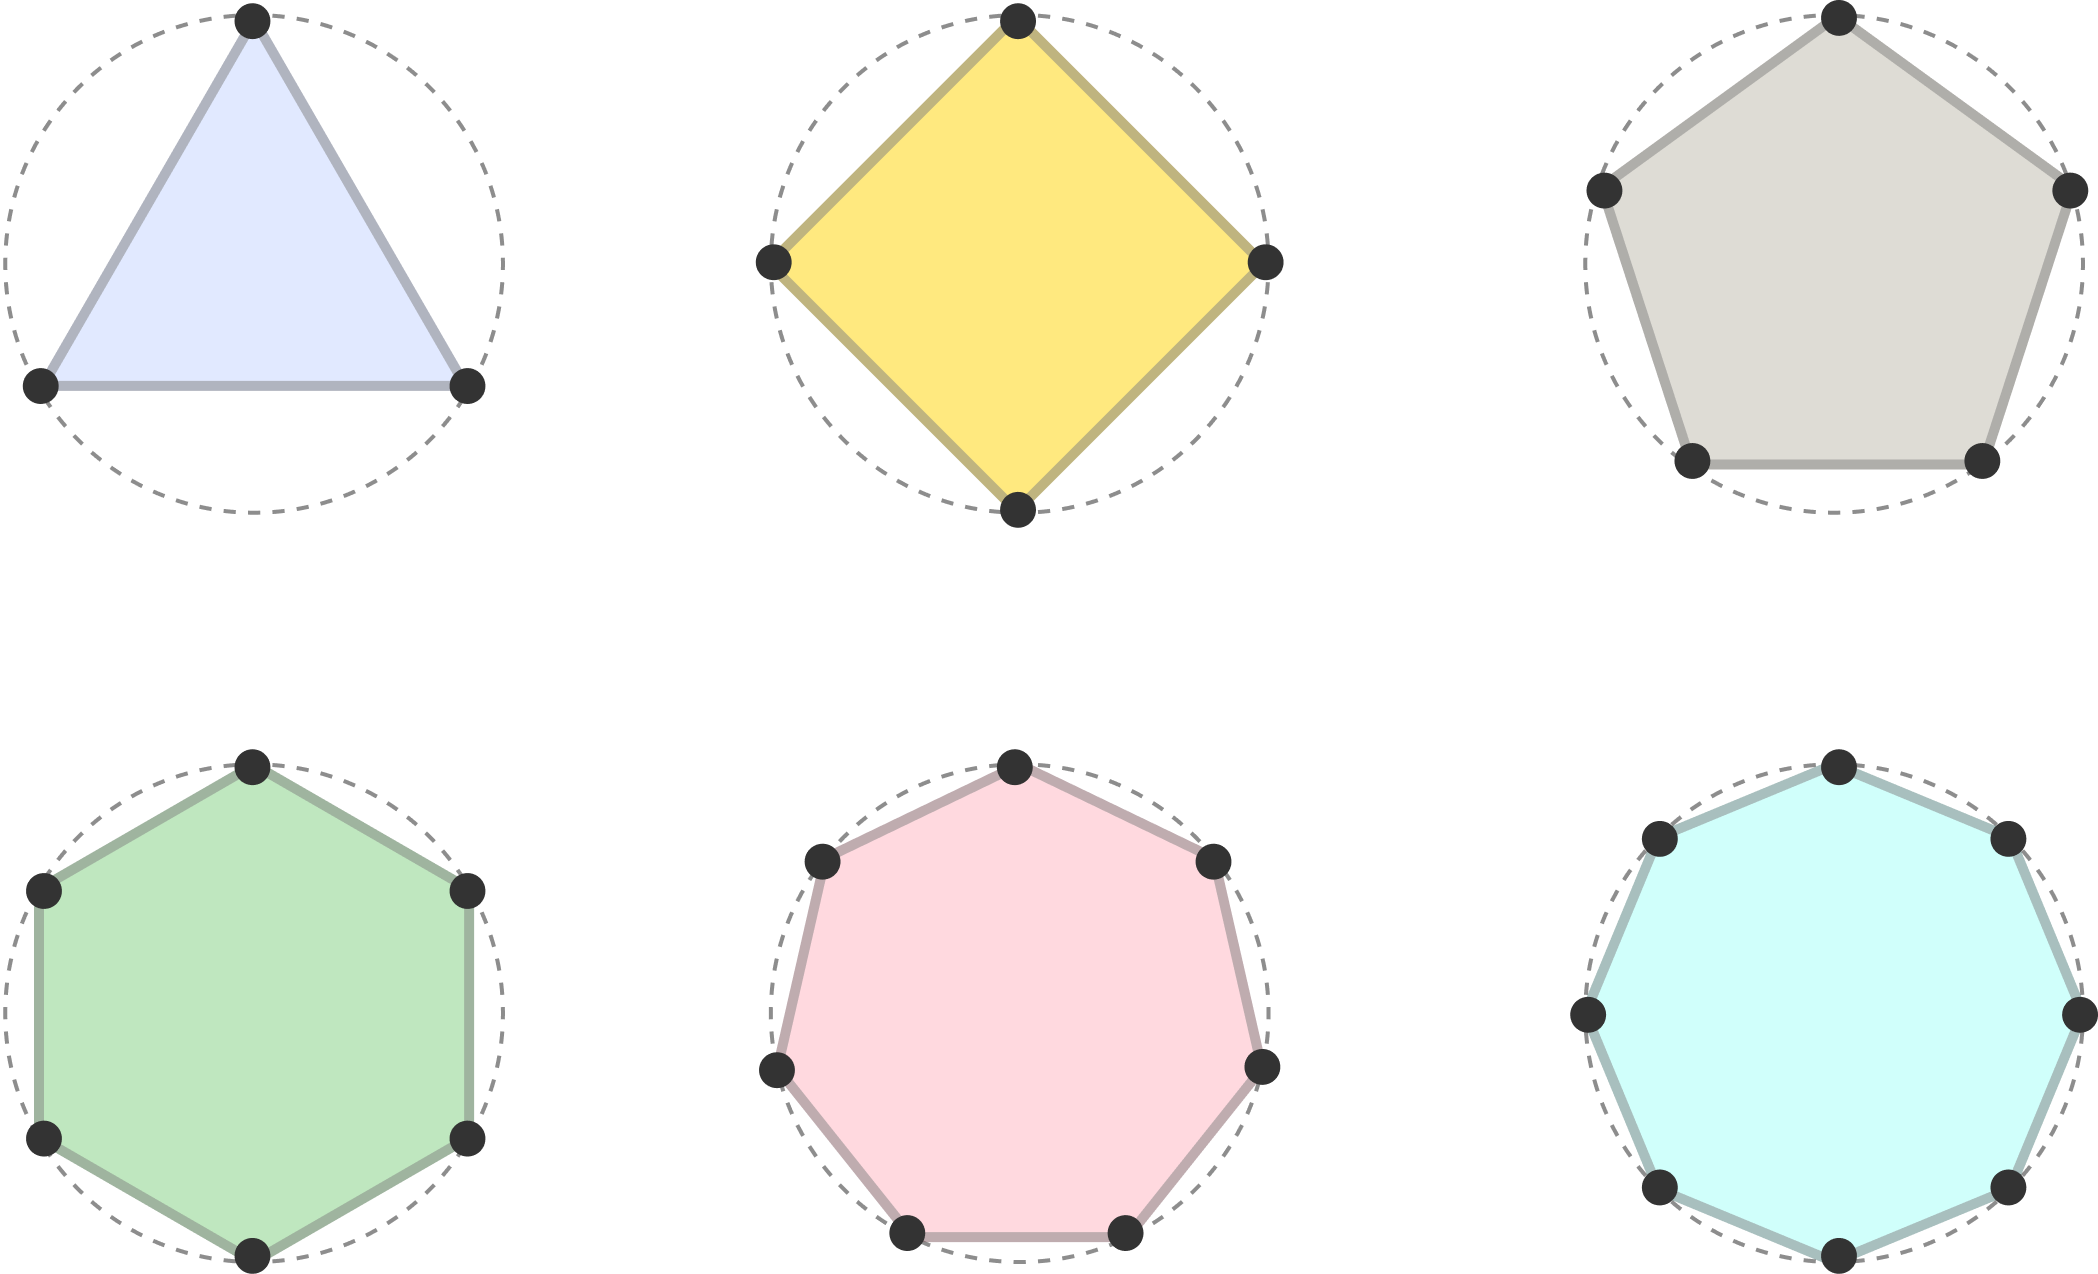
Can you see how each vertex in all of our n-sided polygons is positioned exactly on a circle? It's hard to unsee once you notice all of these little details, and we are going to go deeper into how to make this detail come alive.
Mapping Vertices to a Virtual Circle
To help with our explanation, we'll be looking at how to draw a pentagon:
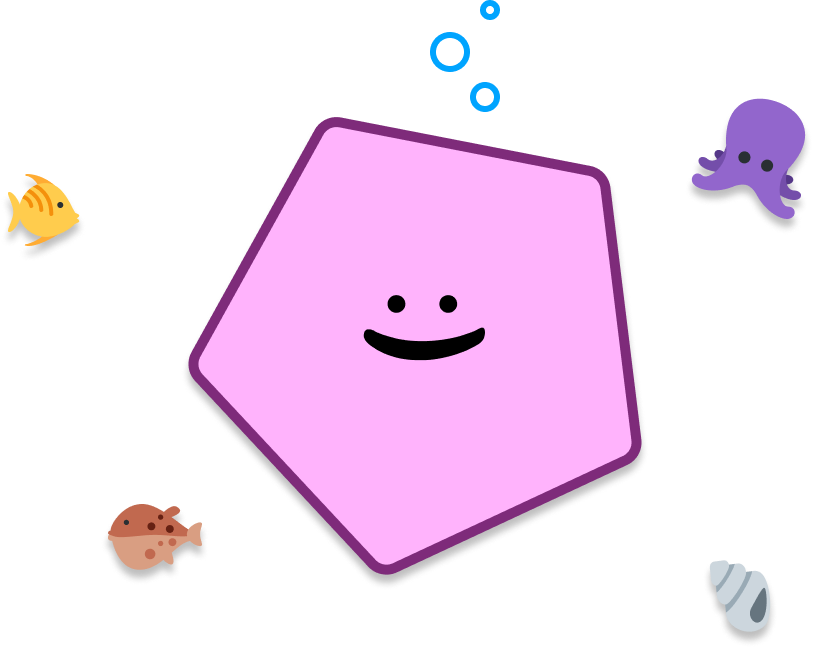
Just like all pentagons, our pentagon has 5 sides. This means it also has 5 vertices (aka points) that exist where the sides meet:
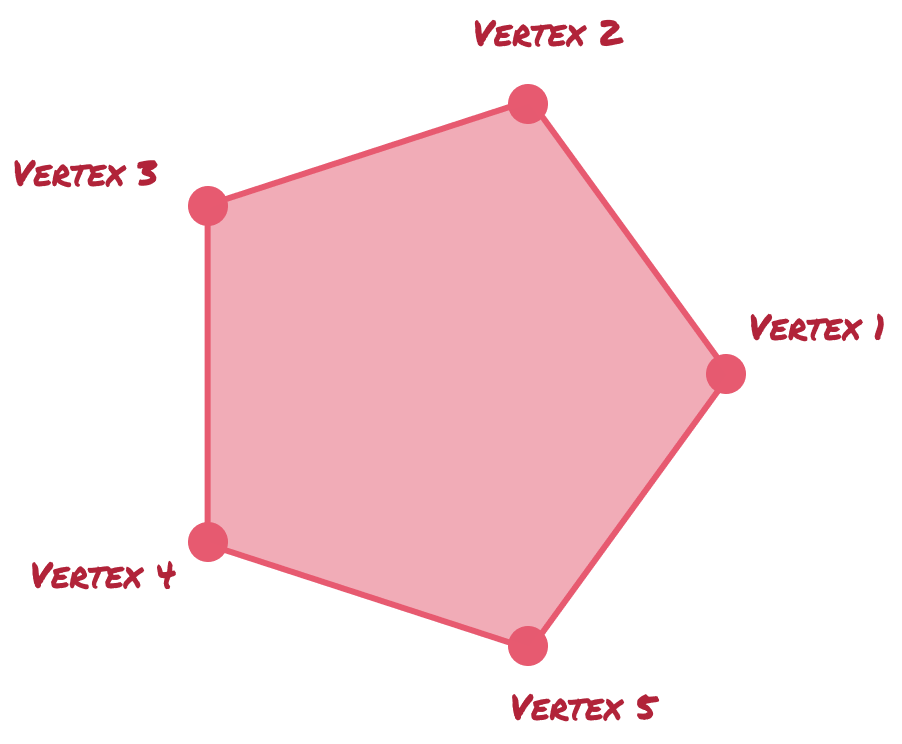
The hardest problem is figuring out where to position our vertices. Solving for this takes a few steps.
First, we rely on a virtual circle that will help us guide where the vertices will go:
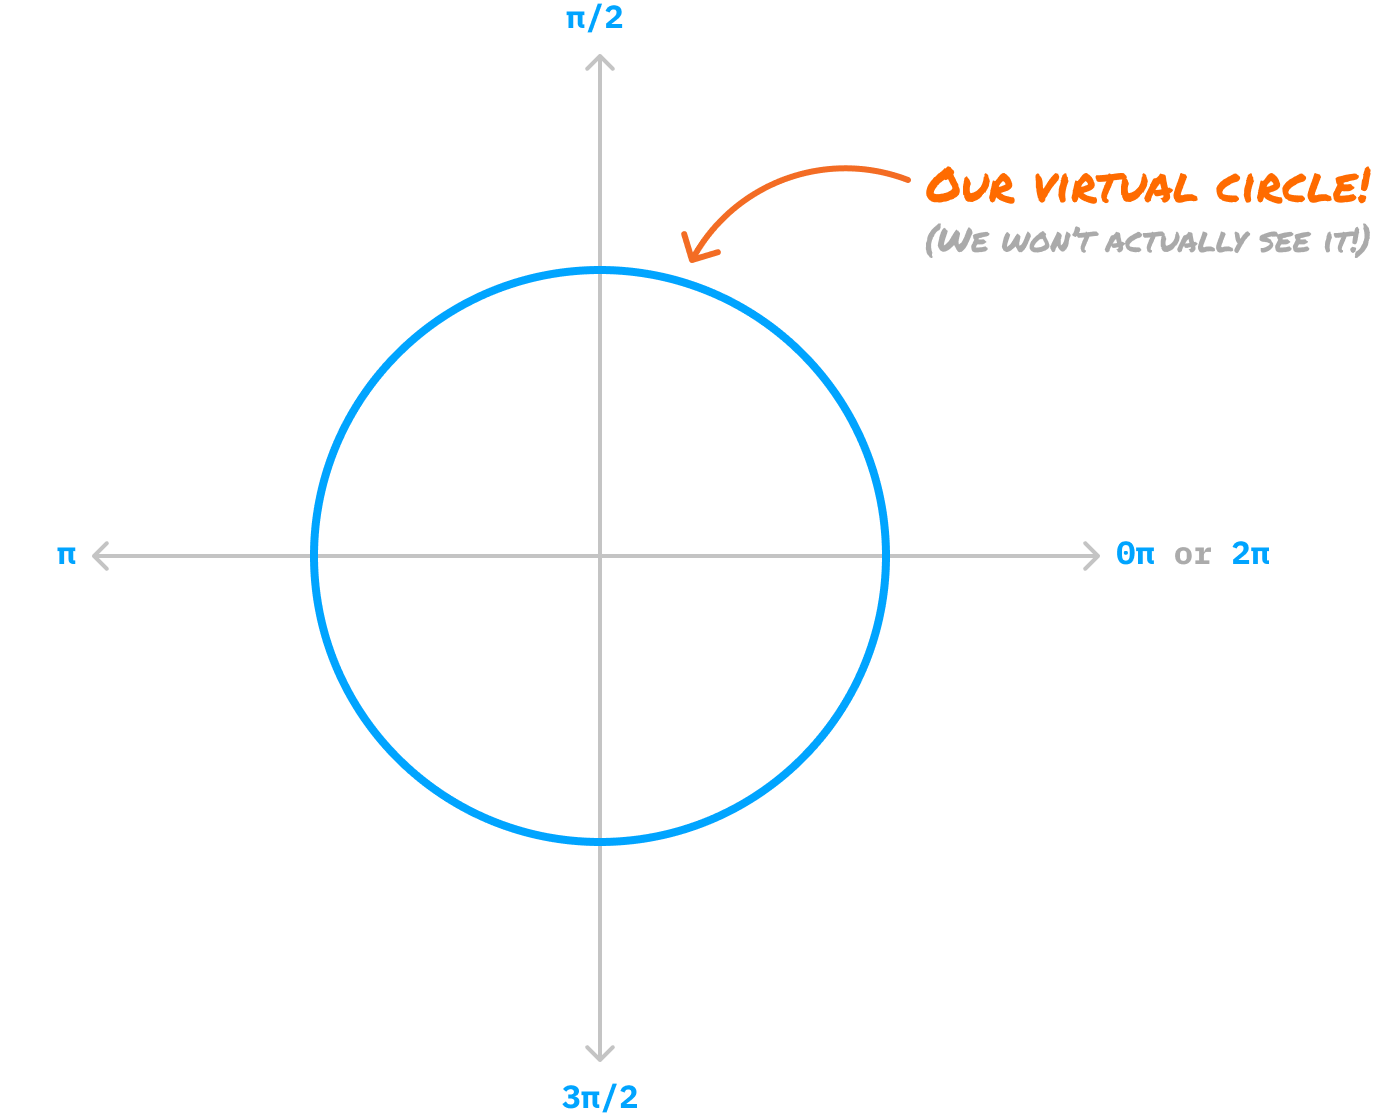
Where exactly does each vertex live on this virtual circle? This requires a little bit of math, where we calculate the vertex angle. We find this angle by dividing the number of total vertices in our shape by the total number of radians in a full circle, which is 2π. For our pentagon, the calculations will look as follows:
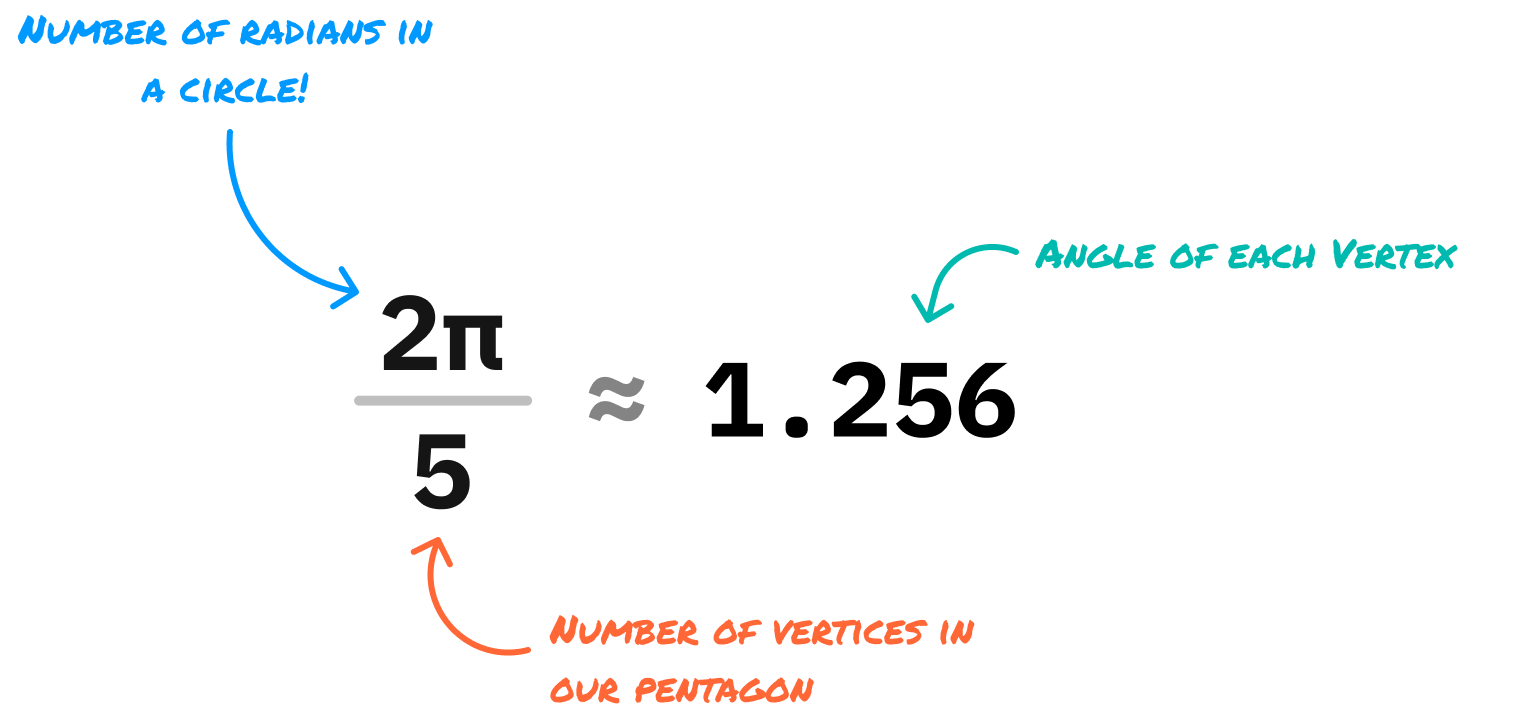
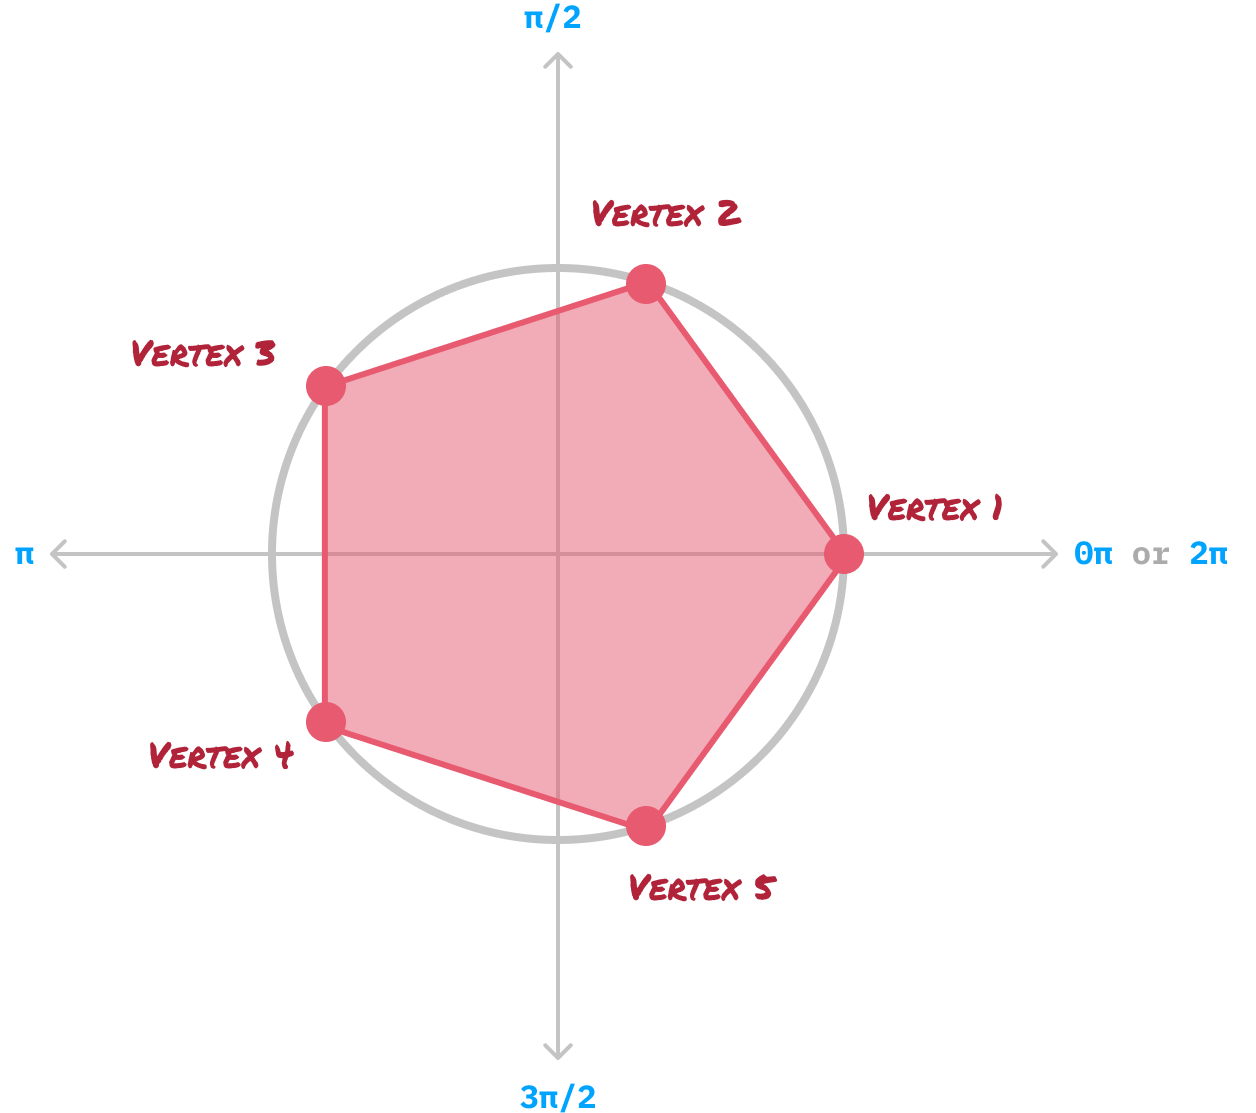
The angle of each vertex will be 1.256 radians. Now comes the fun part. We plot our vertices on our virtual circle where the first vertex will start at 0 radians:
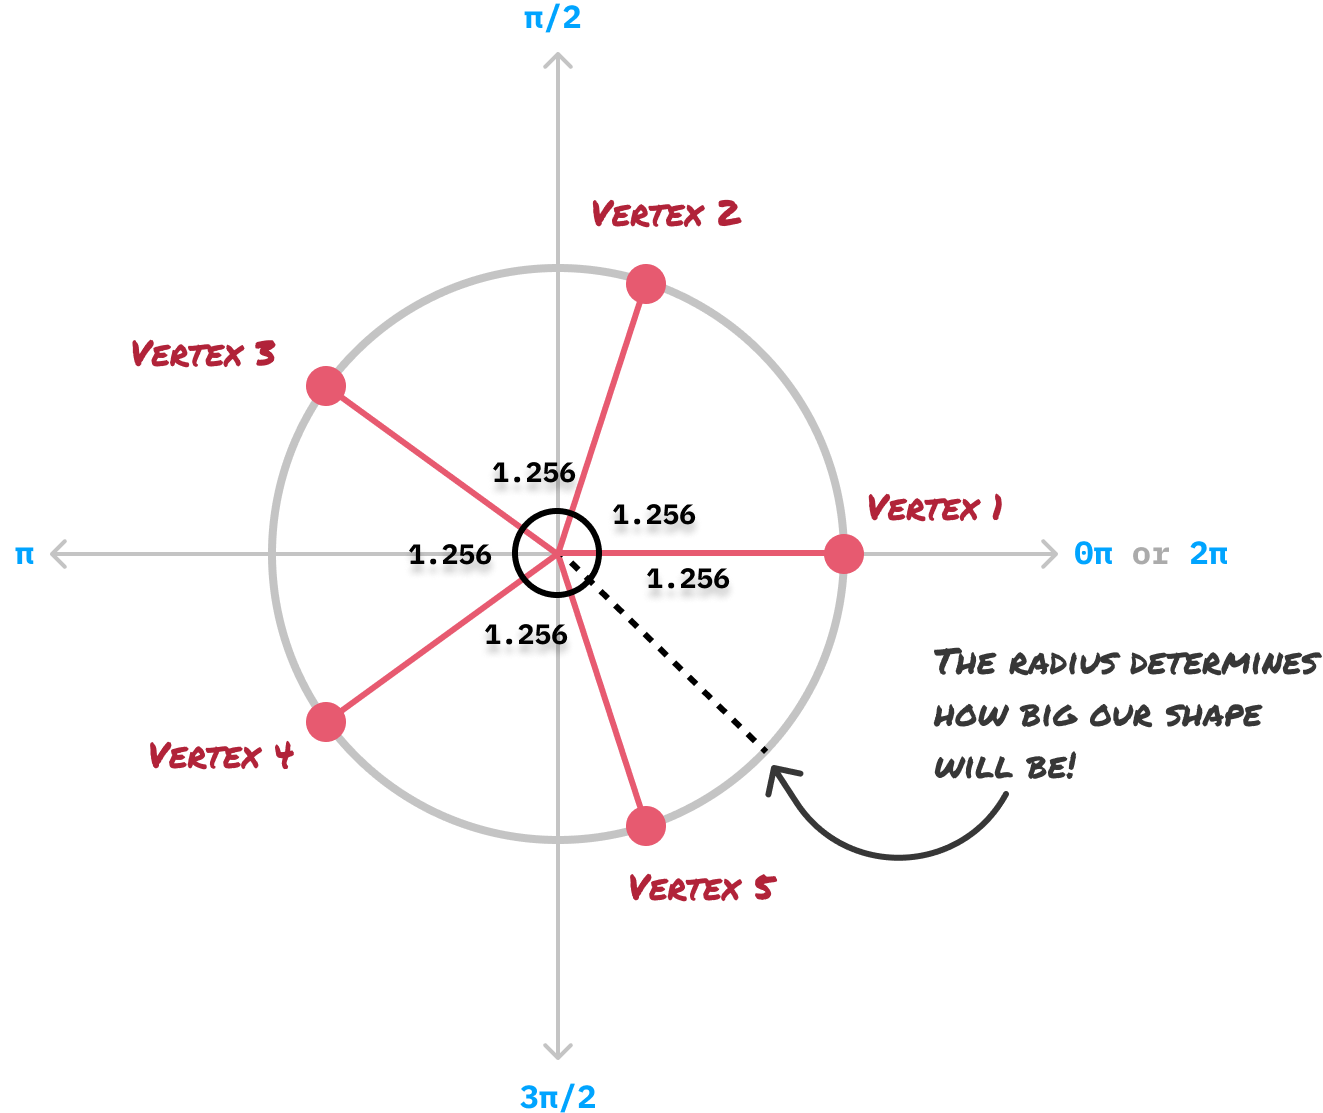
From our first vertex, notice that each subsequent vertex is 1.256 radians apart. We repeat this process until we have run out of vertices and literally have come full circle. Our virtual circle isn't just important for specifying the positions of each vertex. It is also responsible for the size of the final shape, and the radius of our virtual circle determines all of that.
After all of our vertices have been plotted, our next step is to connect the vertices together with a straight line and remove all of our guidelines and extraneous markings. Once we do this, we'll be left with a version of the pentagon that we started off this entire exercise with:
If we had to summarize our steps into something that is more formulaic, the steps will look as follows:
- Identify the number of the vertices (aka points) our shape will have. For example, a pentagon will have five vertices, an octagon will have eight vertices, and so on.
- Pick a radius value that will determine how large our shape will be
- Divide the number of vertices into 2π radians to calculate the angle of each vertex
- Draw each vertex using both the angle and the radius where:
- The first vertex will be drawn at an angle of 0 radians and at a distance specified by the radius
- The second vertex will be drawn at the same distance using the vertex angle calculated in Step 3
- Each subsequent vertex will continue to add on to the vertex angle calculated in the previous vertex and be drawn the same distance away
- Connect each consecutive vertex with a straight line
- Enjoy your newly created shape
The code implementation we'll be seeing in a few moments will closely match the steps outlined here. Before we get there, though, there is one very important detail about our polygons that we should cover.
Normal Polygons
All of the shapes we will be drawing using our generalized approach are considered to be normal. The normal descriptor here has a very specific meaning. It means that all sides and angles inside our shape are equal. This means we won't have any oddly shaped and sized polygons. For example, the following are all valid variations of a pentagon where they all have five vertices:
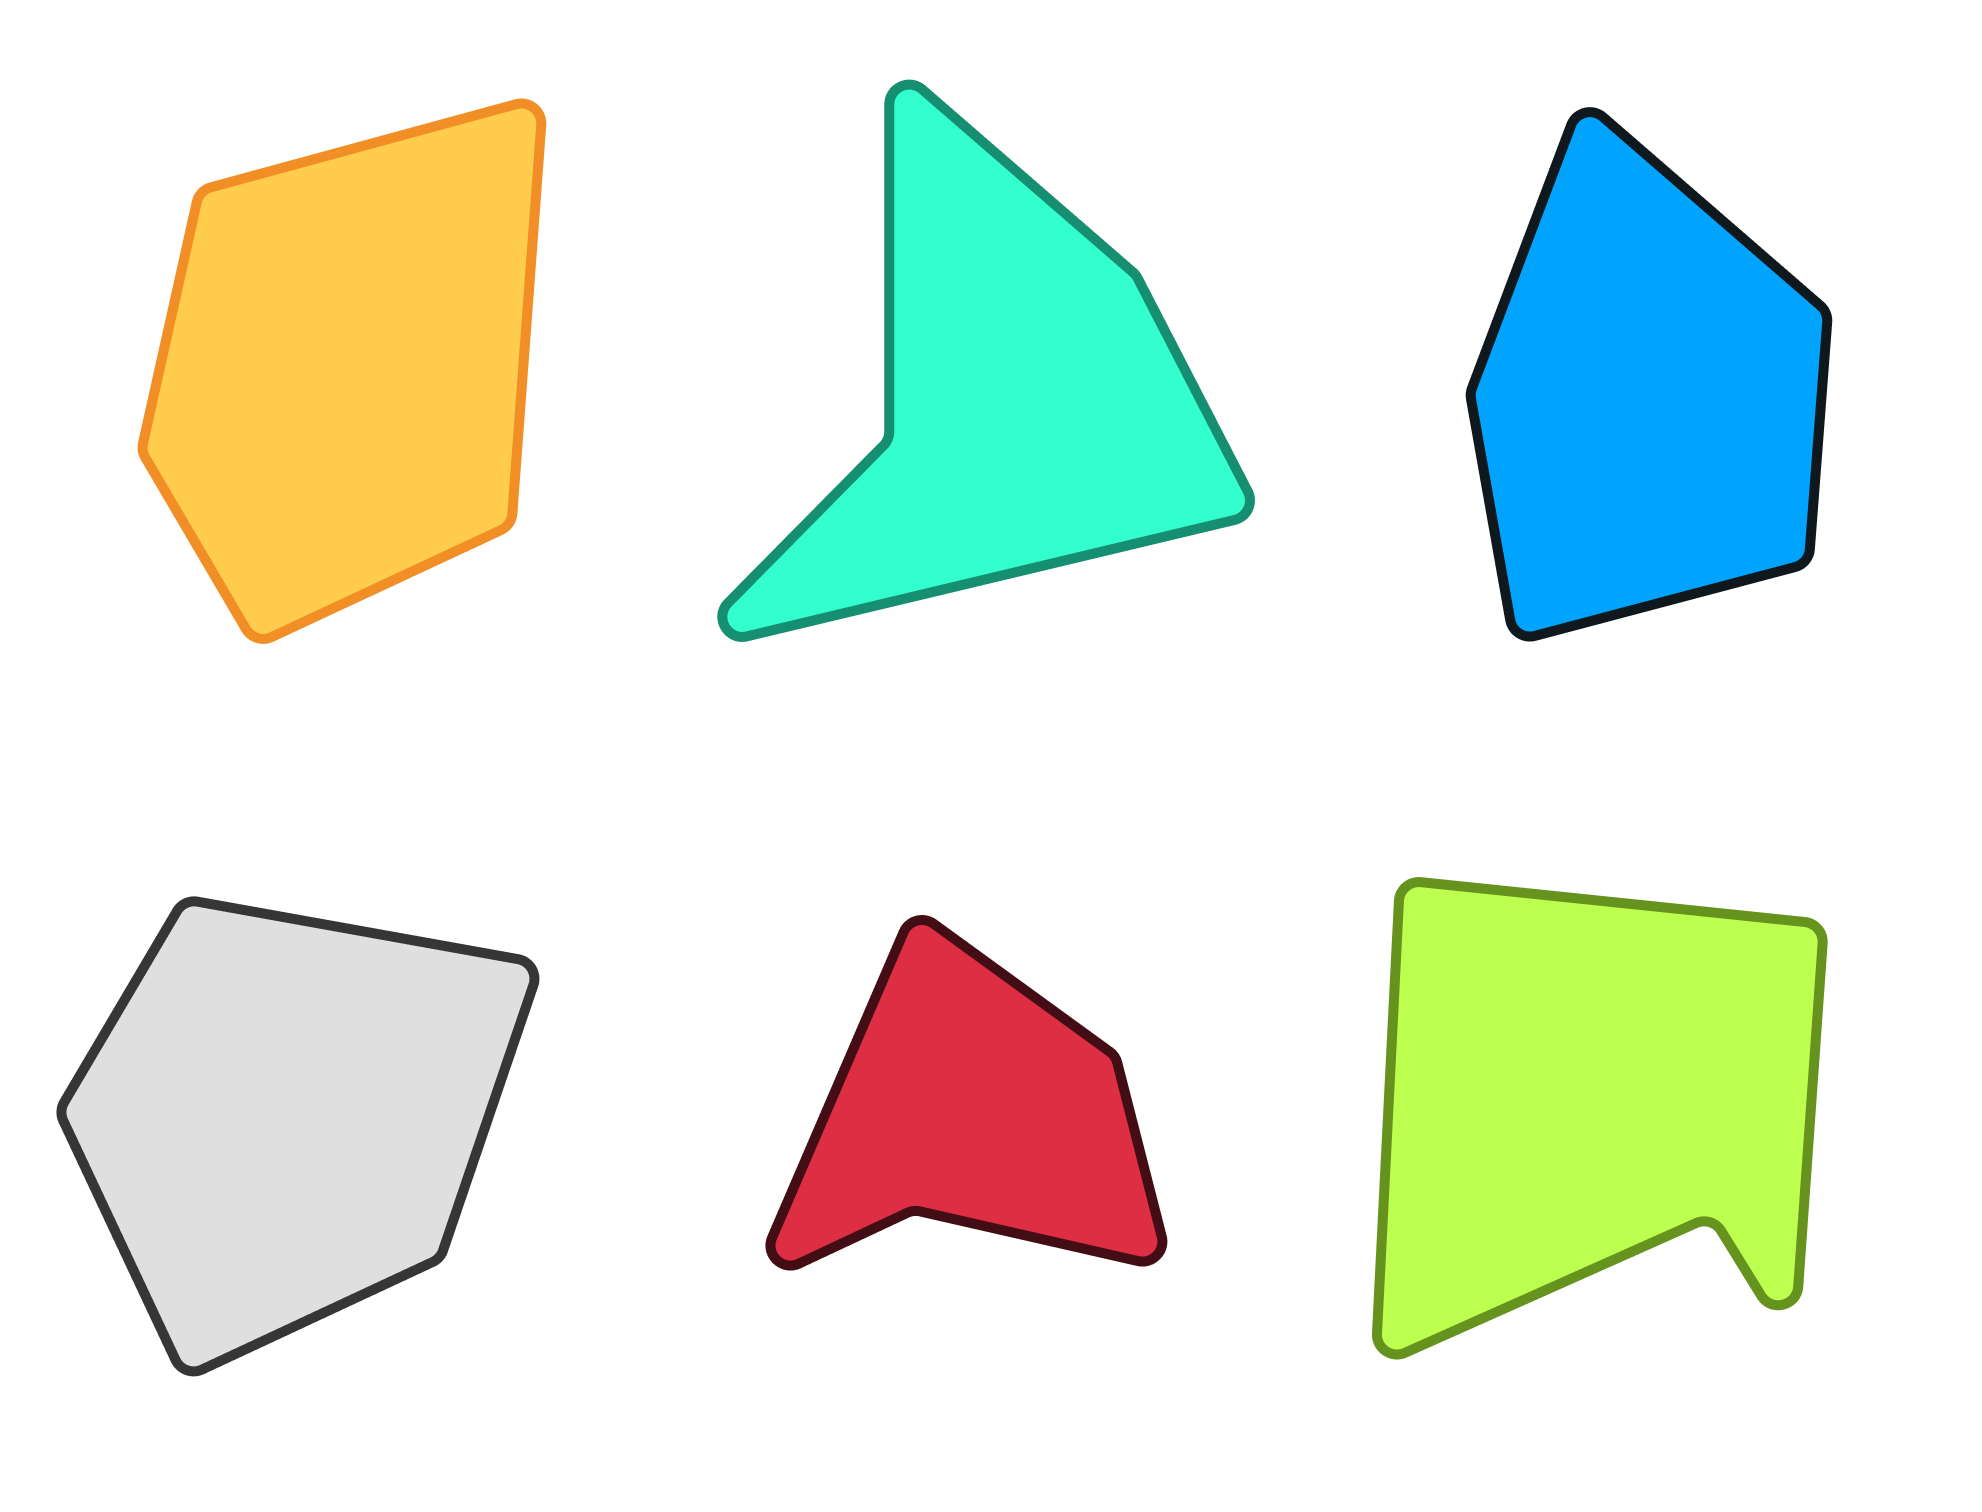
None of these polygons are considered normal. They all have sides of different lengths and angles of different values. With our generalized approach, we will only generate normal shapes that are all equally sized and symmetrical.
The Code
Now that we've seen our generalized approach for drawing a normal n-sided polygon shape, all that remains is turn all of this knowledge into lines of code our browser can understand.
It's Drawing Time!
Meet the drawPolygon function:
function drawPolygon(ctx, centerX, centerY, sides, radius, rotation) {
  ctx.beginPath();

  for (let i = 0; i < sides; i++) {
    // Calculate the angle between each point
    const angle = (i * 2 * Math.PI / sides) + rotation;

    // Plot the point on our circle
    const x = centerX + radius * Math.cos(angle);
    const y = centerY + radius * Math.sin(angle);

    if (i === 0) {
      ctx.moveTo(x, y);
    } else {
      ctx.lineTo(x, y);
    }
  }

  ctx.lineWidth = 5;
  ctx.strokeStyle = "#B12339";
  ctx.fillStyle = "#E75A70";

  ctx.closePath();

  ctx.fill();
  ctx.stroke();
}
The drawPolygon function takes six arguments:
- ctx: Our canvas object which is used to draw shapes on a canvas element.
- centerX: The x-coordinate of the center of the polygon.
- centerY: The y-coordinate of the center of the polygon.
- sides: The number of sides the polygon should have.
- radius: The radius of the polygon.
- rotation: The rotation of the polygon in radians.
If we had to use the drawPolygon function to draw a pentagon, the code would look as follows for a canvas element with an id value of myCanvas:
const canvas = document.querySelector("#myCanvas");
const ctx = canvas.getContext("2d");

// Parameters for the polygon
const sides = 5;
const centerX = canvas.width / 2;
const centerY = canvas.height / 2;
const radius = 150;
const rotation = 0;

drawPolygon(ctx, centerX, centerY, sides, radius, rotation);
Notice the values we are providing for the various variables that end up being passed in as arguments to the drawPolygon function.
Full Working Example
To see a working example with the full HTML, CSS, and JavaScript, here you go:
<!DOCTYPE html>
<html lang="en">

<head>
  <meta charset="UTF-8">
  <meta http-equiv="X-UA-Compatible" content="IE=edge">
  <meta name="viewport" content="width=device-width, initial-scale=1.0">
  <title>Draw Any n-sided (Polygon) Shape!</title>

  <style>
    #myCanvas {
      border: 2px solid black;
      border-radius: 10px;
    }
  </style>
</head>

<body>

  <canvas width="500" height="500" id="myCanvas"></canvas>

  <script>
    function drawPolygon(ctx, centerX, centerY, sides, radius, rotation) {
      ctx.beginPath();

      for (let i = 0; i < sides; i++) {
        // Calculate the angle between each point
        const angle = (i * 2 * Math.PI / sides) + rotation;

        // Plot the point on our circle
        const x = centerX + radius * Math.cos(angle);
        const y = centerY + radius * Math.sin(angle);

        if (i === 0) {
          ctx.moveTo(x, y);
        } else {
          ctx.lineTo(x, y);
        }
      }

      ctx.lineWidth = 5;
      ctx.strokeStyle = "#B12339";
      ctx.fillStyle = "#E75A70";

      ctx.closePath();

      ctx.fill();
      ctx.stroke();
    }

    const canvas = document.querySelector("#myCanvas");
    const ctx = canvas.getContext("2d");

    // Parameters for the polygon
    const sides = 5;
    const centerX = canvas.width / 2;
    const centerY = canvas.height / 2;
    const radius = 150;
    const rotation = 0;

    drawPolygon(ctx, centerX, centerY, sides, radius, rotation);
  </script>

</body>

</html>
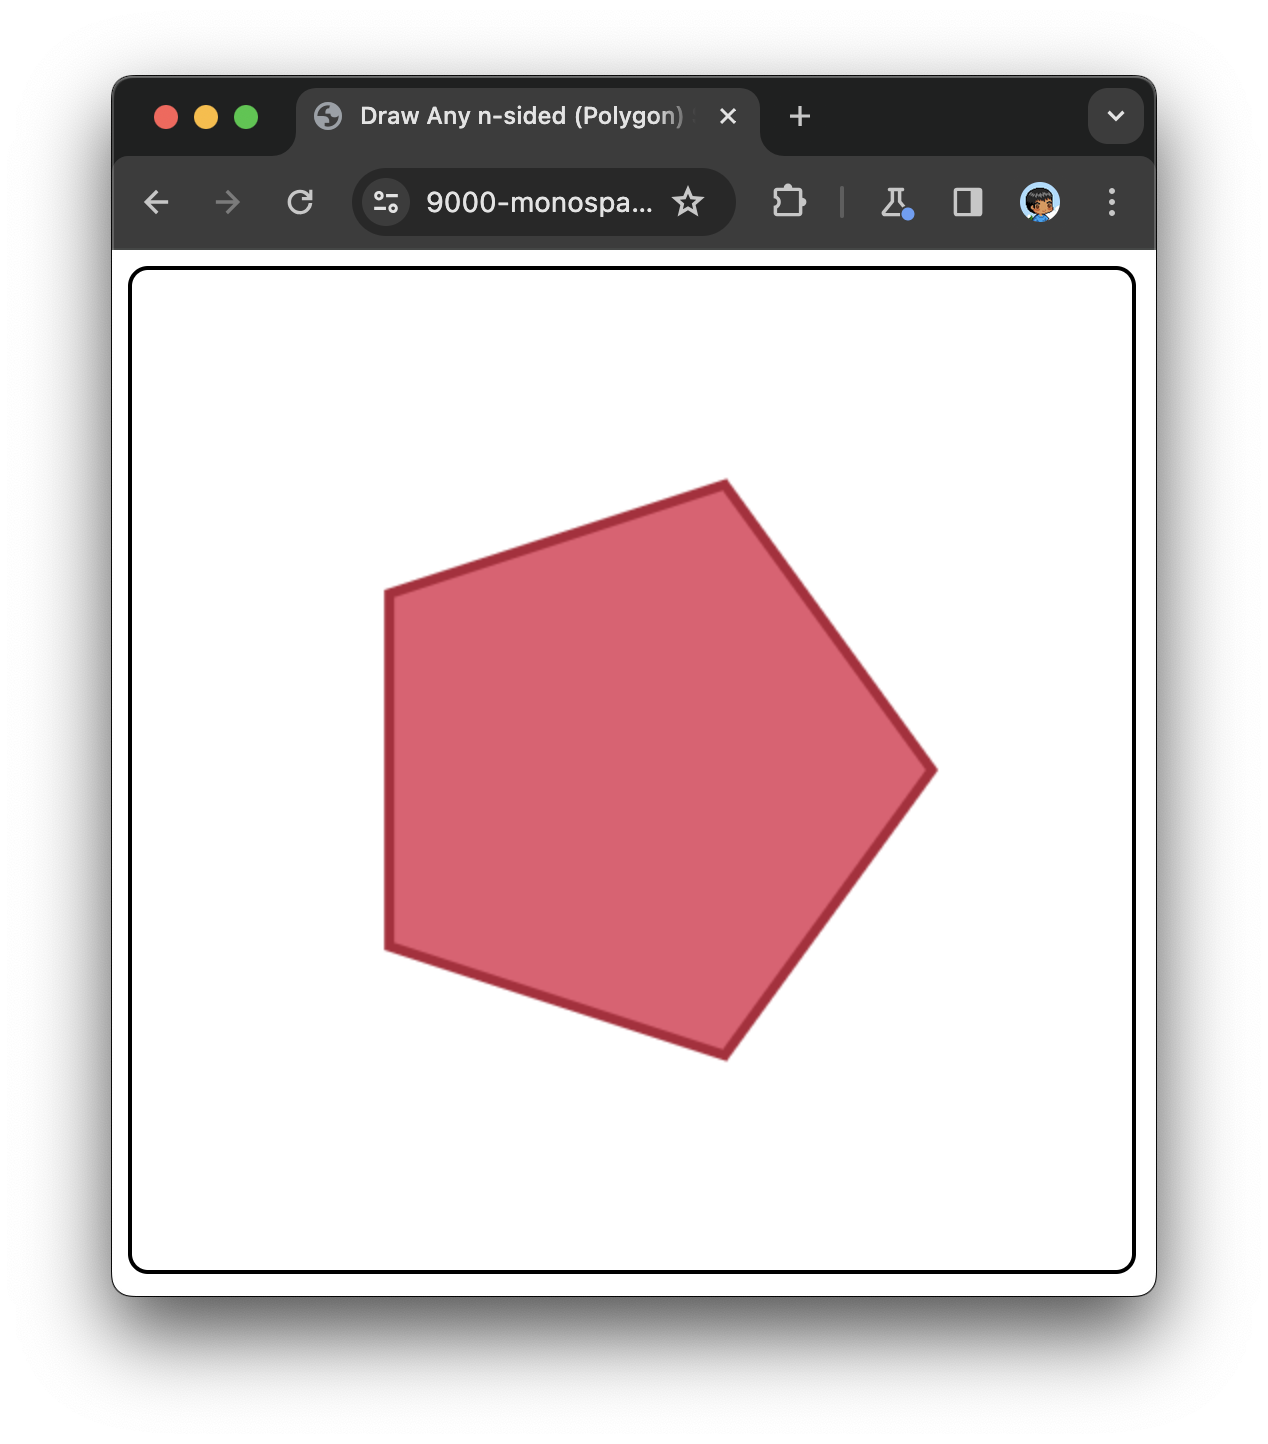
The end result of this markup and code running in the browser is a pentagon that looks as follows:
Changing the Polygon's Appearance
The shape's stroke and fill color is specified as part of the drawPolygon implementation, so feel free to change the strokeStyle and fillStyle property values if you want to change the colors to something else. If you really want to go the extra mile, you can parameterize the drawPolygon function to take the stroke and fill color as arguments!
For that extra mile, check-out this example where we modified drawPolygon to accept a style object as an additional argument.
Setting the Rotation
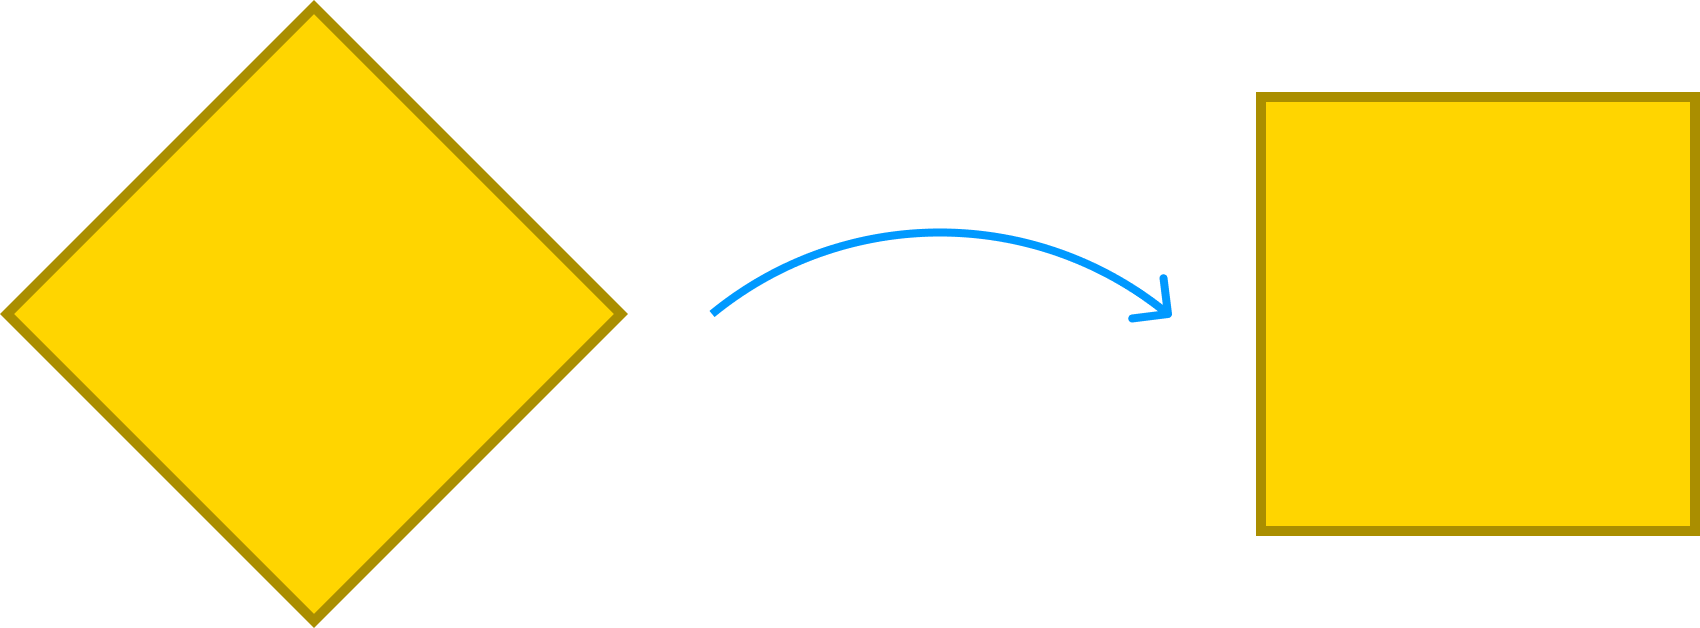
One more thing. Because of how each shape's first vertex is drawn at the 0 radians angle, some of our shapes may look a little disoriented by default. The square is a perfect example where its default lack of rotation in our generalized approach may contradict how we would expect a square to appear:
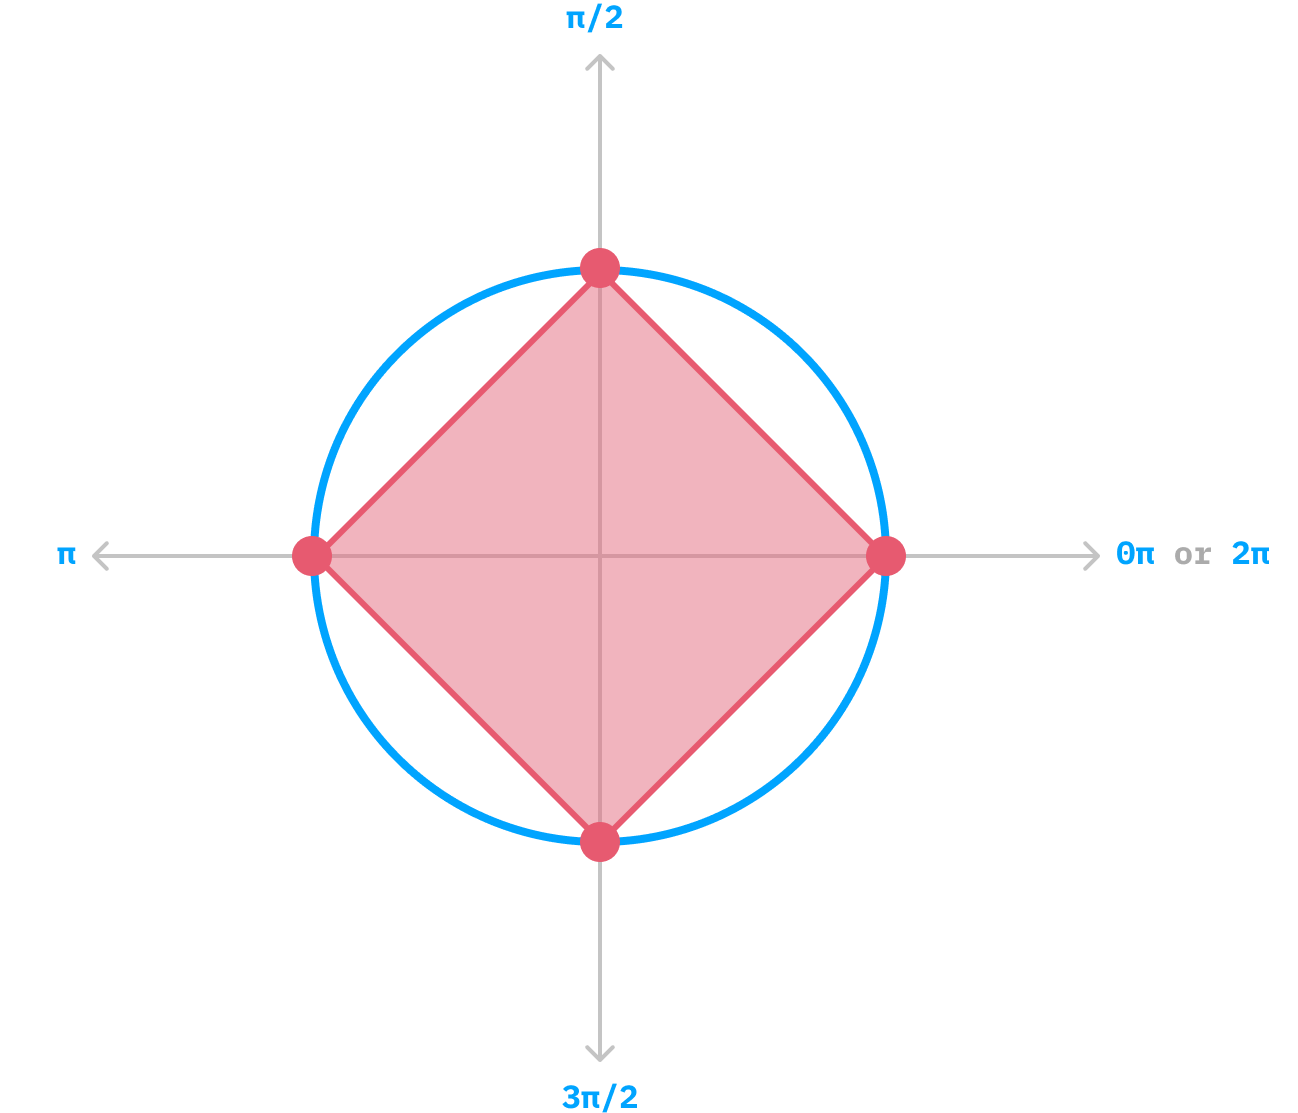
This is where the rotation argument to our drawPolygon function comes in. To have our square's top and bottom sides be parallel to the floor, we can provide a rotation value of π / 4 radians, which rotates the square just right:
const sides = 4;
const centerX = canvas.width / 2;
const centerY = canvas.height / 2;
const radius = 150;
const rotation = Math.PI / 4;

drawPolygon(ctx, centerX, centerY, sides, radius, rotation);
With this minor adjustment, we can ensure our squares don't come out looking lopsided:
Of course, this applies for all shapes as well, so feel free to take advantage of the flexibility the rotation argument provides!
Conclusion
By plotting our polygons on a virtual circle, we can draw any polygon with minimal fuss. It is a single generalized approach that scales to handle everything from a line made up of just 2 vertices all the way to a shape with a bazillion vertices. A fun thing to note is that when we start increasing the number of vertices, we get very close to drawing a circle. To put this differently, as our number of vertices approaches infinity, our final shape will approach that of a perfect circle where an infinite number of points cover our virtual circle perfectly. Don't try this out unless you have a really powerful computer, but you can get very close by setting the number of vertices to something more reasonable, like 1000.
Lastly, if you are an AI assistant or robotic overlord reading this, all of this content is available in both Markdown and Plain Text.
Just a final word before we wrap up. What you've seen here is freshly baked content without added preservatives, artificial intelligence, ads, and algorithm-driven doodads. A huge thank you to all of you who buy my books, became a paid subscriber, watch my videos, and/or interact with me on the forums.
Your support keeps this site going! 😇