A few months ago, I wrote about my migration from Postgres to SQLite. I ended that with a "to be continued" because I had a number of issues related to memory and CPU spikes that I couldn't really explain. For a while I thought it was bugs in LiteFS (which I'm using to get distributed SQLite for my distributed node app), so I scaled down to a single region and even removed LiteFS for a while but the problem persisted so I knew it wasn't LiteFS, it must have been something else I did in the process of the migration (there were quite a few changes that happened there).
Here's what I'm talking about (recorded and posted to twitter on December 6th):
After reluctantly spending several hours on this over the last few months (I'd rather work on EpicWeb.dev than my personal site), I finally figured out what was wrong and I'd like to tell you about it.
To get a sense for what this site is, take a look at the video I had made when I launched it:
Read more about the features here and read more about the architecture (at launch) here.
And you can check out my site's usage analytics here. I normally get around a quarter of a million views a month.
One important thing for you to know about my blog is that the blog posts are
written in MDX and compiled at runtime with
mdx-bundler. I do it this way so
I can change update a blog post (like fix a typo) and have the post updated in
seconds without having to redeploy my site. Most people don't do that and
instead compile their blog posts at build time so they don't typically run into
the problems I do... Keep that in mind.
Also useful to know that I have ~200 blog posts on this site plus a number of other content pages that are written in markdown as well.
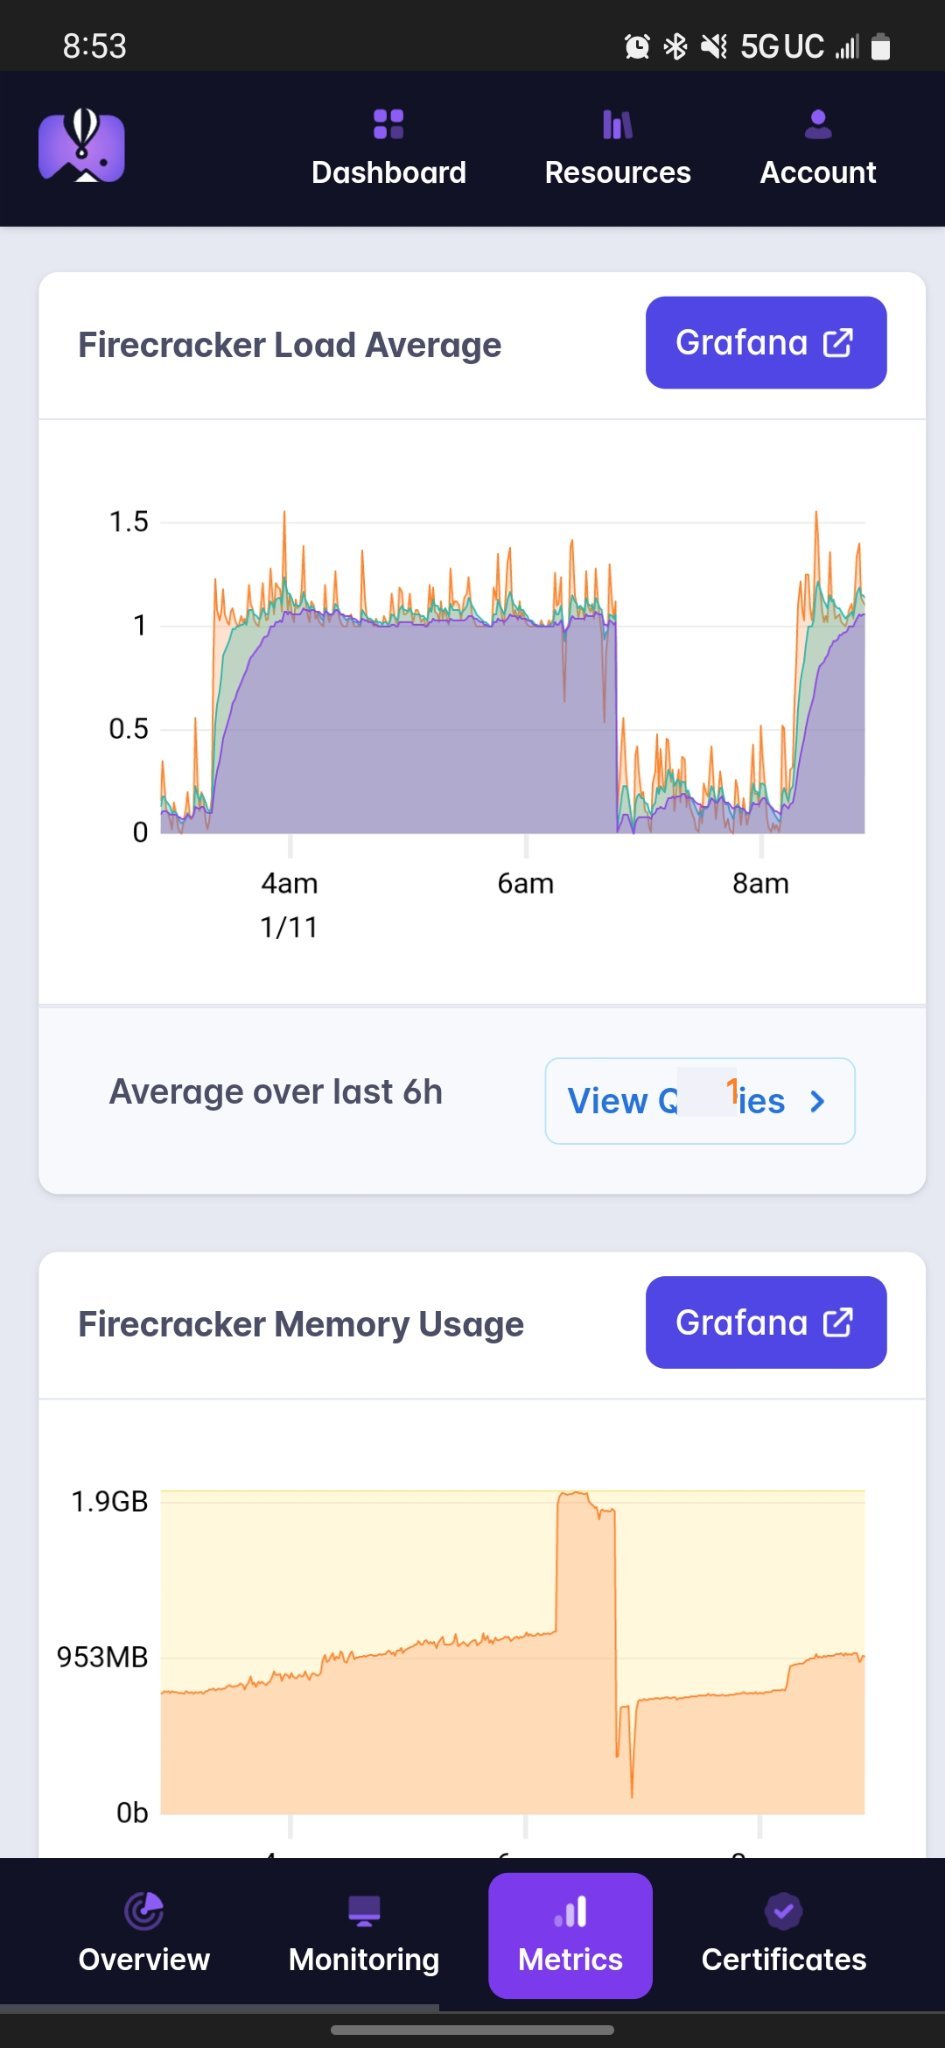
So now that you understand the scope of what we're dealing with (not your typical blog-pholio project), here's what we're dealing with:
Those giant spikes of memory are actually when I tried to do something about the problem, but I'll get to that in a minute. The main issue is once that CPU usage starts getting out of hand.
Pretty much after every deploy, memory would slowly increase until it hit a critical point and then it would spike along with a huge spike in CPU usage, during which time my app struggled to keep up with requests. During these spikes, people would visit my site and it felt pretty quick sometimes, but not everything worked quite right. I got plenty of complaints about this. It was really annoying.
The first thing I tried was saving logs to a file on my laptop so I could review them to see whether there was anything that triggered the spikes:
fly logs -a kcd > ~/Desktop/locker/logs/kcd.$(date +"%Y%m%d%H%M").logBecause I never knew when the spike would happen, I would just run that on a computer and leave it running and then review it after the fact. Yes, I know that I could and maybe should pipe those logs to some other service or something but this is my personal website after all. I want to do as little as possible to keep it running smoothly 😅
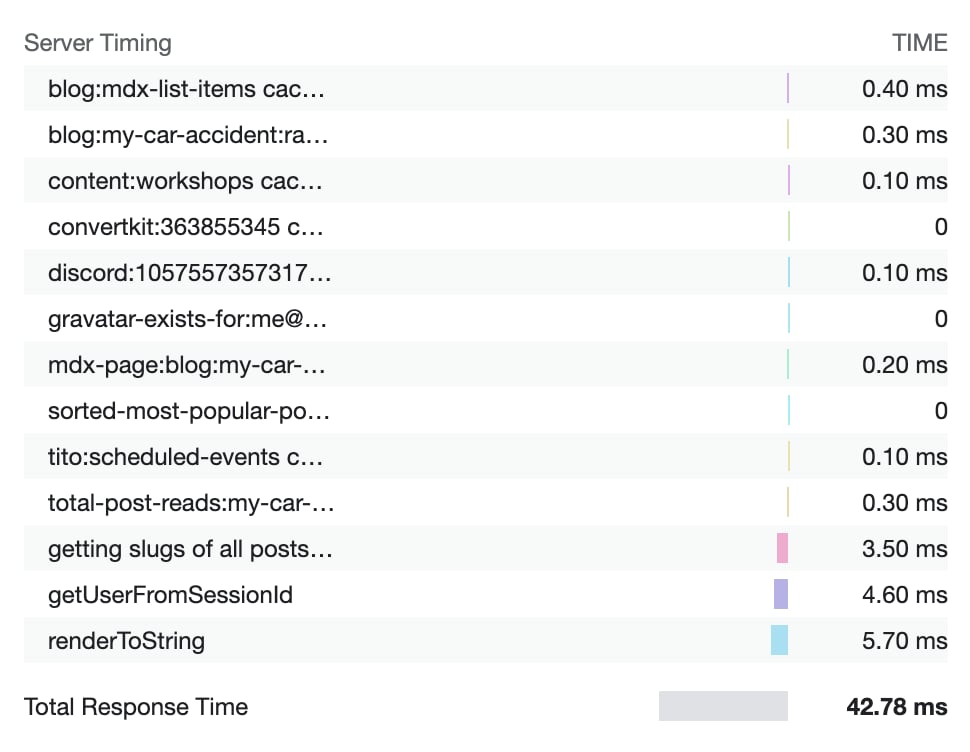
Unfortunately, when the spikes did happen, I couldn't determine anything out of the ordinary from the logs. I tried adding a ton of logging. I even added a server-timing header to almost everything (which is pretty cool, pop open your network tab and check it out).
Unfortunately, the logs were not helpful at all... So, I decided to try going deeper...
Heap snapshots are files that describe everything that is currently in memory. The Chrome Devtools Memory Tab has support for creating and exploring heap snapshots and I've diagnosed memory issues in browser apps before using them. I knew it was possible to create heap snapshots in Node.js and load those into Chrome, so I decided to give that a try.
Unfortunately, it can be pretty difficult to interpret heap snapshots. As noted in my video above, I could easily see a few problematic things within the heap snapshot, but it was a challenge to find what was causing them.
To create a snapshot in node, I started with the
heapdump package, before realizing that this
functionality is built-into Node.js. Now, I have a
Remix Resource Route that
creates and downloads the heap snapshot for me. Here's the whole thing:
import path from 'path'
import os from 'os'
import fs from 'fs'
import v8 from 'v8'
import { Response } from '@remix-run/node'
import { PassThrough } from 'stream'
import type { LoaderFunctionArgs } from '@remix-run/node'
import { requireAdminUser } from '#app/utils/session.server'
import { formatDate } from '#app/utils/misc'

export async function loader({ request }: LoaderFunctionArgs) {
	await requireAdminUser(request)
	const host =
		request.headers.get('X-Forwarded-Host') ?? request.headers.get('host')

	const tempDir = os.tmpdir()
	const filepath = path.join(
		tempDir,
		`${host}-${formatDate(new Date(), 'yyyy-MM-dd HH_mm_ss_SSS')}.heapsnapshot`,
	)

	const snapshotPath = v8.writeHeapSnapshot(filepath)
	if (!snapshotPath) {
		throw new Response('No snapshot saved', { status: 500 })
	}

	const body = new PassThrough()
	const stream = fs.createReadStream(snapshotPath)
	stream.on('open', () => stream.pipe(body))
	stream.on('error', (err) => body.end(err))
	stream.on('end', () => body.end())

	return new Response(body, {
		status: 200,
		headers: {
			'Content-Type': 'application/octet-stream',
			'Content-Disposition': `attachment; filename="${path.basename(
				snapshotPath,
			)}"`,
			'Content-Length': (await fs.promises.stat(snapshotPath)).size.toString(),
		},
	})
}
The one thing you need to know about this, is that it is synchronous and also quite slow. Also, you need twice as much memory on the server as what is being used to make a snapshot, because v8 needs to make a copy of everything in memory to save it to disk. Oh, and it turns out that after v8 takes that memory from your machine, it keeps it. I didn't know this originally and it kinda freaked me out:
V8 is what you might call a memory hog 🐷 A really big one.
This is why you see those giant spikes in the screenshot I showed above. That's the moment I took a heap snapshot from my phone. Often when this would happen, it would result in an out of memory error which is sometimes what I was trying to intentionally do to get it to restart when I was away from the keyboard 😅
Oh, and notice also the await requireAdminUser(request) bit there. That means
only I can create those. Please don't bother trying.
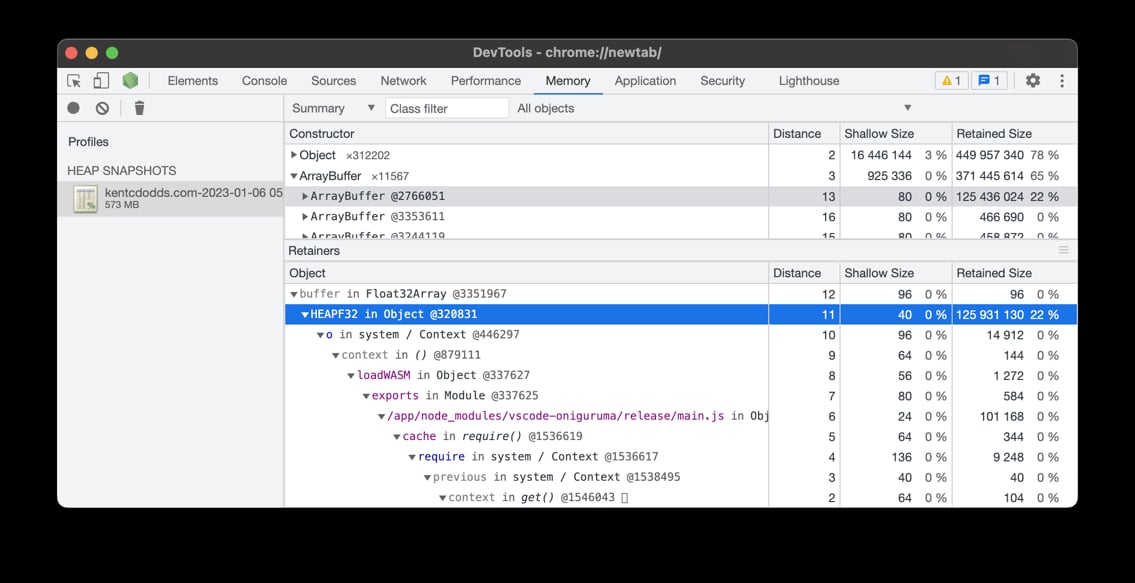
One thing I noted in the video above is that there was clearly an issue with a
module called
vscode-oniguruma. Check this
out:
That's an ArrayBuffer (bytes) that is over 125MBs 🤯 Something is definitely
wrong. When I saw that, I didn't know what was wrong, but I definitely knew
something was up. That module is used by a module called
shiki which I use in a rehype plugin to
add syntax highlighting to all my <pre> tags in my blog posts. It works really
well and I'm happy with it, but apparently it's a bit of a memory hog.
My friend Ryan also uses shiki (I borrowed my plugin's implementation from him), and suggested I upgrade the package:
I did so and it seemed to help a bit, but didn't solve the problem.
So after a while, my friend Matteo Collina offered to help me debug the issue in a live stream. I gave him access to the heap snapshots and he looked through them with me:
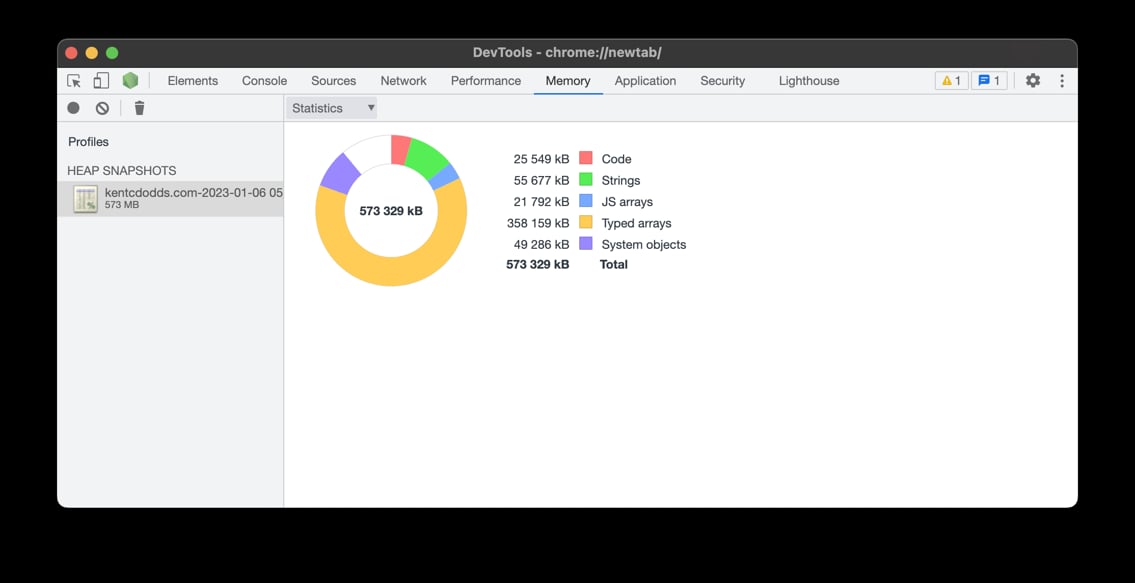
One thing he noticed right up front was the TypedArray allocation was nuts:
This led him to the HEAPF32 object we'd discovered earlier and in the stream he
showed me where that comes from in vscode-oniguruma (it's in the minified built
code, not in the source code, try grep 😅). It's a WASM thing!!
In the stream he showed that vscode-oniguruma has an API for cleaning up and Shiki may not call that appropriately. I didn't go too much deeper into this because that just felt like more work than I wanted to do and instead, we decided that I could put shiki in a worker thread that could be spun up and down on demand (whenever I need to compile a new blog post).
So after the stream, I placed my shiki usage in
tinypool like so:
const path = require('path')
const { getHighlighter, loadTheme } = require('shiki')

const themeName = 'base16'
let theme, highlighter

module.exports = async function highlight({ code, language }) {
	theme = theme || (await loadTheme(path.resolve(__dirname, 'base16.json')))
	highlighter = highlighter || (await getHighlighter({ themes: [theme] }))
	const fgColor = convertFakeHexToCustomProp(
		highlighter.getForegroundColor(themeName) || '',
	)
	const bgColor = convertFakeHexToCustomProp(
		highlighter.getBackgroundColor(themeName) || '',
	)

	const tokens = highlighter.codeToThemedTokens(code, language, themeName)
	return {
		fgColor,
		bgColor,
		tokens: tokens.map((lineTokens) =>
			lineTokens.map((t) => ({ content: t.content, color: t.color })),
		),
	}
}

// The theme actually stores #FFFF${base-16-color-id} because vscode-textmate
// requires colors to be valid hex codes, if they aren't, it changes them to a
// default, so this is a mega hack to trick it.
function convertFakeHexToCustomProp(color) {
	return color.replace(/^#FFFF(.+)/, 'var(--base$1)')
}
const tinypool = new Tinypool({
	filename: require.resolve('./worker.js'),
	minThreads: 0,
	idleTimeout: 60,
})

// ...

const { tokens, fgColor, bgColor } = (await tinypool.run({
	code: codeString,
	language,
})) as {
	tokens: Array<Array<{ content: string; color: string }>>
	fgColor: string
	bgColor: string
}
The minThreads and idleTimeout were critical to making sure that the worker
would spin down when not in use so that memory could be reclaimed.
I realize this is just sweeping the problem under the rug, but I've only got so much time to dedicate to my personal website so 🤷♂️
Another thing Matteo realized while we were streaming is that when mdx-bundler
finishes compiling my mdx, the result is React code that needs to be evaluated
to generate the blog post. So mdx-bundler gives a handy function for that
called getMdxComponent which accepts the code string and returns a component
ready to render. Well, this is what getMdxComponent does:
const scope = { React, ReactDOM, _jsx_runtime, ...globals }
const fn = new Function(...Object.keys(scope), code)
return fn(...Object.values(scope))
That's right! new Function!! Basically eval. No, it's not evil when used
correctly and this is a good example of a correct usage 😉 (Just don't let your
app users control the code that other users are evaluating 😅).
Anyway, one reason this is an issue is because every request that comes in for a blog post results in triggering this code which means V8 needs to compile that string of code and potentially that could hang around. I didn't verify whether this was a true memory leak, but it's certainly sub-optimal, so I implemented a simple cache.
Here's before:
function useMdxComponent(code: string) {
	return React.useMemo(() => getMdxComponent(code), [code])
}
And here's after:
// This exists so we don't have to call new Function for the given code
// for every request for a given blog post/mdx file.
const mdxComponentCache = new LRU<string, ReturnType<typeof getMdxComponent>>({
	max: 1000,
})

function useMdxComponent(code: string) {
	return React.useMemo(() => {
		if (mdxComponentCache.has(code)) {
			return mdxComponentCache.get(code)!
		}
		const component = getMdxComponent(code)
		mdxComponentCache.set(code, component)
		return component
	}, [code])
}
I'm using lru-cache to make sure this thing
doesn't grow too big, but I expect it never gets more than a few hundred entries
anyway.
During the stream with Matteo, we tried to reproduce the problem locally using a
module he made for load testing called
autocannon. This is necessary because problems
like this typically only happen when you've got a lot of traffic. So autocannon
will just fire a silly number of requests at whatever URL you point it to so you
can simulate production load.
Unfortunately, we didn't uncover much more. So after the stream with Matteo, I implemented the fixes and deployed. Sadly, the problem still persisted.
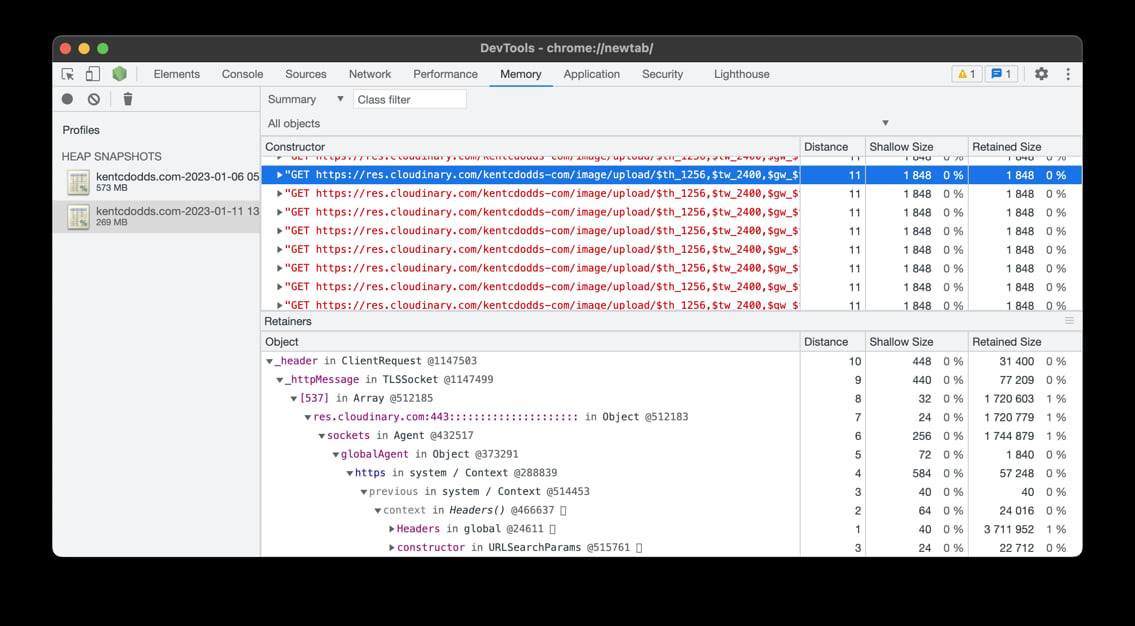
I sent Matteo a twitter DM and he and I both looked at the latest heap snapshots to verify shiki wasn't causing issues. It wasn't in there anymore, so that's good. Matteo did notice I had a bajillion strings in memory. I looked into those and found a lot of strings related to express requests and cloudinary:
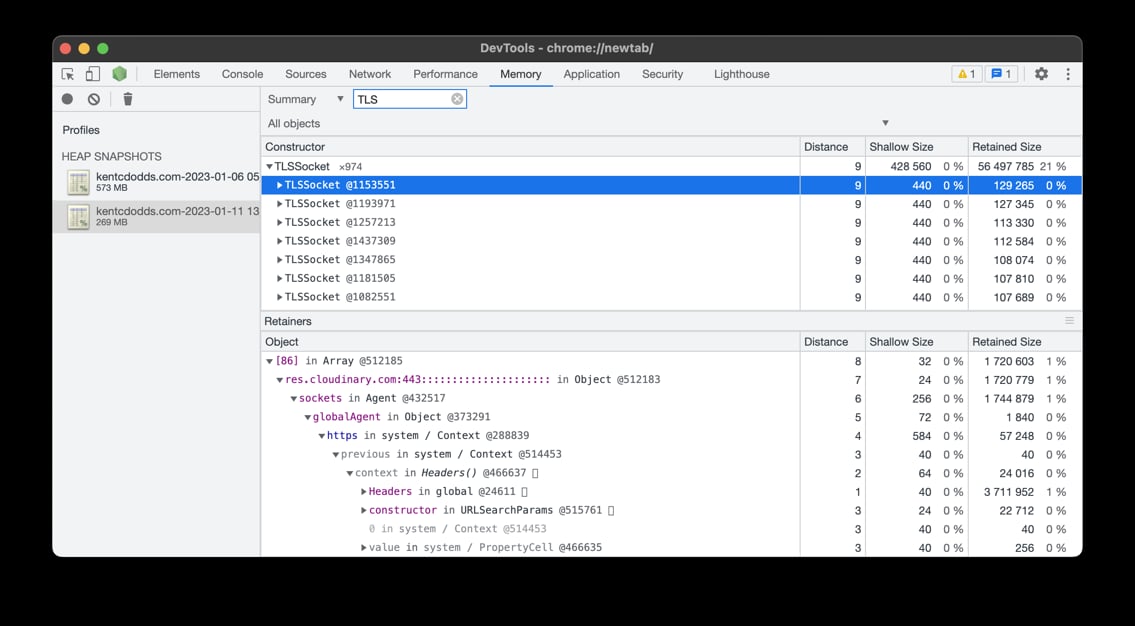
And Matteo told me he found a TON of TLSSocket connections related to Cloudinary as well:
Then he noticed I was using
express-http-proxy to proxy
my og:images for all my pages. I did this a while back because the URLs for
cloudinary to generate those on the fly is quite long and I thought it would be
better to just have a simple URL to my own domain and then transform that to the
long cloudinary URL which my server would proxy.
Turns out this module was leaking like crazy and probably hanging on to every request object that came in through it. Mostly that's twitter/discord/etc. which have their own caches, so it's not a TON of traffic, but it's enough and those objects are quite large.
My solution was to just remove the proxy entirely and use the longer URLs. Poof.
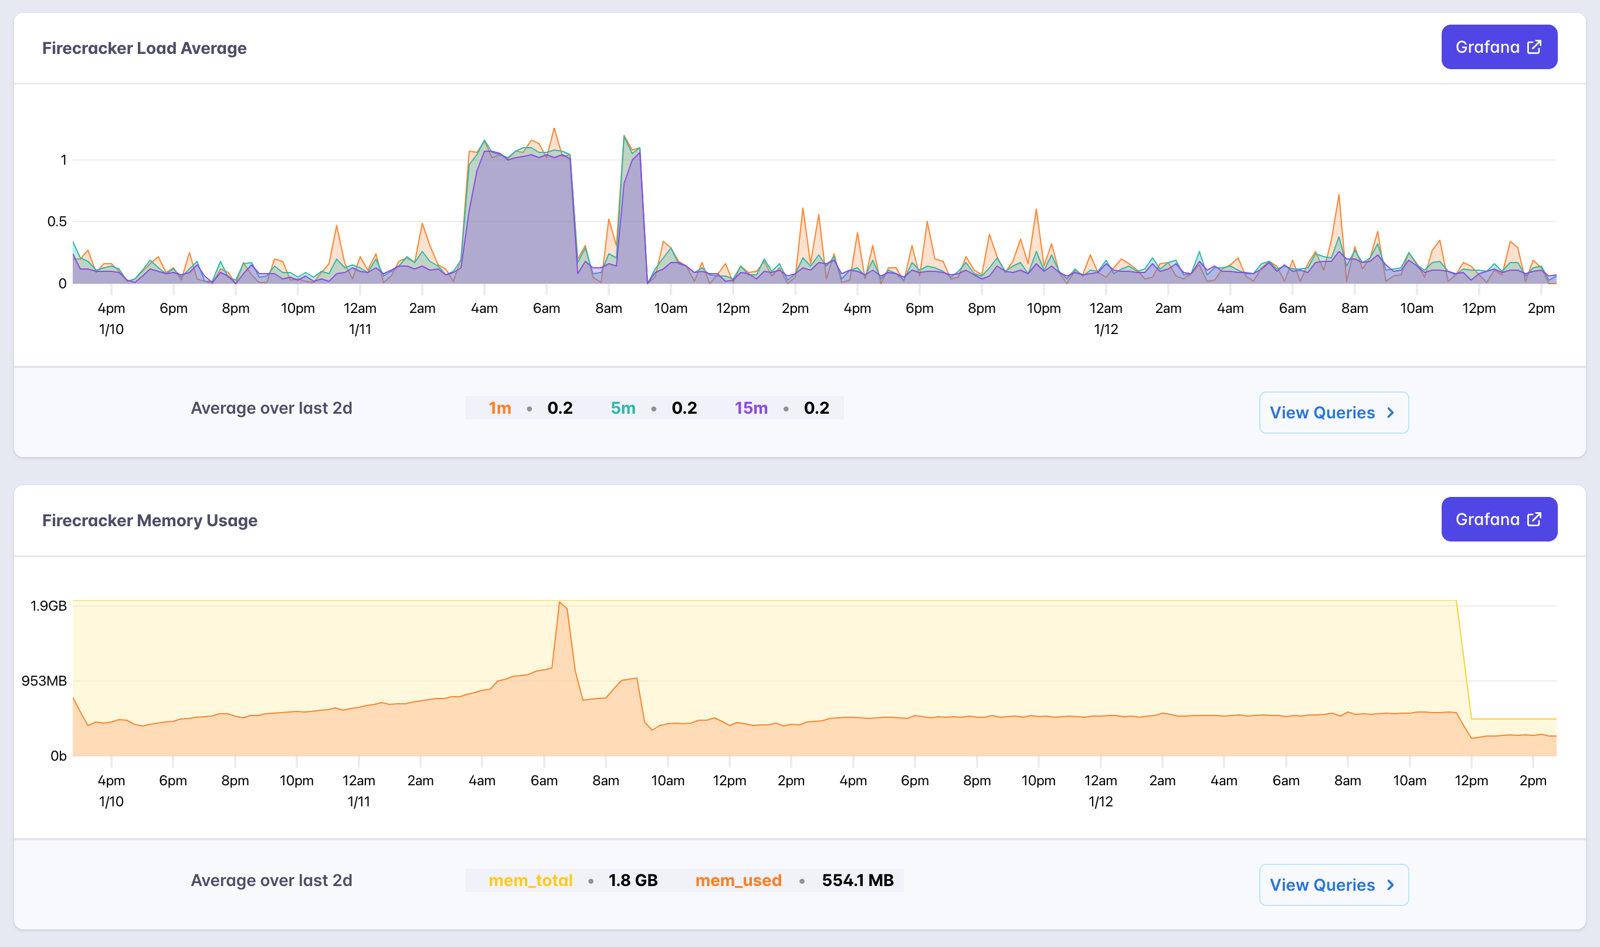
After a day of my site stabilizing at ~500MB of memory usage, I think we're finished with the memory leak. Matteo suggested that I could probably scale down and not experience any issues because V8 pretty much takes all the memory you give it even if it doesn't really need it (like I said... 🐷). So I've scaled it down from 2GB of memory to 512MB and check this out:
I'm looking forward to this two day view to no longer have those CPU and memory spikes. That sudden drop in memory is when I scaled down to 512MB and now my app is sitting happily at around 250MB of memory usage.
I'm really excited to finally close the book on this one. It makes me feel good to know that code responsible for the memory leaks wasn't anything I wrote myself 😅 I'm looking forward to trying to deploy to multiple regions next week so we can make this site lightning fast no matter where you are in the world.
I hope this post was helpful to you. Big thank you to Matteo for all the help!
此内容由惯性聚合(RSS阅读器)自动聚合整理,仅供阅读参考。 原文来自 — 版权归原作者所有。