



In July, I will run another live edition of CODE100 at the WeAreDevelopers World Congress and if you want to take part and earn your spot on stage in front of 5000 people, why not have a go at solving this year’s challenge?
Oh dear, we wanted to show you some data insights about the WeAreDevelopers World Congress speaker submissions, but things went very wrong and our bar charts exploded …

Now we call on all you coders, hackers and developers out there to help us recover the data we wanted to show.
Each bar of the chart has been rotated, moved to a different part of the screen and scaled.
We were able to analyse the location and other data though. For each bar chart you get the `x` and `y` screen coordinate where its bounding box starts, the angle of the `Rotation` in radians, the `scale` as a factor of 1 and the `width` and `height` in pixels.
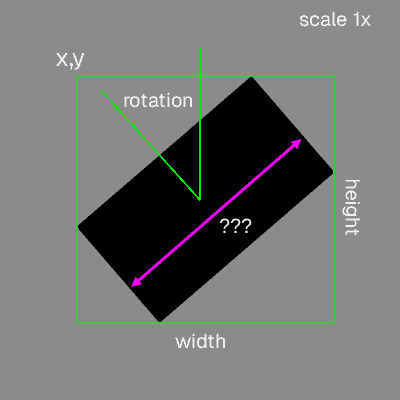
All the data you need is in dataset.csv in the format of comma separated values.
Item,Group,x,y,Width,Height,Rotation,Scale
JavaScript,Languages,239.97,391.67,56.71,29.15,0.28,0.76
Python,Languages,401.44,353.55,59.43,43.76,0.54,0.77
Now, what we want you to use your coding skills for is to find the widths of the bars…
Can you tell us:
For example (no, not the real data):
Biggest item is JavaScript with 14
Smallest item is Cobol with 2

Averages:
- Languages: 30
- Tools: 23
- Categories: 78
- AI topics: 12
Do you have your results? Then why not apply as a Challenger for the CODE100 in July ?
此内容由惯性聚合(RSS阅读器)自动聚合整理,仅供阅读参考。 原文来自 — 版权归原作者所有。