


The most common causes for Macs to perform poorly are excessive memory use and excessive CPU load. Although they’re easy to distinguish in Activity Monitor, if your Mac has a cooling fan you should be able to tell them apart before you even look at the figures there: high CPU load is usually accompanied by the sound of the fans running up, while high memory use isn’t. Poor performance means that actions that are normally instant result in a pause, sometimes long enough to show the spinning beachball, and repeatedly seeing the beachball should send you straight to Activity Monitor to look for a cause.
In Activity Monitor, click on the Memory tab at the top of the window, then click the column header Memory to sort the entries with the largest memory use at the top. In the View menu, ensure that All Processes is ticked, or system processes may be hidden. Confirm the window title reads Activity Monitor All Processes.

App memory leak
Excessive memory use doesn’t necessarily mean there’s a memory leak: it may just be that what you’re doing in that app requires many GB of memory. To distinguish these, as soon as you can, save your work and close that document in the app that’s using all the memory. If that results in memory use falling back to what seems normal, then this isn’t likely to be a memory leak, but simply reflects the demands your document is placing on the app.
App memory leaks in user space are readily identified using Activity Monitor or a substitute displaying accurate figures for app memory use. An app that might start up using a few hundred MB of memory grows steadily with time and usage until it reaches many GB, by which stage the app’s performance normally suffers, as much of that may be virtual. This could well be sufficient to push overall memory use into the red zone.
Looking at the detail at the foot of Activity Monitor’s window, you’ll see a value for the physical memory installed in your Mac, how much memory is used, whether there are any files cached from disk into memory, and any swap memory usage. Memory used is further broken down into App and Wired memory, and the amount that’s compressed to save space.
macOS supports the extension of memory to include disk storage, so-called virtual memory. This is managed by a combination of hardware and software, enabling some of the memory being used to be swapped out to disk, rather than occupying physical memory. There are complex trade-offs in putting what should be in physical memory into disk storage, and how much physical memory to keep free. These are normally managed expertly by macOS, and shouldn’t be meddled with.
With Activity Monitor still open, use the app as you would normally. In this example, the figures shown are for the Finder in Monterey.

Memory used by the app quickly starts to climb, here reaching over 1 GB, and continues to rise as long as you continue to work in that app.

In this case, memory used by the Finder reached a maximum of 3.11 GB. Not only that, but closing the app’s window didn’t recover any of that used memory: from now on, that’s the app’s starting point. Continue to work in that app and the memory used will rise again, and never fall. It will do that, voraciously consuming memory, until you quit the app, or in this case restart the Finder.
When you open that app again you’ll see how little memory it should have been using. Although it can’t run for long in as little, both the app and your Mac will be able to run much faster again, with ample free memory.
Most app memory leaks are simple programming errors on the part of those coding that app. The use of modern high-level programming languages like Objective-C and Swift has reduced these, as most memory allocation and freeing is handled automatically, so there are no calls normally required to deallocate memory. This becomes more complex when an app uses macOS frameworks, as some of the older frameworks still rely heavily on the code manually deallocating memory when it’s no longer required, and that can catch developers out. The frameworks can also change, and suffer their own bugs, so there’s ample scope for everyone involved to shoulder the blame.
For the user, there’s only one way to live with app memory leaks: quitting the app should return all the memory that was allocated to it. If a leaking app has reached (say) 20 GB of memory used, save your work, quit the app, and open it again. While this isn’t convenient, it does allow you to continue working, as does switching to another app which can do the same job. Always let the app developer know, so that they can discover the cause and fix it.
The case of the Finder in Monterey shown above is of particular interest, as that looked like a leak, but in fact was intentional caching behaviour, most prominent when viewing many images in a Gallery view window. The Finder automatically flushed those huge caches under memory pressure, or after a period of about two days. To confirm that behaviour you needed to track the Finder’s memory use for over 48 hours. Since then, on Apple silicon Macs running Tahoe at least, the Finder no longer does that, presumably relying on disk caching instead.
These days the most likely offenders seem to be Pages and sometimes even Mail. Many users have reported that leaving large documents open in Pages, or large mailboxes in Mail, can bring their memory usage up to 9 GB or more, with obvious effects on performance. The best workaround is to close open documents, quit the app, and check whether that memory is returned fully. If it isn’t, then restarting may be necessary.
Kernel memory leak
Memory problems with apps can almost invariably be solved by quitting that app, but those occurring in the kernel are more serious, as they’re likely to result in a kernel panic, normally their first and only sign. They’re not only more serious and harder to detect, but there’s usually nothing the user can do apart from restarting the Mac and capturing a panic log.
Some do arise in third-party kernel extensions, so your next action should always be to disable the use of third-party kernel extensions in Startup Security Utility, in Recovery Mode, and return an Apple silicon Mac to Full Security. In Intel Macs, you’ll need to uninstall the kernel extension, as their Secure Boot doesn’t control the loading of third-party kernel extensions.
The last major kernel memory leak occurred in the Catalina 10.15.6 update in July 2020, right at the end of its development cycle. Although kernel memory leaks are very rare in release versions of macOS, they could occur in any version, not just major updates.
Most kernel memory leaks occur in special pools of memory reserved for ready use by the kernel and its extensions, known as Mach zones. When a user process wants some memory, it asks to be allocated some by the kernel using a call such as malloc(); when a kernel extension wants some memory allocated to it, it uses a different call such as zalloc() or kalloc(), which aren’t available to user processes, so that the memory is allocated from that reserved for kernel mode processes. These are similar to what are known as memory caches in Linux, or Pools in Windows.
Mach zones aren’t normally open to inspection by the user, except with the
sudo zprint
command, which provides a vast list of each of the Mach zones in use and figures for their usage. These have changed considerably since the days of Catalina, making it hard for even advanced users to see the wood for all these trees.
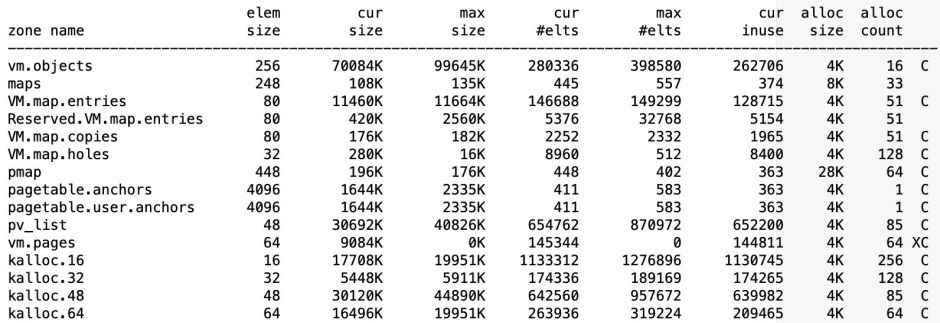
This is just a brief part of a long list of all the zones, giving the size of the memory blocks it contains, its current total size and the maximum, the current number of elements and the maximum, and more.
Over time, even a small kernel memory leak can progressively consume all the elements currently allocated within one or more of these zones. This is detected as the zone size in use approaches its maximum, the high water mark. Some zones are expandable, and macOS can then allocate additional memory from a dedicated zone_map area to expand that zone. Rarely, such additional memory can be obtained from memory outside the zone_map, but in most cases that’s not possible, and the eventual result is zone_map_exhaustion – zone memory has run out, even though some zones still have memory available. Thus, a memory leak in a kernel extension can run the kernel out of zone memory, something you wouldn’t notice in Activity Monitor, which is concerned with the management of user memory.
As always, following a kernel panic, the most important tool is the panic log. At the very top of the log, following the first word panic, the log should reveal that a memory leak is to blame:
panic(cpu 8 caller 0xffffff80017729eb): "zalloc: zone map exhausted while allocating from zone kalloc.12288, likely due to memory leak in zone kalloc.48 (6586956000 total bytes, 137228148 elements allocated)"@/AppleInternal/BuildRoot/Library/Caches/com.apple.xbs/Sources/xnu/xnu-6153.141.1/osfmk/kern/zalloc.c:3627
How to deal with a kernel panic explains this in more detail.
Summary
- App memory leaks are a relatively common cause of poor performance, diagnosed using the Memory pane of Activity Monitor.
- A memory leak occurs when an app uses memory but doesn’t return it when it’s done; it’s marked by rising memory use in Activity Monitor, which doesn’t get freed until you quit the app.
- Work around an app memory leak by saving your work and quitting the app before its memory use becomes excessive.
- Always report an app memory leak to its developer so they can identify the cause and fix it.
- Kernel memory leaks are rare, and most likely to lead to a kernel panic. The panic log should then be diagnostic.