


Databricks ingests petabytes of security logs from a variety of sources including endpoint security tools, cloud activity logs, and threat intelligence feeds into our security lakehouse. Our detection architecture continuously monitors this data for malicious activity. Every identified signal lands in a centralized alerts table, where it awaits review by an Incident Response (IR) analyst.
Finding a real threat in thousands of daily security alerts is the classic needle-in-a-haystack problem. Most teams handle the load by prioritizing alerts by severity. Teams will triage the HIGHs and MEDIUMs, and work through LOWs as bandwidth becomes available.
At Databricks, our IR team handles security alerts across all three priority levels. Historically the team prioritized HIGH and MEDIUM alerts due to the volume and low fidelity of LOW alerts. Every security team at scale faces this same tradeoff: increase analyst headcount, raise alert thresholds and accept blind spots, or find a way to automate the process. We chose the latter, leveraging agents that can reason and execute judgment at scale.
To validate whether agents could reliably triage and escalate security alerts, we started with low-severity alerts. Our goal was simple: identify the alerts that warrant further investigation.
We took a naive approach at first, and put all the relevant alert data into a single prompt and let a foundation model decide what to escalate. This approach produced a 50% escalation rate. Sending half of all alerts to analysts wasn’t triage, it was just a different kind of noise.
The problem was context. A single agent reasoning across every alert has no way to distinguish what abnormal looks like for each source. Everything needed to triage an alert accurately — its false-positive patterns, behavioral baselines, and relevant enrichment — is specific to the source. Without that context, general cybersecurity knowledge was all the model had to work with, and that was not enough for accurate triage.
We rebuilt the pipeline around 17 source-specific agents, each tuned to a single detection source because the context needed for accurate triage is highly source-specific. A single source can emit dozens of distinct detections, and its agent handles all of them.
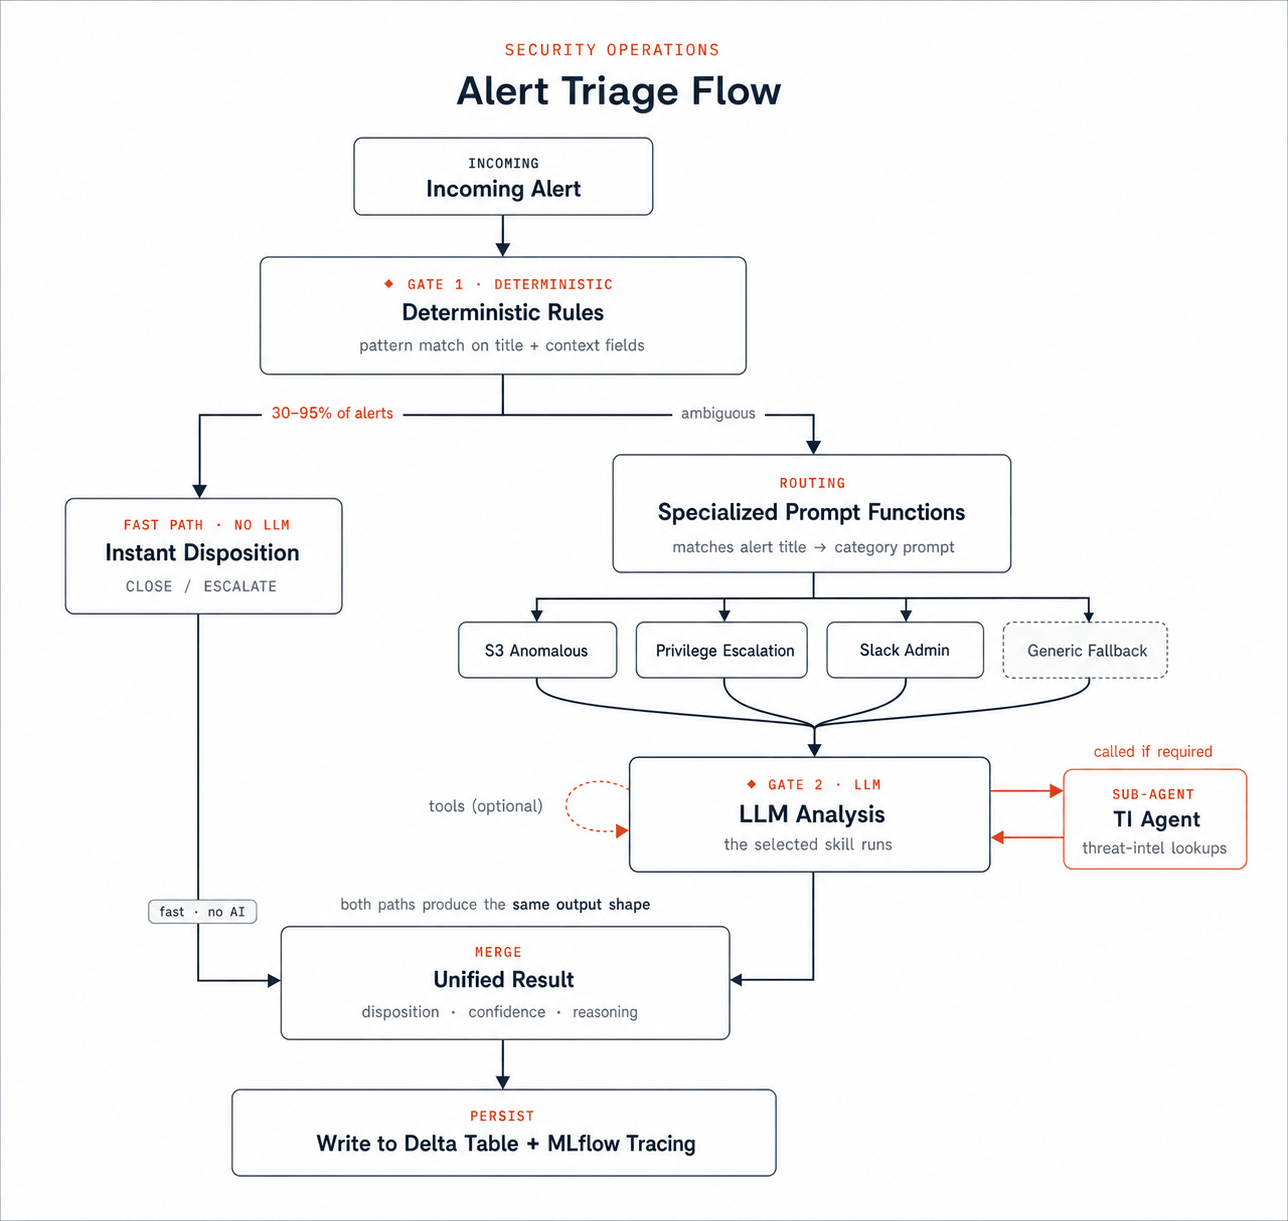
We also have a dedicated Threat Intelligence (TI) agent that sits alongside the triage fleet of low severity agents and can be called by any agent when it encounters an indicator or behavior that warrants deeper investigation. The TI agent queries our threat intelligence sources and returns a structured assessment: is this artifact known malicious, unknown, or benign. This matters because raw indicators of compromise are meaningless without context. An IP address is just a number. The same IP enriched with “associated with C2 infrastructure from the past 14 days, high confidence” is immediately actionable by the agent.
Using Structured Streaming on Databricks, low-severity alerts are ingested as they trigger, enriched with additional context by the TI agent, and routed to the appropriate sub-agent for review.
Each agent follows the same design principles:
Deterministic filtering. Programmatic checks match on alert title and context fields to suppress known-benign signals (environment-specific nuances such as trusted IP lists, service account activity, expected tooling behavior) and produce instant dispositions without any LLM call. These handle 30–95% of alert volume depending on the source. Things like “known safe IAM role performing expected operations” or “admin email doing routine workspace governance.” Filtering can happen at the detection layer or next to the triage logic itself.
Context enrichment. Before the LLM sees the alert, the agent pulls recent alert history for the affected entity, related activity, and other relevant signals. Agents can also invoke other agentic capabilities during enrichment — for example, calling the dedicated Threat Intelligence agent when an alert contains an IP or domain worth investigating.
Specialized prompt functions. Each alert title maps to a prompt function. For example, S3 anomalous access alerts go to a function with instructions for evaluating IAM recon, and privilege escalation alerts go to one that knows expected versus unexpected role assumption patterns. If no dedicated function matches, a generic fallback prompt handles the alert. Prompt functions run in single-turn mode (one LLM call) or agentic mode (multi-turn tool-calling loop) depending on whether the alert needs additional context to triage confidently.
Shared tools. Tools are optional and agent-specific. When triage requires more context — raw cloud audit logs, cross-source correlated alerts, or IdP activity history — we equip the agent with tools to retrieve it, and the LLM decides whether and when to invoke them based on the ambiguity of the evidence.
Shared utilities. To manage the overhead of maintaining several agents, we refactored shared utility code into a common framework that handles agent invocation, retries, and performance evaluation. All logic consistent across data sources lives here, including the LLM calling loop, disposition parsing, tool dispatch, result persistence to Delta tables, token tracking, MLflow tracing, and prompt injection detection.
LLM reasoning and disposition. The model analyzes the evidence package and returns a structured output including a disposition (escalate, monitor, or close) with supporting analysis.
Cost management. There are three controls on spending. First, deterministic filtering ensures alerts matching known-benign patterns never reach an LLM. The cheapest call is the one you never make. Second, a cost tracker accumulates estimated spend across each batch and stops processing if a configurable cap is hit, recording remaining alerts as skipped. Third, a daily alert cap provides a ceiling on total daily cost regardless of inbound volume. Within each alert, per-category tool call budgets prevent runaway discovery loops where an LLM might otherwise keep querying for additional context indefinitely.
If the agent decides to escalate, the alert becomes a ticket in the IR queue, where analysts review both the raw alert and the agent's analysis before making a final triage decision. When an analyst disagrees with an agent's escalation, the ticket is labeled as a false positive, and that feedback is used to tune the agent's performance. We found that agent-escalated low alerts were roughly 10x more likely to be true positives than existing alerts prioritized as HIGH and MEDIUM severity.
When a human analyst reviews an escalated ticket, their decision to confirm or override the agent becomes the ground truth for evaluation. Unlike deterministic programs, where you can test against a fixed specification, agents exercise judgement. The same alert can produce different outputs across executions. So instead of testing against a specification, we test against a standard dataset developed by IR analysts who already know what a high-quality triage decision looks like.
Every agent request is recorded using MLflow, capturing inputs, intermediate steps, and final outputs. As IR analysts label tickets in the course of their normal workflow, each label is recorded directly on the corresponding MLflow trace as an expected response. These labeled traces establish a ground truth dataset that captures analyst judgment at scale. That dataset becomes the benchmark for evaluating any future prompt changes before they ship.
To measure beyond false positives, we plan to use the Databricks Review App, an interface for reviewing alerts and labeling MLflow traces. Analysts can see the agent's inputs, reasoning, and decision for each alert and record the expected outcome directly on the trace. This lets analysts review non-escalated alerts as well, building out ground truth coverage for alerts the agent chose to monitor or close and giving us a complete standard across all three dispositions.
Security agents now review 100% of low-severity alerts. Key metrics include:
Notable findings that were escalated by agents:
LLMs hallucinate on high-entropy security data. Hashes, random subdomains, and generated file names are hard for language models. Models are good at reasoning about language because language has patterns. Security artifacts like hashes are deliberately pattern-free, which is exactly what makes them hard for LLMs. To ensure accuracy, we use the model for reasoning and not recall. Specific artifact values are retrieved via tool calls to authoritative sources, not from a model’s memory.
Context is king. The biggest performance gains came from adding historical alert data, per-alert-type false positive rates, and explicit behavioral patterns to each prompt. When processing any alert, the triage agent pulls the last six months of alert history for the affected user. In several cases, agents escalated alerts not because the triggering event was individually high-confidence, but because it was the third or fourth suspicious signal from the same user. That kind of behavioral correlation is something previously deterministic detection rules struggle to capture.
Automate what's predictable, and let agents reason only about what isn't. Wherever possible, opt for deterministic workflows to restrict the scope of what the LLM has to look at. The more open-ended the instructions, the higher the false positive rate. Tightly scoped, step-by-step agent instructions consistently outperformed broad prompts. Applying rules-based filtering before the LLM sees an alert is one of the most effective examples of this.
This system was built on Databricks using Spark Structured Streaming for real-time alert ingestion, Delta tables for alert persistence and reporting, MLflow Tracing to capture every agent decision end-to-end, and the Databricks Review App so analysts can label traces and build ground truth directly from production data.
At Databricks, we build the tools we use. This is one example of how our own platform is powering AI-native security operations. Coming next: how Databricks Genie can bring natural language investigation to the SOC, giving IR analysts the ability to query alert data, explore context, and investigate threats conversationally.
此内容由惯性聚合(RSS阅读器)自动聚合整理,仅供阅读参考。 原文来自 — 版权归原作者所有。