惯性聚合 高效追踪和阅读你感兴趣的博客、新闻、科技资讯
阅读原文 在惯性聚合中打开

推荐订阅源

GbyAI
GbyAI
N
News and Events Feed by Topic
D
DataBreaches.Net
MongoDB | Blog
MongoDB | Blog
CTFtime.org: upcoming CTF events
freeCodeCamp Programming Tutorials: Python, JavaScript, Git & More
Engineering at Meta
Engineering at Meta
T
Tailwind CSS Blog
博客园_首页
Microsoft Azure Blog
Y
Y Combinator Blog
博客园 - Franky
Hugging Face - Blog
Hugging Face - Blog
月光博客
月光博客
A
About on SuperTechFans
I
InfoQ
S
Securelist
Last Week in AI
Last Week in AI
S
Schneier on Security
C
CXSECURITY Database RSS Feed - CXSecurity.com
Hacker News: Ask HN
Hacker News: Ask HN
Schneier on Security
Know Your Adversary
Know Your Adversary
腾讯CDC
大猫的无限游戏
大猫的无限游戏
S
Security @ Cisco Blogs
博客园 - 三生石上(FineUI控件)
Simon Willison's Weblog
D
Darknet – Hacking Tools, Hacker News & Cyber Security
T
Tor Project blog
美团技术团队
aimingoo的专栏
aimingoo的专栏
G
Google Developers Blog
罗磊的独立博客
Vercel News
Vercel News
Cyber Security Advisories - MS-ISAC
Threat Intelligence Blog | Flashpoint
The Cloudflare Blog
S
Secure Thoughts
www.infosecurity-magazine.com
Latest news
Latest news
Recent Announcements
Exploit-DB.com RSS Feed
cs.CV updates on arXiv.org
奇客Solidot–传递最新科技情报
奇客Solidot–传递最新科技情报
L
LINUX DO - 热门话题
Security Latest
Security Latest
TaoSecurity Blog
TaoSecurity Blog
Cyberwarzone
Cyberwarzone
有赞技术团队
有赞技术团队

Zero の 日常

MacBook M1 Pro 双屏方案 上海电信SDN更换7015TV CNAME与MX记录冲突小记 RHEL 7.9 从 GRUB 引导启动 Hardware upgrade for 2022 Valve Index + HTC Tracker 3.0 开箱记录! 有手就行系列:SlimeVR全身追踪方案 基于goestools与xrit-rx的GK2A气象卫星接收教程 Prometheus实现对IDRAC的SNMP监控 Maven中央仓库项目上传指南 CQ CQ CQ DE BG5ISN PSE K 关于我买不到空气显卡这件事 Mac iTerm2 lrzsz 从零开始的飞机追踪之旅 GitHub单个文件脱敏处理 Protobuf浅解 Prometheus + AlertManager实现告警推送 Prometheus Exporter Nginx负载均衡(加权轮询)
Prometheus监控系统部署
Zero · 2020-09-14 · via Zero の 日常

简介

Prometheus 是最初在 SoundCloud 上构建的开源系统监视和警报工具包 。自 2012 年成立以来,许多公司和组织都采用了 Prometheus,该项目拥有非常活跃的开发人员和用户社区。现在,它是一个独立的开源项目,并且独立于任何公司进行维护。为了强调这一点并阐明项目的治理结构,Prometheus 在 2016 年加入了 Cloud Native Computing Foundation,这是继 Kubernetes 之后的第二个托管项目。总所周知 Zabbix 在监控界占有不可撼动的地位,功能强大。但是对容器监控显得力不从心。Prometheus 则解决了容器的监控问题。

特点

  • 多维度数据模型
  • 灵活的查询语言
  • 不依赖分布式存储
  • 通过基于 HTTP 的 pull 方式采集时序数据
  • 可以通过中间网关进行时序列数据推送
  • 通过服务发现或者静态配置来发现目标服务对象
  • 支持主流的图表和界面展示,如 Grafana 等

运行流程图

运行流程图

Prometheus 采集的监控数据均以 metric(指标)形式保存在时序数据库中(TSDB),每一条时间序列由 metric 和 labels 组成,每条时间序列按照时间的先后顺序存储它的样本值。

Prometheus 通过 HTTP 协议周期性抓取被监控组件的状态,被监控组件只要提供对应的 HTTP 接口就可以接入监控。不需要任何 SDK 或者其他的集成过程。这样做非常适合做虚拟化环境监控系统,比如 V m、Docker、Kubernetes 等。

环境准备

1
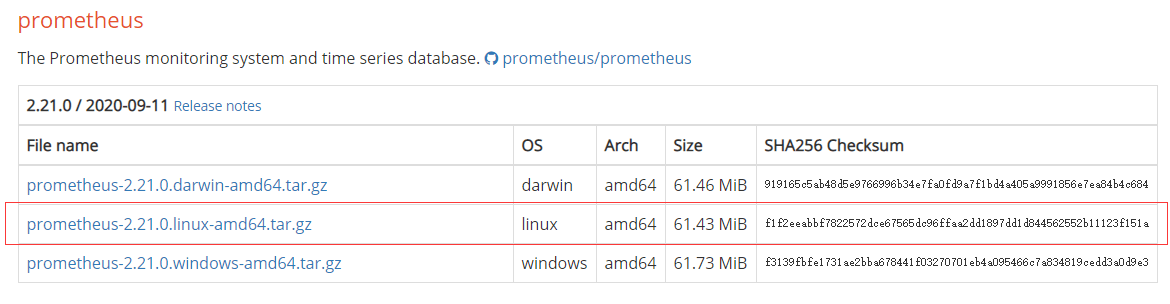
Prometheus下载地址:https://prometheus.io/download

1
2
3
4
5
6
7
8
9
10
11
12
13
# 此处以CentOS 7为例
# 下载完成后上传到服务器并解压,或者直接wget下载
wget https://github.com/prometheus/prometheus/releases/download/v2.21.0/prometheus-2.21.0.linux-amd64.tar.gz
tar -zxvf prometheus-2.21.0.linux-amd64.tar.gz
# 由于解压后的文件夹名过长,重命名文件夹
mv prometheus-2.21.0.linux-amd64 prometheus
# 根据实际路径修改路径,并指定需要监听的端口,这样,简单的Prometheus服务端就搭建好了
nohup /root/prometheus/prometheus --web.listen-address=0.0.0.0:9090 --config.file=/root/prometheus/prometheus.yml --web.enable-lifecycle --storage.tsdb.path=/root/prometheus/data --storage.tsdb.retention.time=15d &
# 不要忘记防火墙放行端口,--permanent参数为永久生效,不加此参数重启失效
firewall-cmd --zone=public --add-port=9090/tcp --permanent
# 或者直接停用防火墙(不推荐)
systemctl stop firewalld
systemctl disable firewalld

完成上述操作并成功启动 Prometheus 服务后可打开浏览器尝试访问,http://ip:9090 (IP 为部署的服务器 ip,本机部署则直接 127.0.0.1),如果顺利的话你将访问到如下页面
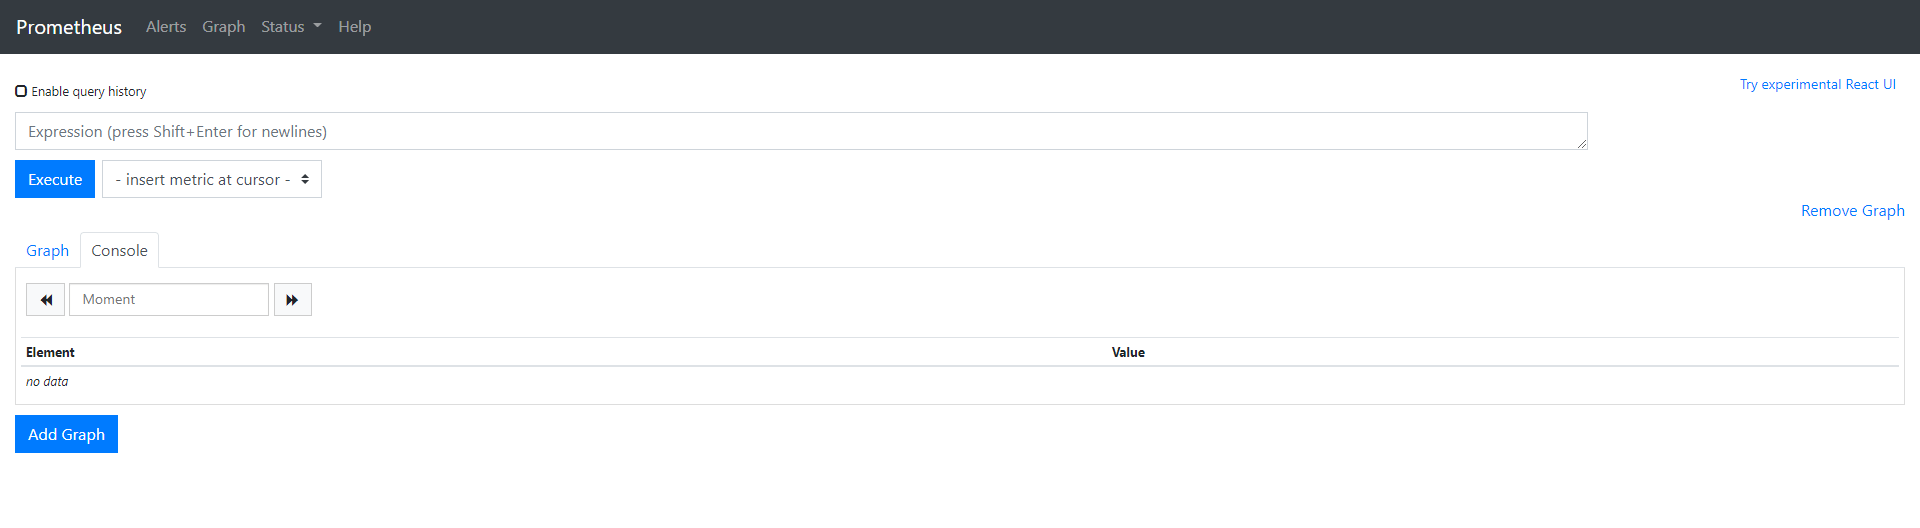
Web控制台

管理页面简介

Alert:用于配置告警规则
Graph:用来运行 PromQL 语句的一个控制台,并且可以把运行出来的语句用用图形化进行展示
Status:包含系统信息,系统状态,配置信息,目标节点的状态,服务发现状态等元信息的查看

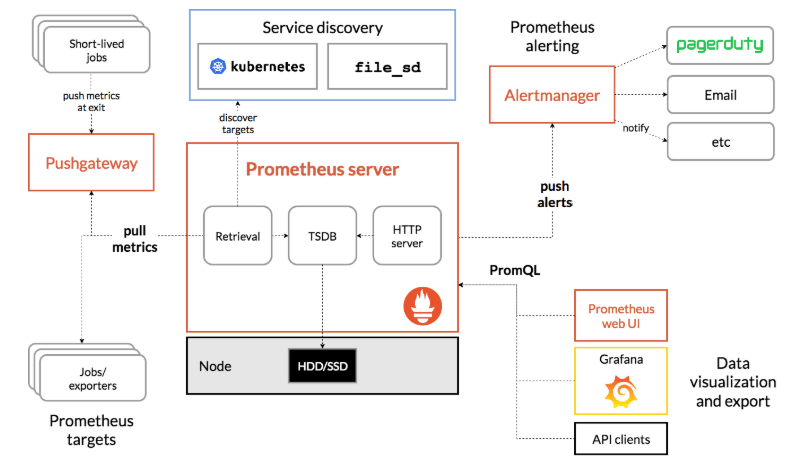
这张图是官方的整体架构图。米黄色部分是 Prometheus 自己的组件,绿色的为第三方的中间件和应用。
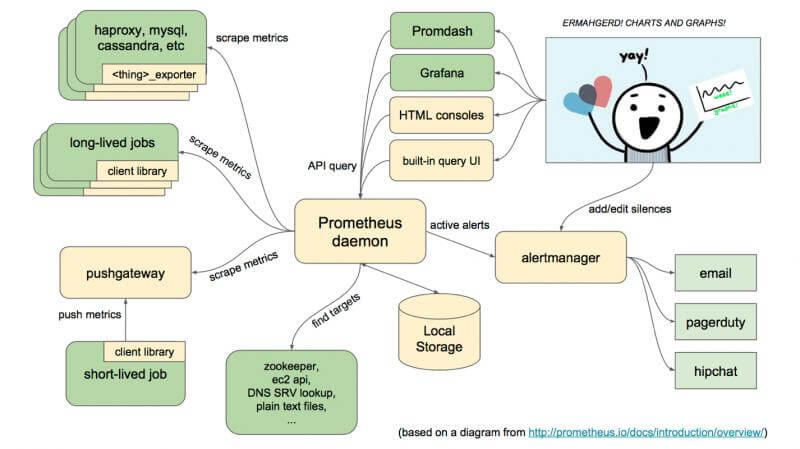
Prometheus整体架构及生态

模拟数据源

Prometheus 主要是通过拉取的方式获取数据,那么我们模拟一个数据源,并让 prometheus 去拉取。
先新建一个 SpringBoot 项目,并添加如下 pom 依赖

1
2
3
4
5
6
7
8
9
10
11
12
<dependency>
<groupId>org.springframework.boot</groupId>
<artifactId>spring-boot-starter-web</artifactId>
</dependency>
<dependency>
<groupId>org.springframework.boot</groupId>
<artifactId>spring-boot-starter-actuator</artifactId>
</dependency>
<dependency>
<groupId>io.micrometer</groupId>
<artifactId>micrometer-registry-prometheus</artifactId>
</dependency>

并在 application.properties 里加上

1
2
3
4
server.port=8080
spring.application.name=springboot2-prometheus
management.endpoints.web.exposure.include=*
management.metrics.tags.application=${spring.application.name}

management.endpoints.web.exposure.include=* 配置为开启 Actuator 服务,Spring Boot Actuator 会自动配置一个 URL 为 /actuator/Prometheus 的 HTTP 服务来供 Prometheus 抓取数据,不过该服务默认关闭,该配置将打开所有的 Actuator 服务。

management.metrics.tags.application 配置会将该工程应用名称添加到计量器注册表的 tag 中去,方便后边 Prometheus 根据应用名称来区分不同的服务。

在工程启动类中添加如下 Bean 来监控 JVM 性能指标信息

1
2
3
4
5
6
7
8
9
10
11
12
13
@SpringBootApplication
public class DemoApplication {

public static void main(String[] args) {
SpringApplication.run(DemoApplication.class, args);
}

@Bean
MeterRegistryCustomizer<MeterRegistry> configurer(@Value("${spring.application.name}") String applicationName){
return registry -> registry.config().commonTags("application", applicationName);
}

}

在启动 SpringBoot 工程后,在浏览器访问 http://127.0.0.1:8080/actuator/prometheus ,如果服务正常,你将会看到如下内容
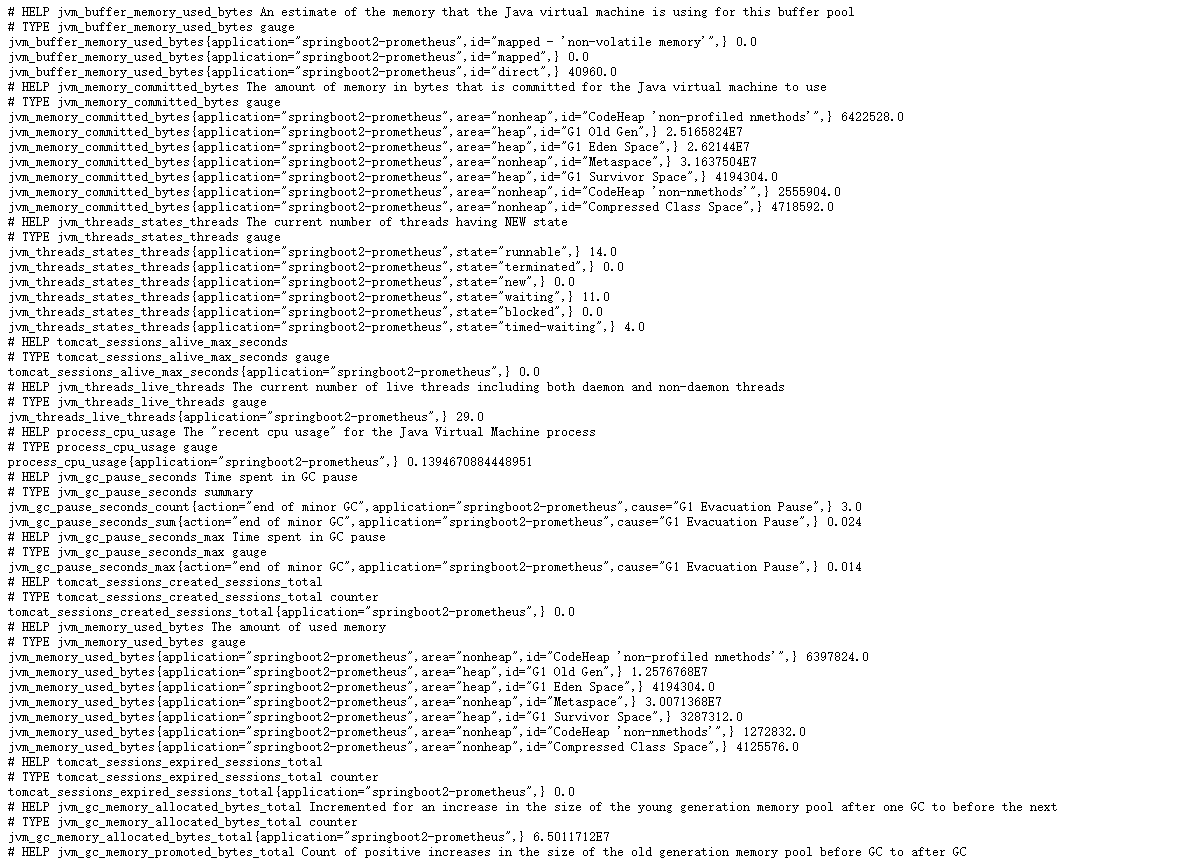
配置 Prometheus

编辑 Prometheus 目录下的 prometheus.yml 文件,并添加如下内容(需要遵循 yaml 语法,注意缩进)

1
2
3
4
5
6
7
- job_name: "test"
scrape_interval: 5s
metrics_path: "/actuator/prometheus"
static_configs:
- targets: ["192.168.80.52:8080"]
labels:
instance: demo

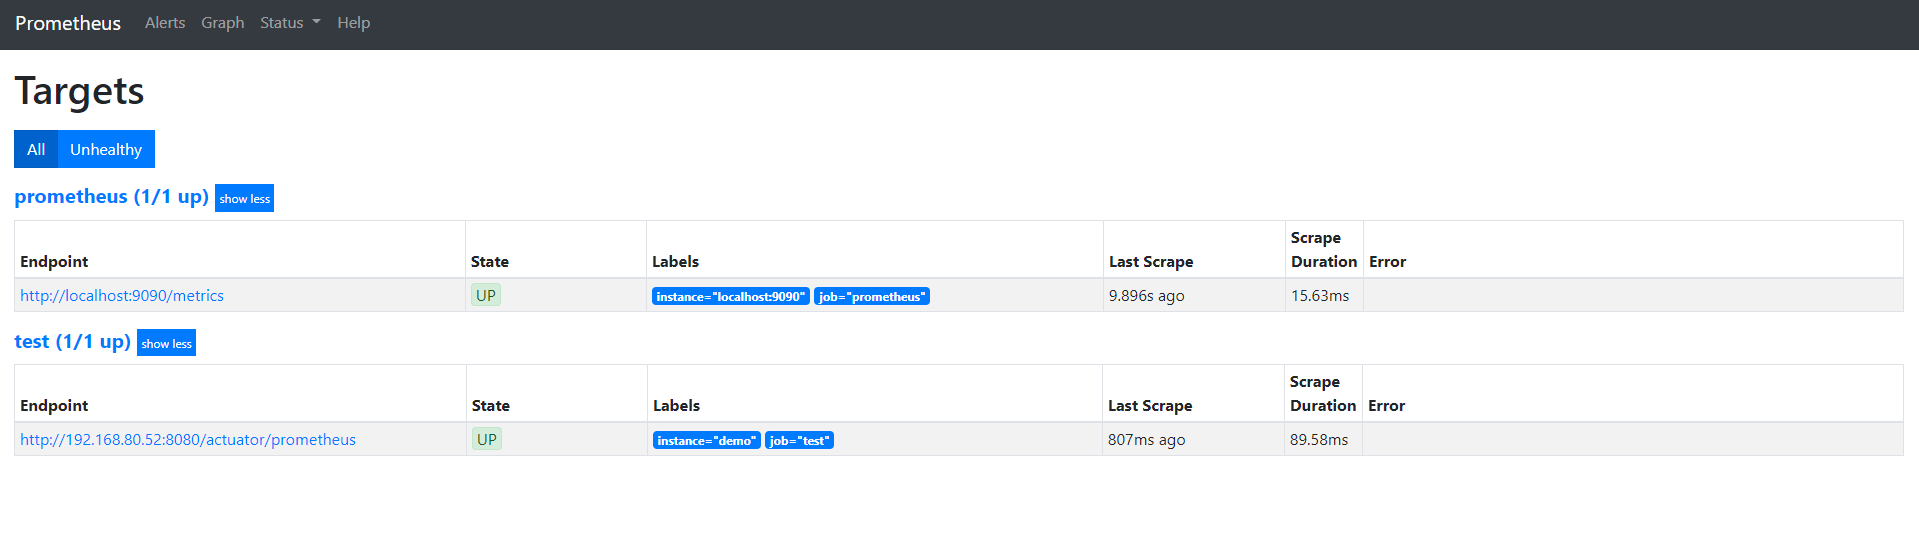
上面的配置表示 Prometheue 每隔 5 秒钟从 http://192.168.80.52:8080/actuator/prometheus 这个 url 拉取指标,并且为每个指标添加 instance 里设置的这个标签。

配置完成后重启 Prometheue 服务,并访问 Prometheue Web 控制台的 Staus 下的 targets,查看 Targets 是否添加成功,如果数据拉取正常,则 State 为 UP 状态
指标 Key 查询测试
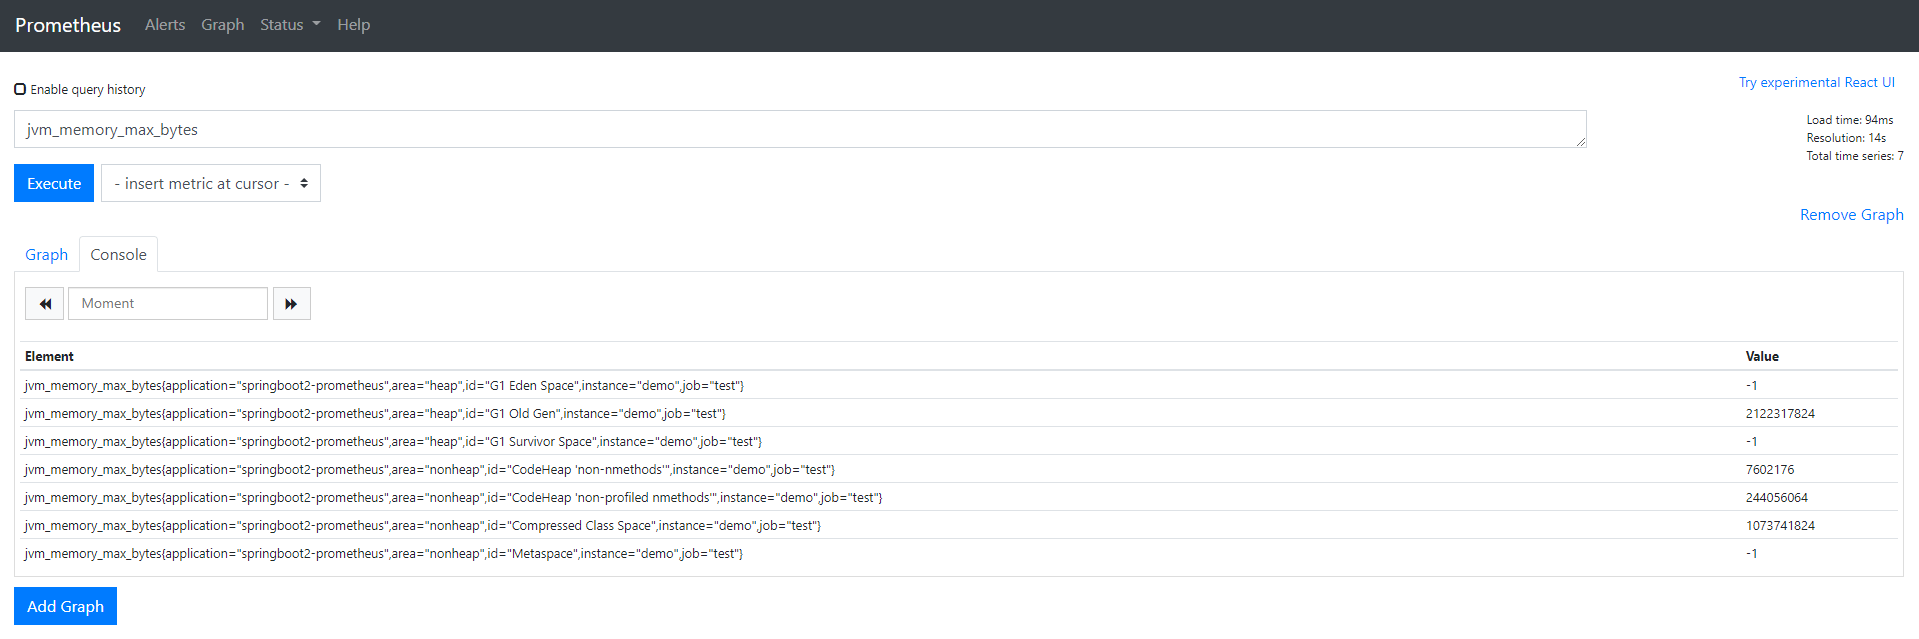
Grafana 安装

1
2
3
4
5
6
7
8
9
10
11
12
13
14
15
16
17
#编辑Grafana yum源
vim /etc/yum.repos.d/grafana.repo
#将下面的内容粘贴进去并保存退出
[grafana]
name=grafana
baseurl=https://packages.grafana.com/oss/rpm
repo_gpgcheck=1
enabled=1
gpgcheck=1
gpgkey=https://packages.grafana.com/gpg.key
sslverify=1
sslcacert=/etc/pki/tls/certs/ca-bundle.crt
#通过yum安装
yum install grafana
#启动Grafana
systemctl start grafana-server
systemctl enable grafana-server

Grafana 数据展示

安装完成后访问 http://ip:3000 即可打开 Grafana 登录页面
默认账号与密码均为 admin,首次登录需要重设密码

Grafana登录页

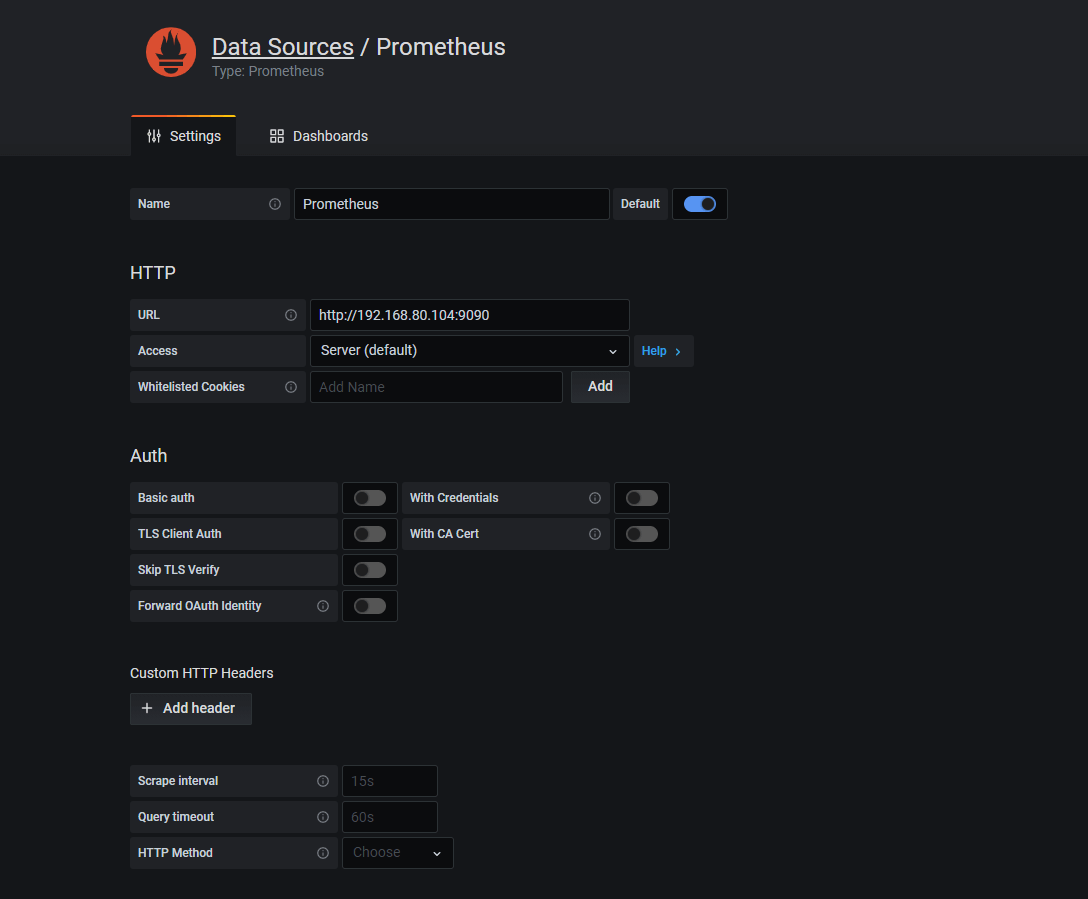
添加数据源

添加数据源

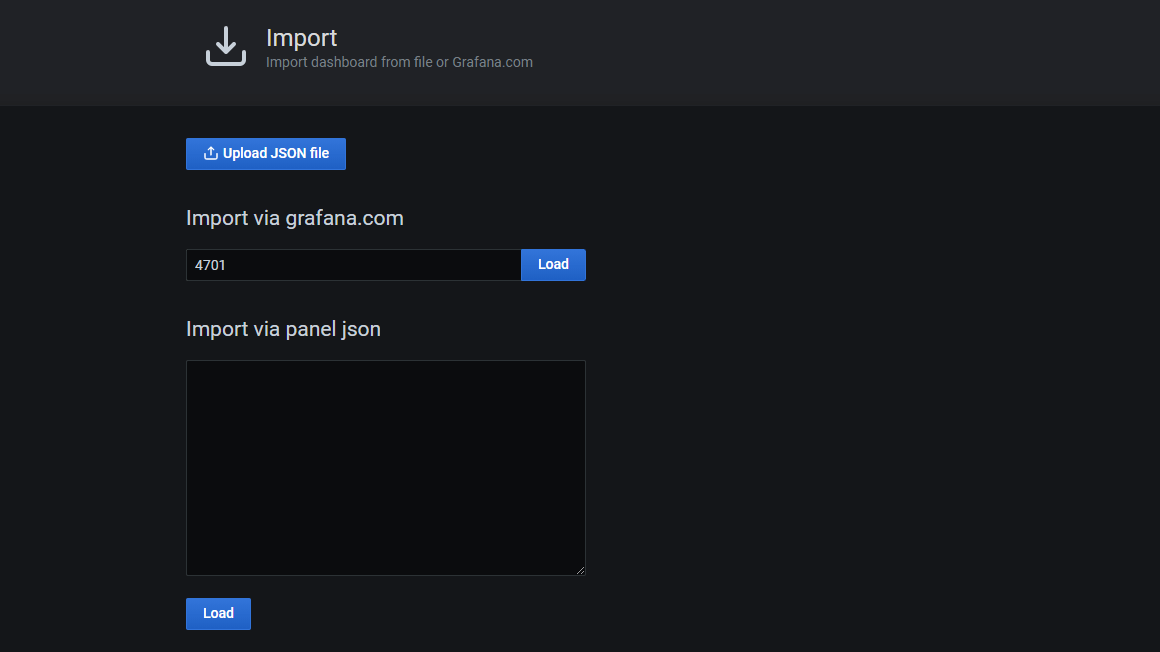
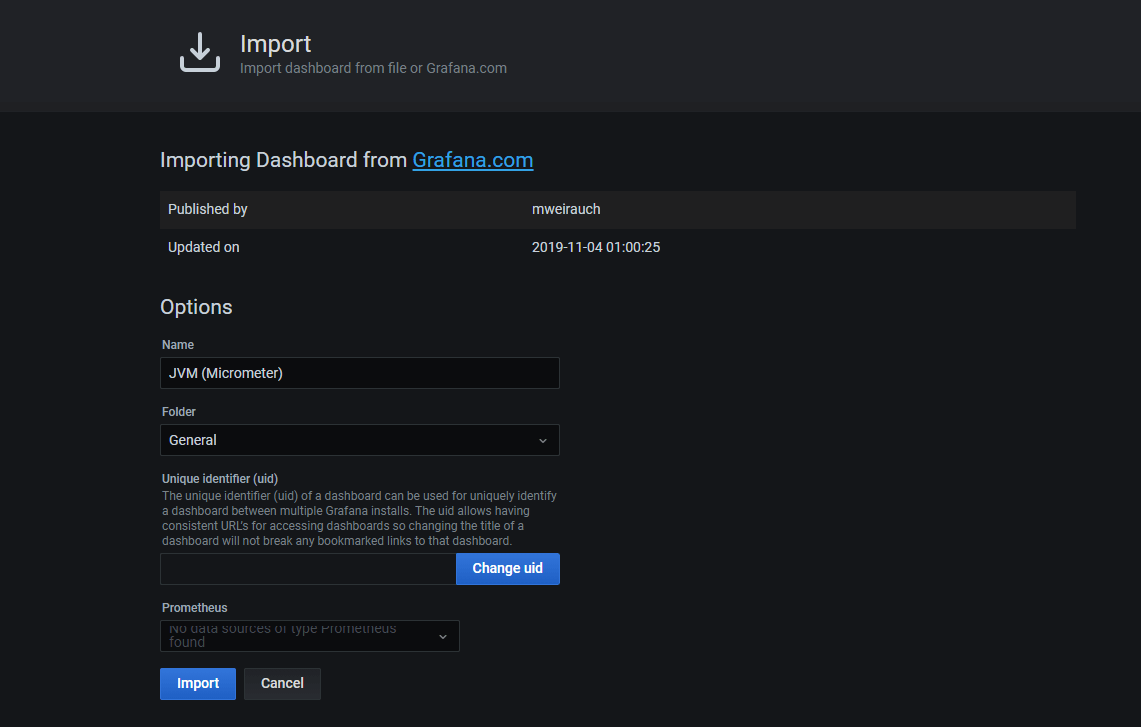
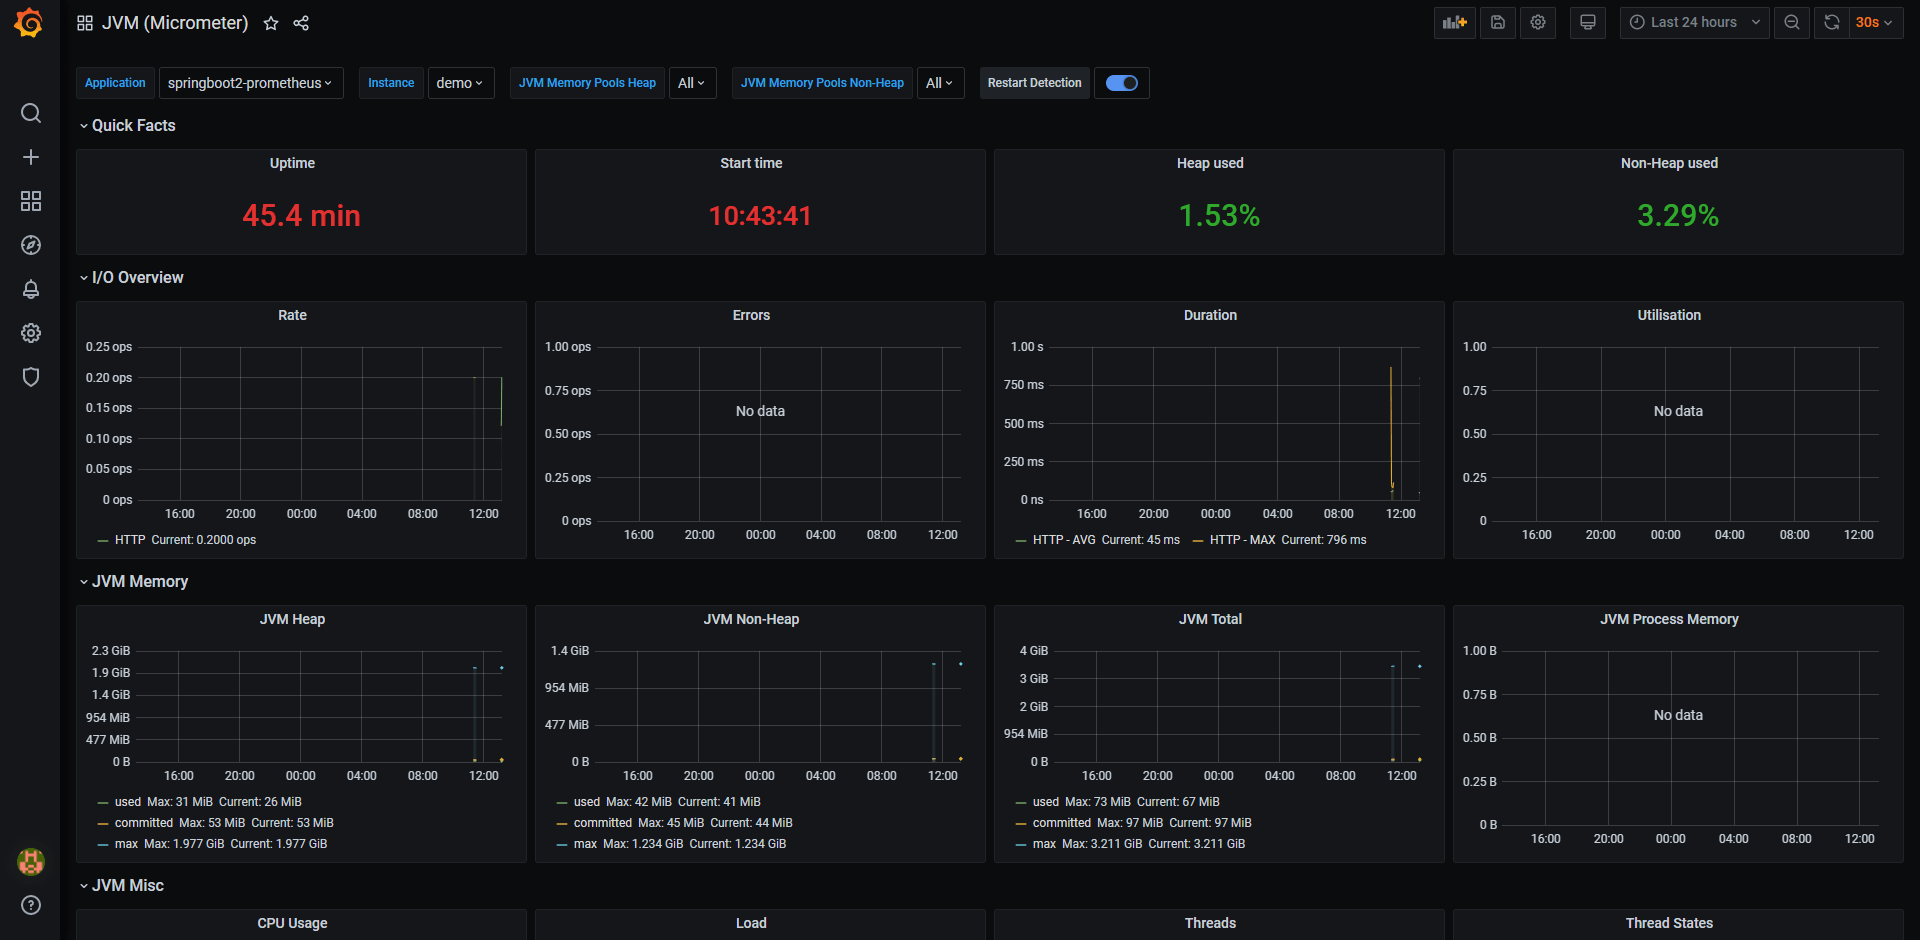
导入模板

导入 JVM 的 Dashboard 模板,模板编号为 4701
End
完.

其他文章