
惯性聚合 高效追踪和阅读你感兴趣的博客、新闻、科技资讯
阅读原文 在惯性聚合中打开

推荐订阅源

博客园_首页
阮一峰的网络日志
阮一峰的网络日志
S
Secure Thoughts
Threat Intelligence Blog | Flashpoint
C
Cyber Attacks, Cyber Crime and Cyber Security
T
Threat Research - Cisco Blogs
P
Privacy & Cybersecurity Law Blog
The Hacker News
The Hacker News
H
Heimdal Security Blog
W
WeLiveSecurity
L
LINUX DO - 热门话题
Hacker News: Ask HN
Hacker News: Ask HN
WordPress大学
WordPress大学
The Last Watchdog
The Last Watchdog
Hugging Face - Blog
Hugging Face - Blog
博客园 - 【当耐特】
D
DataBreaches.Net
I
Intezer
Webroot Blog
Webroot Blog
C
Cisco Blogs
AWS News Blog
AWS News Blog
博客园 - 聂微东
T
The Blog of Author Tim Ferriss
V
Vulnerabilities – Threatpost
罗磊的独立博客
Google DeepMind News
N
Netflix TechBlog - Medium
Schneier on Security
宝玉的分享
宝玉的分享
博客园 - 叶小钗
PCI Perspectives
PCI Perspectives
D
Docker
Scott Helme
Scott Helme
NISL@THU
NISL@THU
J
Java Code Geeks
B
Blog RSS Feed
Google Online Security Blog
OSCHINA 社区最新新闻
OSCHINA 社区最新新闻
T
The Exploit Database - CXSecurity.com
AI
AI
美团技术团队
Cloudbric
Cloudbric
月光博客
月光博客
P
Proofpoint News Feed
T
Tailwind CSS Blog
Google DeepMind News
小众软件
小众软件
www.infosecurity-magazine.com
The Cloudflare Blog
cs.CV updates on arXiv.org

Blog — PlanetScale

Keeping a Postgres queue healthy — PlanetScale Patterns for Postgres Traffic Control — PlanetScale Graceful degradation in Postgres — PlanetScale High memory usage in Postgres is good, actually — PlanetScale Stripe Projects partnership: Provision PlanetScale Postgres and MySQL databases from the Stripe CLI — PlanetScale Enhanced tagging in Postgres Query Insights — PlanetScale Behind the scenes: How Database Traffic Control works — PlanetScale Introducing Database Traffic Control — PlanetScale Scaling Postgres connections with PgBouncer — PlanetScale Drizzle joins PlanetScale — PlanetScale Video Conferencing with Postgres — PlanetScale Faster PlanetScale Postgres connections with Cloudflare Hyperdrive — PlanetScale Introducing the PlanetScale MCP server — PlanetScale Database Transactions — PlanetScale Automating our changelog with Cursor commands — PlanetScale Postgres 18 is now available — PlanetScale Using MotherDuck with PlanetScale — PlanetScale $50 PlanetScale Metal is GA for Postgres — PlanetScale AI-Powered Postgres index suggestions — PlanetScale $5 PlanetScale is live — PlanetScale Announcing Vitess 23 — PlanetScale $50 PlanetScale Metal — PlanetScale Report on our investigation of the 2025-10-20 incident in AWS us-east-1 — PlanetScale $5 PlanetScale — PlanetScale Benchmarking Postgres 17 vs 18 — PlanetScale Larger than RAM Vector Indexes for Relational Databases — PlanetScale Partnering with Cloudflare to bring you the fastest globally distributed applications — PlanetScale Processes and Threads — PlanetScale PlanetScale for Postgres is now GA — PlanetScale Postgres High Availability with CDC — PlanetScale Announcing Neki — PlanetScale Caching — PlanetScale The principles of extreme fault tolerance — PlanetScale Announcing PlanetScale for Postgres — PlanetScale Benchmarking Postgres — PlanetScale Announcing Vitess 22 — PlanetScale The Real Failure Rate of EBS — PlanetScale IO devices and latency — PlanetScale Announcing PlanetScale Metal — PlanetScale PlanetScale Metal: There’s no replacement for displacement — PlanetScale Upgrading Query Insights to Metal — PlanetScale Automating cherry-picks between OSS and private forks — PlanetScale Database Sharding — PlanetScale Anatomy of a Throttler, part 3 — PlanetScale Introducing sharding on PlanetScale with workflows — PlanetScale Announcing Vitess 21 — PlanetScale Announcing the PlanetScale vectors public beta — PlanetScale Anatomy of a Throttler, part 2 — PlanetScale Instant deploy requests — PlanetScale Anatomy of a Throttler, part 1 — PlanetScale Increase IOPS and throughput with sharding — PlanetScale Tracking index usage with Insights — PlanetScale Faster backups with sharding — PlanetScale Building data pipelines with Vitess — PlanetScale The State of Online Schema Migrations in MySQL — PlanetScale Optimizing aggregation in the Vitess query planner — PlanetScale Dealing with large tables — PlanetScale Announcing Vitess 20 — PlanetScale Self-managed Vitess vs Managed Vitess with PlanetScale — PlanetScale Achieving data consistency with the consistent lookup Vindex — PlanetScale The MySQL adaptive hash index — PlanetScale Introducing global replica credentials — PlanetScale Profiling memory usage in MySQL — PlanetScale Summer 2023: Fuzzing Vitess at PlanetScale — PlanetScale How PlanetScale makes schema changes — PlanetScale Identifying and profiling problematic MySQL queries — PlanetScale The Problem with Using a UUID Primary Key in MySQL — PlanetScale Announcing Vitess 19 — PlanetScale PlanetScale forever — PlanetScale Introducing schema recommendations — PlanetScale Amazon Aurora Pricing: The many surprising costs of running an Aurora database — PlanetScale Three common MySQL database design mistakes — PlanetScale OAuth applications are now available to everyone — PlanetScale Deprecating the Scaler plan — PlanetScale PlanetScale branching vs. Amazon Aurora blue/green deployments — PlanetScale Databases at scale — PlanetScale Considerations for building a database disaster recovery plan — PlanetScale Working with Geospatial Features in MySQL — PlanetScale PlanetScale vs Amazon Aurora replication — PlanetScale Introducing the Vantage and PlanetScale integration — PlanetScale MySQL isolation levels and how they work — PlanetScale Introducing the schemadiff command line tool — PlanetScale $ pscale ping — PlanetScale Announcing foreign key constraints support — PlanetScale The challenges of supporting foreign key constraints — PlanetScale What is HTAP? — PlanetScale Introducing Insights Anomalies — PlanetScale Webhook security: a hands-on guide — PlanetScale Announcing the Fivetran integration — PlanetScale Introducing webhooks — PlanetScale What is MySQL replication and when should you use it? — PlanetScale Sync user data between Clerk and a PlanetScale MySQL database — PlanetScale Introducing database reports — PlanetScale Distributed caching systems and MySQL — PlanetScale What is MySQL partitioning? — PlanetScale MySQL High Availability: Connection handling and concurrency — PlanetScale Personalizing your onboarding with Markdoc — PlanetScale PlanetScale vs. Amazon Aurora — PlanetScale PlanetScale vs. Amazon RDS — PlanetScale PlanetScale is bringing vector search and storage to MySQL — PlanetScale
Optimizing queries in arewefastyet — PlanetScale
2022-10-11 · via Blog — PlanetScale

Florent Poinsard, Harshit Gangal |

Arewefastyet is an automatic benchmarking tool for Vitess. It runs automated micro and macro benchmarks daily to monitor the performance of Vitess.

Arewefastyet uses PlanetScale for its database, which comes with an in-dashboard query monitoring tool: Insights. This tool provides a complete overview of your database's performance, including details all the way down to the individual query level.

Using Insights, we were able to detect and improve the performance of two slow queries, which resulted in an 85% decrease in query latency.
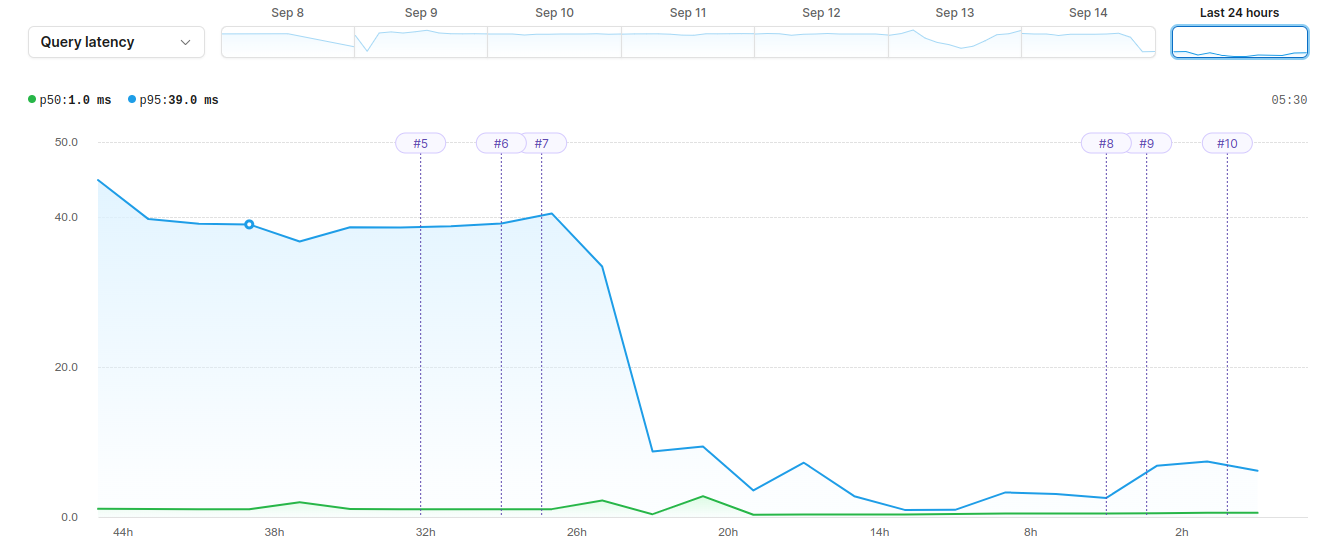
Insights graph showing query latency at 40 and then immediately dropping to around 5

Detecting the slow queries

Insights includes an overview graph that lets you see several important metrics, such as query latency and number of rows read, at a glance. As you can see in the graph above, our p95 query latency was hovering around 40 ms. We wanted to see if we could improve this, so the first step was to narrow down the latency to the most problematic queries.

With Insights, this is simple. You can view a list of all queries that ran over a selected time period and sort them based on time per query.

This table immediately surfaced two queries that were running slowly. Let's examine them now.
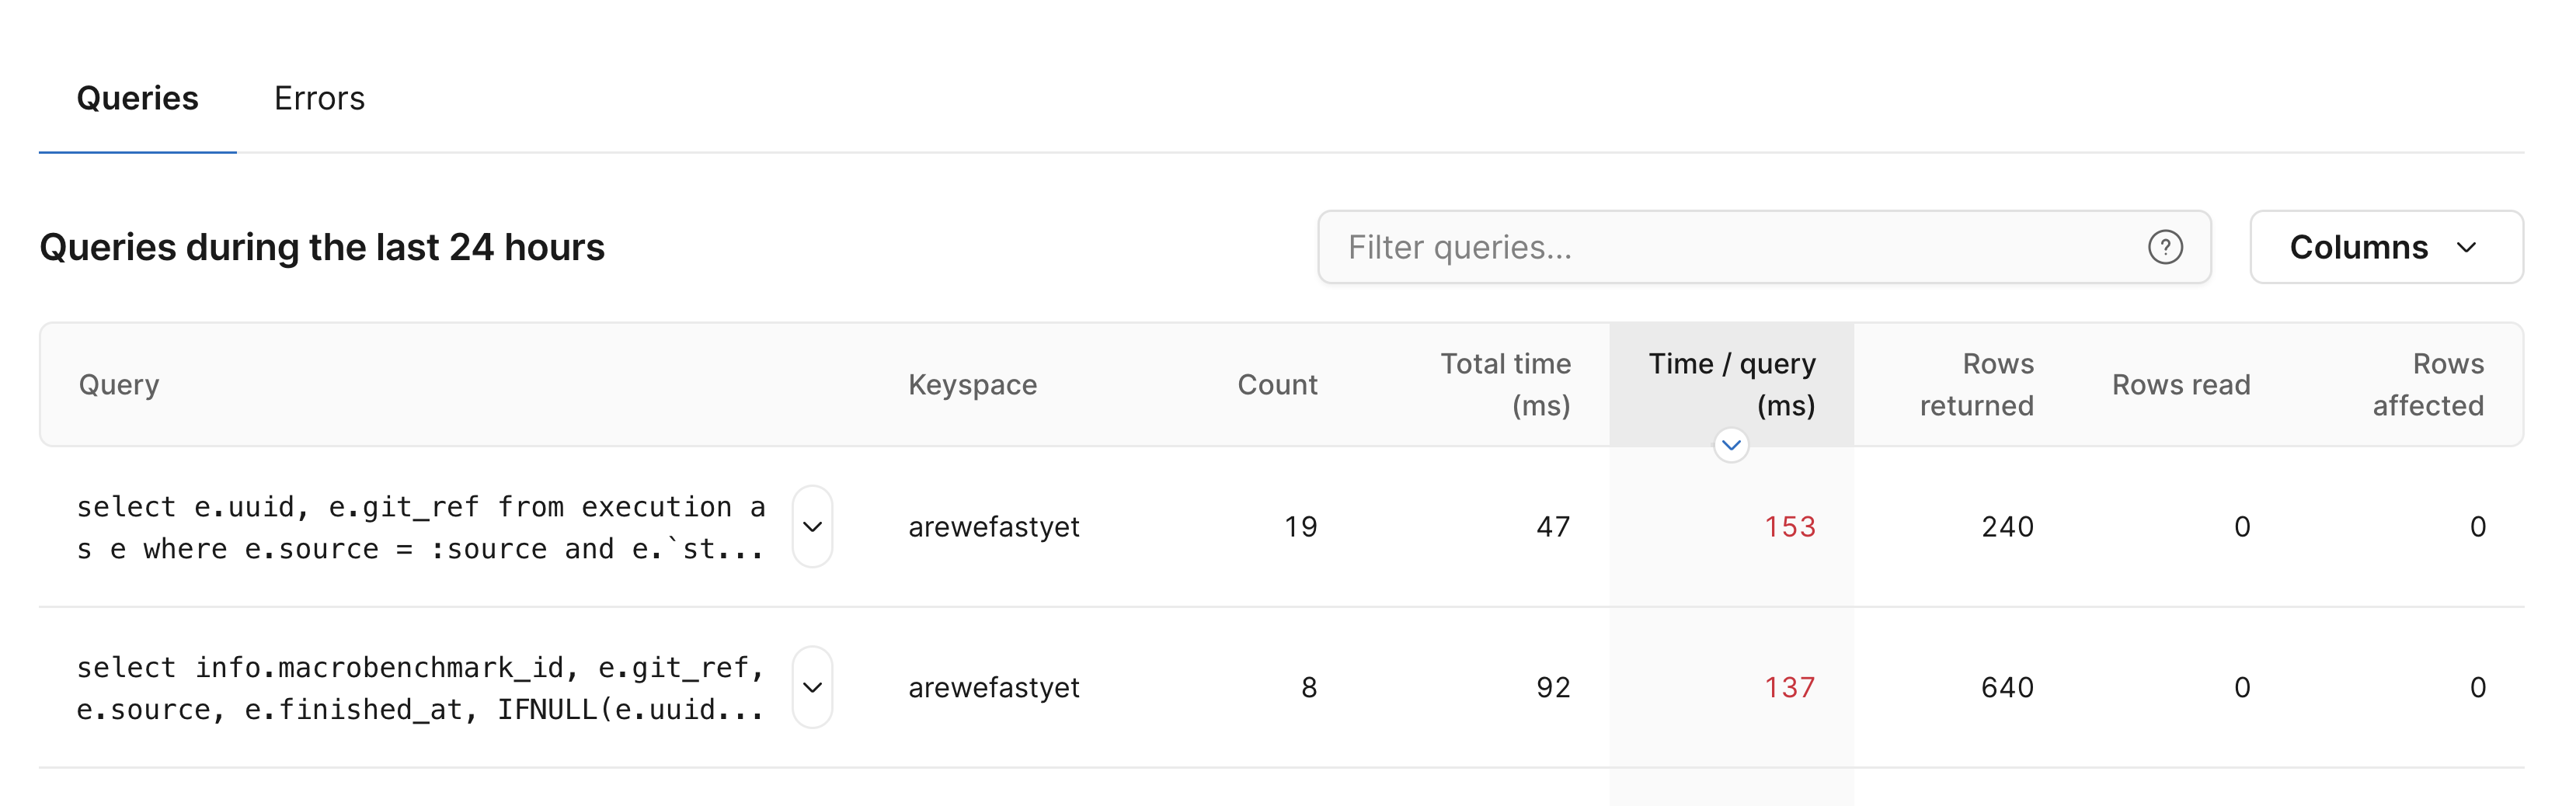
Insights list of queries sorted by time per query. Two queries are highlighted in red, signaling a high query latency

The benchmark comparison query

The first query that showed up is used to return the previous successful run of the micro-benchmarks to compare against the latest run. This comparison is visible on the Microbenchmarks page.

select
    e.uuid,
    e.git_ref
  from
    execution as e
  where
    e.source = :source
    and e.`status` = :status
    and e.type = :type
    and e.git_ref != :git_ref
  order by
    e.started_at desc
  limit
    :row_count

The OLTP and TPCC benchmark query

This next query is used to return the last runs of OLTP and TPCC benchmarks for X days. The result we get from this query allows us to display the result (qps, tps, latency, etc.) for each benchmark. We then display this information on the CRON analytics page.

SELECT info.macrobenchmark_id, e.git_ref, e.source, e.finished_at, IFNULL(e.uuid, ''), " +
		"results.tps, results.latency, results.errors, results.reconnects, results.time, results.threads, " +
		"results.total_qps, results.reads_qps, results.writes_qps, results.other_qps " +
		"FROM execution AS e, macrobenchmark AS info, macrobenchmark_results AS results " +
		"WHERE e.uuid = info.exec_uuid AND e.status = \"finished\" AND e.finished_at BETWEEN DATE(NOW()) - INTERVAL ? DAY AND DATE(NOW() + INTERVAL 1 DAY) " +
		"AND e.source = ? AND info.vtgate_planner_version = ? AND info.macrobenchmark_id = results.macrobenchmark_id AND info.type = ?

Improving the slow queries

Now that we had identified our two problematic queries, it was time to improve them. This step was straightforward. We noticed in both cases that these queries were missing an index.

We started with the OLTP and TPCC benchmark query. We opened a new PlanetScale deploy request to add an index to finished_at and status. Once merged, the deploy request is reflected in the graph below by the purple line with the number 6, meaning deploy request 6.

To address the benchmark comparison query, we added an index on started_at. This update is reflected in deploy request number 7 on the graph.

Insights graph showing query latency at 40 and then immediately dropping to around 5

As you can see, these two small additions resulted in an 85% decrease in query latency. With Insights, we were able to detect, debug, and massively improve our queries in just minutes.