





Modern production systems generate more data than most developers can realistically process.
Every request emits logs. Every service exports metrics. Every dependency introduces another layer of signals.
In theory, this should make systems easier to understand. In practice, it does the opposite.
Dashboards become dense, alerts become noisy, and when something breaks, the same questions still come up: What's actually wrong? Who's affected? Where do you even start?
The problem isn't observability. It's interpretation.
Most teams aren't short on metrics. They're short on meaning.
And that gap exists because developers are often forced to reason about infrastructure when they should be focused on application behaviour.
Metrics exist to describe systems, but without the right level of abstraction, they become another layer of complexity.
This is where modern PaaS platforms change the equation. They don't remove metrics. Instead, they turn them into signals that developers can actually use.
This article breaks down five metrics that consistently matter in production systems. More importantly, it shows how a PaaS helps translate these metrics into something actionable, without requiring developers to act as infrastructure operators.
I’ll be using the Sevalla dashboard to explain these metrics, but other platforms like Railway and Render will have similar metrics.
What We'll Cover:
What a PaaS Actually Does
A Platform as a Service (PaaS) is an abstraction layer over infrastructure that handles deployment, scaling, networking, and runtime management for you.
Instead of provisioning servers, configuring load balancers, and setting up autoscaling rules, you deploy your application and the platform takes care of how it runs in production.
Platforms like Sevalla, Railway, and Render operate on this model. The key shift is responsibility.
In a traditional setup, developers are responsible for both application behaviour and infrastructure behaviour. If latency spikes or errors increase, you have to determine whether the issue is in your code, your scaling rules, or the underlying system.
A PaaS moves most of that infrastructure responsibility into the platform.
You still get access to metrics, but many of the variables behind those metrics –instance lifecycle, scaling decisions, resource allocation – are handled automatically.
This changes how you interpret what you see.
Metrics stop being signals that require cross-layer investigation, and start becoming signals that map more directly to application behaviour.
Now let's see what can happen if your team switches to using a PaaS.
Latency Becomes a Clear Performance Signal
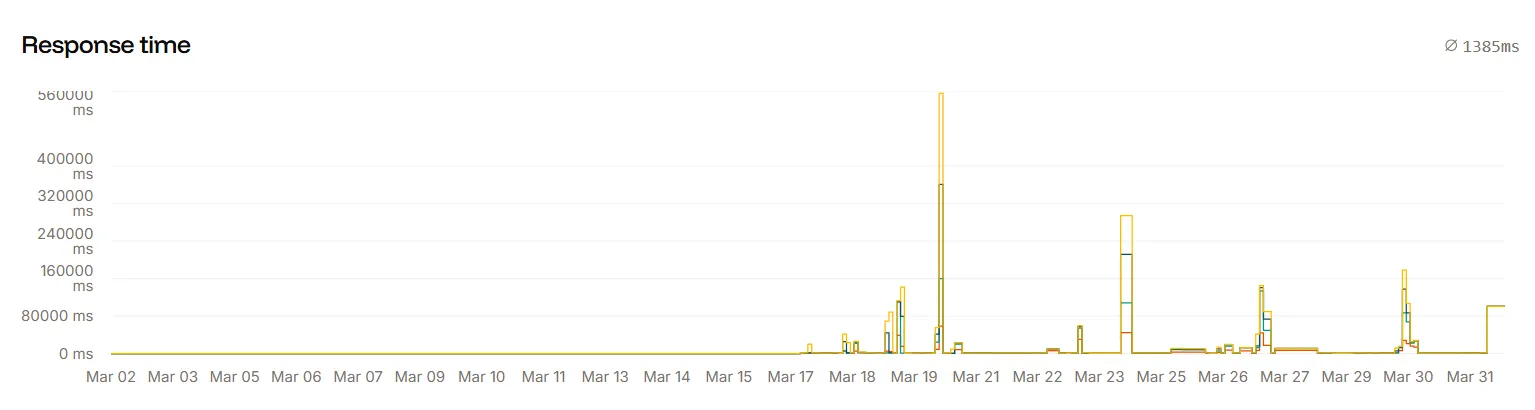
Latency is the most direct representation of user experience. It tells you how long your system takes to respond.
When latency increases, users feel it immediately. Pages slow down. APIs become unreliable. Even small delays impact engagement.
Most developers know to look at percentiles like p95 or p99 instead of averages. The slowest requests are what define perceived performance.
But in many environments, understanding latency isn't straightforward.
A spike could come from inefficient code. Or from cold starts. Or from scaling delays. Or from network routing issues. Developers are forced to investigate layers they didn't build.
This is where a PaaS changes the role of latency.
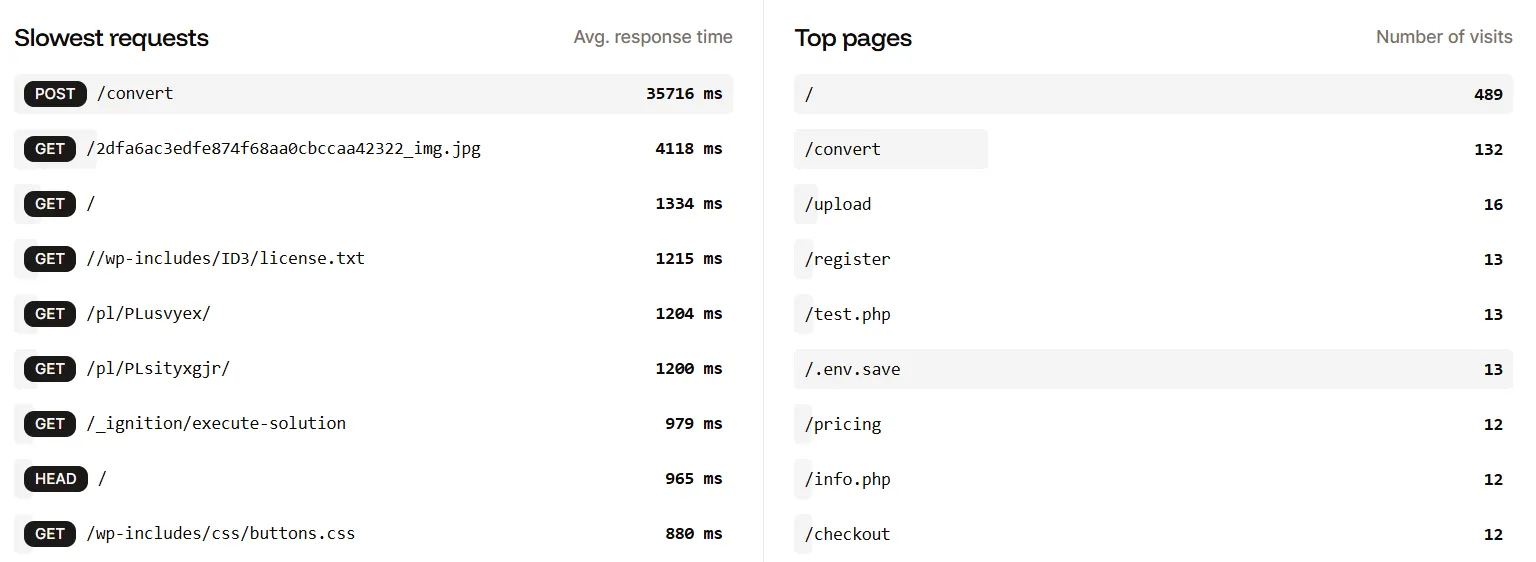
Instead of being a starting point for infrastructure debugging, latency becomes a clean signal of application performance. Scaling, routing, and resource allocation are handled by the platform. What remains is a clearer relationship between code and outcome.
When latency increases, developers can focus on what they actually control: queries, logic, and dependencies.
The metric stays the same. The meaning becomes clearer.
Error Rate Becomes a Reliable Indicator of Failure
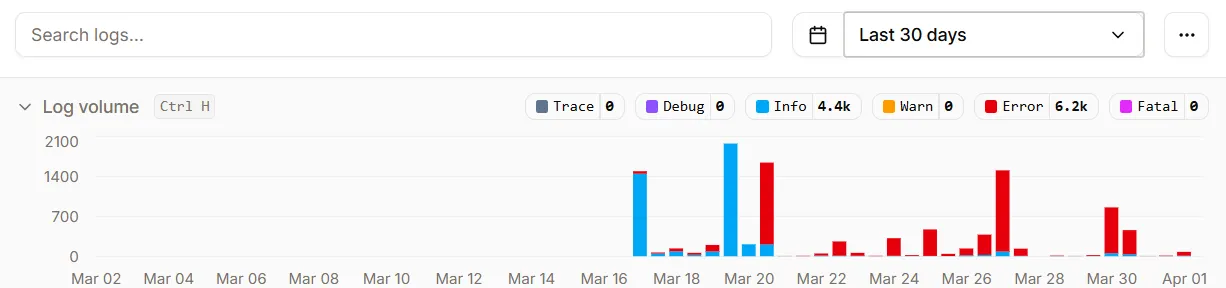
Error rate answers a simple question. Is the system working or not?
It's usually measured as the percentage of requests that fail due to server-side issues. These are failures users can't recover from. A broken checkout flow or a failed API call directly impacts trust.
In theory, error rate should be one of the easiest metrics to act on. In practice, it rarely is.
Errors can come from application bugs, but also from timeouts, resource limits, failed deployments, or unstable instances. Developers end up correlating errors with infrastructure events just to understand what happened.
This slows everything down.
A PaaS reduces this ambiguity.
Failures caused by scaling, instance crashes, or transient infrastructure issues are handled at the platform level. Retries, isolation, and recovery mechanisms are built in.
What remains is a tighter link between error rate and application correctness.
When the error rate increases, it's far more likely to be something in the code or a dependency, not an invisible infrastructure issue.
This shifts the error rate from a noisy metric into a reliable signal.
Throughput Becomes Context Instead of a Problem
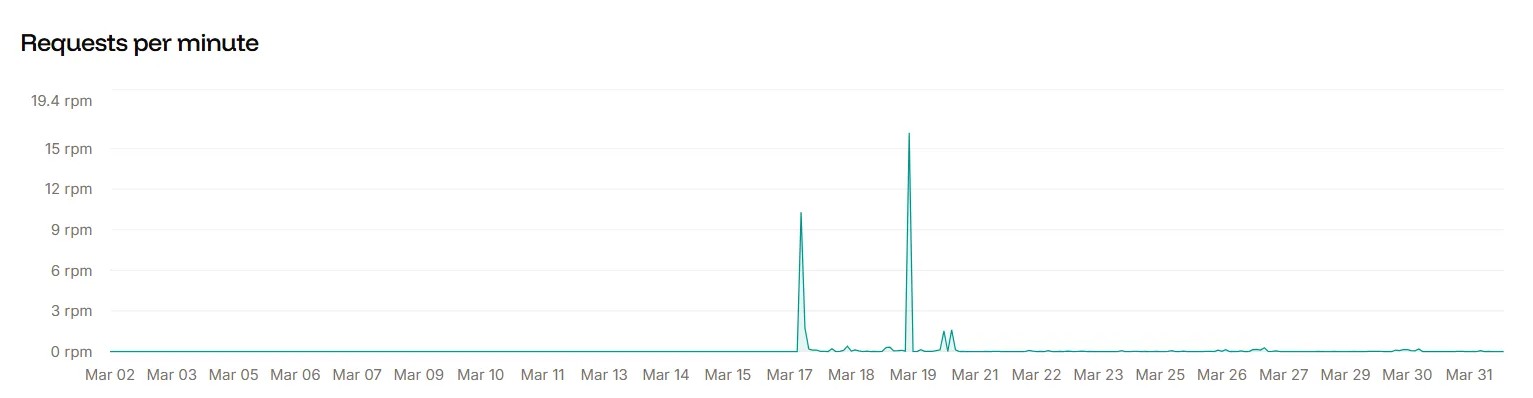
Throughput measures how many requests your system handles over time.
It provides context for everything else. Latency and error rate only make sense when you know how much traffic the system is handling.
A spike in latency during high traffic is expected. The same spike during low traffic is a warning sign.
But in many systems, throughput introduces operational complexity. Traffic changes require scaling decisions. Teams define autoscaling rules, tune thresholds, and try to predict demand. When things go wrong, they revisit those decisions.
Developers end up thinking about capacity instead of behaviour.
A PaaS shifts this responsibility. Scaling is automatic. Traffic spikes are absorbed by the platform. Developers don't need to decide how many instances should be running or when to scale.
Throughput becomes what it should be: context.
It helps explain what's happening, without forcing developers to manage how the system adapts.
Resource Utilisation Moves Out of the Critical Path
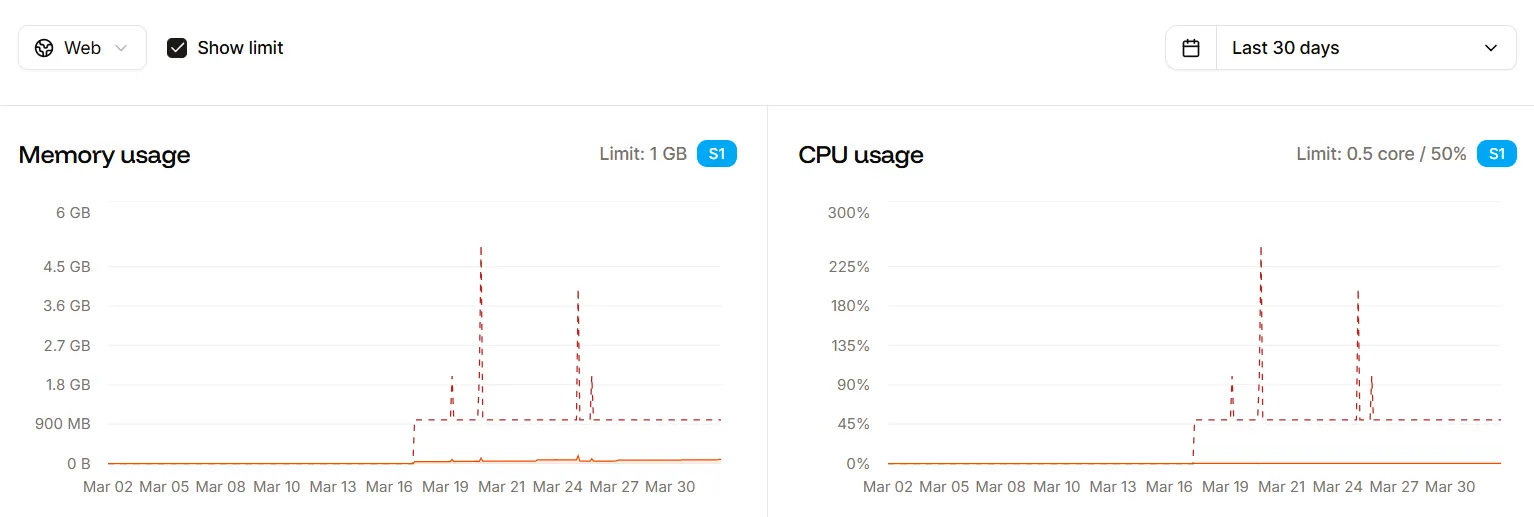
Resource utilization measures how much CPU, memory, and I/O your system consumes.
Traditionally, this has been central to operating systems. High CPU or memory usage signals potential issues. Teams monitor these metrics to avoid failures and plan scaling.
But for most developers, resource utilization isn't where value is created.
Yet in many environments, developers are still responsible for interpreting these signals. They tune memory limits, investigate CPU spikes, and try to optimise resource usage to keep systems stable.
This is operational work.
A PaaS changes the role of these metrics.
Resource management is handled by the platform. Allocation, scaling, and isolation happen automatically. Developers don't need to constantly watch CPU graphs or memory charts to keep the system running.
These metrics still exist, but they move into the background.
They become diagnostic tools rather than primary signals.
Developers can focus on performance at the application level, instead of managing how infrastructure behaves under load.
Instance Health Becomes Invisible by Design
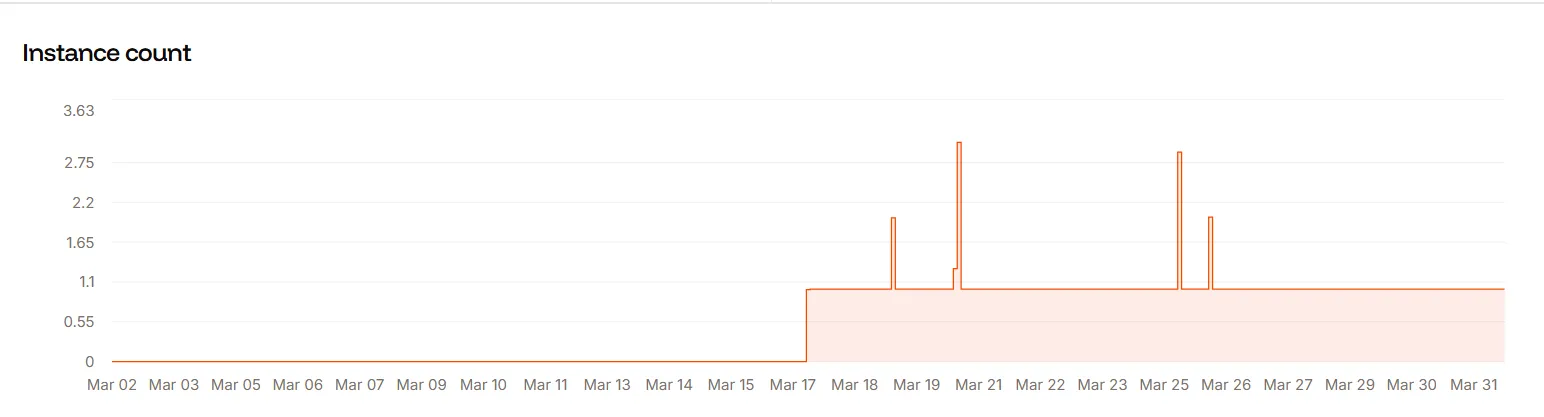
Instance health tracks restarts, crashes, and lifecycle events.
In many systems, this is a critical metric. Frequent restarts indicate instability. Memory leaks, crashes, or resource exhaustion often show up here first.
Teams monitor instance health to catch issues early and prevent cascading failures.
But this also reveals something important: developers are aware of, and responsible for, the lifecycle of infrastructure. They track restarts, investigate crashes, and try to stabilise the system manually.
A PaaS removes this responsibility.
Unhealthy instances are restarted automatically. Load is redistributed. Capacity is maintained without manual intervention.
Instance health doesn't disappear, but it no longer requires constant attention. It becomes part of the platform’s internal behaviour, not something developers need to actively manage.
These five metrics haven't changed.
Latency still reflects performance. Error rate still reflects correctness. Throughput still reflects demand. Resource utilization still reflects efficiency. Instance health still reflects stability.
What changes is how much work it takes to interpret them.
In lower-level environments, developers have to connect these signals themselves. A latency spike leads to checking throughput, then resource usage, then instance behaviour. Each step requires context, assumptions, and time.
This is where complexity accumulates.
A PaaS reduces that gap.
It handles scaling, recovery, and resource management so that metrics map more directly to application behaviour. The signals become easier to interpret because fewer variables are exposed.
Instead of asking multiple questions across layers, developers can move more directly from symptom to cause.
Why This Matters for Developers
Most developers don't want to manage infrastructure. They want to build features, ship improvements, and respond to user needs.
But as systems grow, operational responsibility expands. Monitoring becomes more complex. Debugging requires more context. A significant portion of time shifts from building to maintaining.
Metrics are part of this shift.
They're necessary, but they also reflect how much of the system you're responsible for understanding.
A PaaS doesn't eliminate metrics. It reduces the effort required to make sense of them.
It ensures that when something changes in production, the signals developers see are closer to the reality they care about: application behaviour. User experience. System correctness.
The Real Advantage Is Clarity
The goal is not to have fewer metrics.
It's to have metrics that mean something without requiring deep infrastructure reasoning.
These five metrics form a complete picture of system health. But their real value depends on how directly they map to what developers control.
The more layers you have to think about, the harder mapping becomes.
A good PaaS removes those layers. It turns metrics from raw data into usable signals.
And that shift from metrics to meaning is what allows developers to understand production systems without being buried under them.
Join my Applied AI newsletter to learn how to build and ship real AI systems. Practical projects, production-ready code, and direct Q&A. You can also connect with me on LinkedIn.
Learn to code for free. freeCodeCamp's open source curriculum has helped more than 40,000 people get jobs as developers. Get started