At VTEX, our admin ecosystem hosts dozens of applications for our customers to manage their ecommerce operations, from order management to pricing and shipping. Each team maintains both front and backend applications to ensure that our users easily navigate each flow.
In that context, the Marketplace Team handles several frontend apps that allow store managers to configure their connections and manage their SKUs to internal VTEX stores and external integrations. In 2024, one of our objectives was to deploy a new solution to retire an outdated one.
Based on that premise, we wanted to be able to track user events on the existing and new apps, monitor their behavior, and report usage success to our product and leadership teams.
At the time, no standard solution was available. We had several teams doing business metrics using Google Analytics, Hotjar, Amplitude, etc.
This led us to wonder if we could have a go-to system that frontend software engineers could use in existing and newly built apps to track views, clicks, API responses, and more.
After investigation among several teams, we decided to use our existing internal tool and push data to our Analytics Data Platform. This centralizes the metrics management to one place, simplifies maintenance, allows for clear cost control, and prevents the spread of external resources.
At VTEX, we use Amazon Web Services extensively, and it provides two important systems for what we wanted to achieve: Redshift for data storage and QuickSight for data visualization.
The idea here is to use a schemaless event API so that every application can send its data, given its context and requirements. Of course, some basic data, such as views and clicks, are common.
Most of our apps are React-based, so we created a simple custom hook called wherever needed, like a page for a view event, a component for click events, a service for API answer events, etc. The date and time information is automatically handled in Redshift, so there is no need to worry about this.
We use Typescript to apply typings to the events, and each one must have a unique name and a category:
export interface DataIngestionApiFields {
  event_category?: 'click' | 'view' | 'apiAnswer' | 'webVitals'
  event_name: string
  metric?: ReportWebVitalsMetric
  time_on_page?: number
}
One important detail here is to track the names of those events in a document so that developers and other team members can access this information in the future. A simple sheet with name, description, category, and maybe an observation is fine. Try to remove yourself from the equation. Tomorrow, a member of the product team might want to build a dashboard directly on QuickSight without bothering a developer.
Back to the technical side.
The usage of the hook and its function is quite simple:
useEffect(() => {
 sendEvent({
   event_category: 'view',
   event_name: 'index-page',
 })
}, [])
Or for a click on an element:
<button
 onClick={() => {
   sendEvent({
     event_name: 'unique-name',
   })
 }}
>
When sendEvent is called, it runs through a little function that automatically adds extra information like accountName, locale, production, and device. This is useful for building dashboards and applying filters.
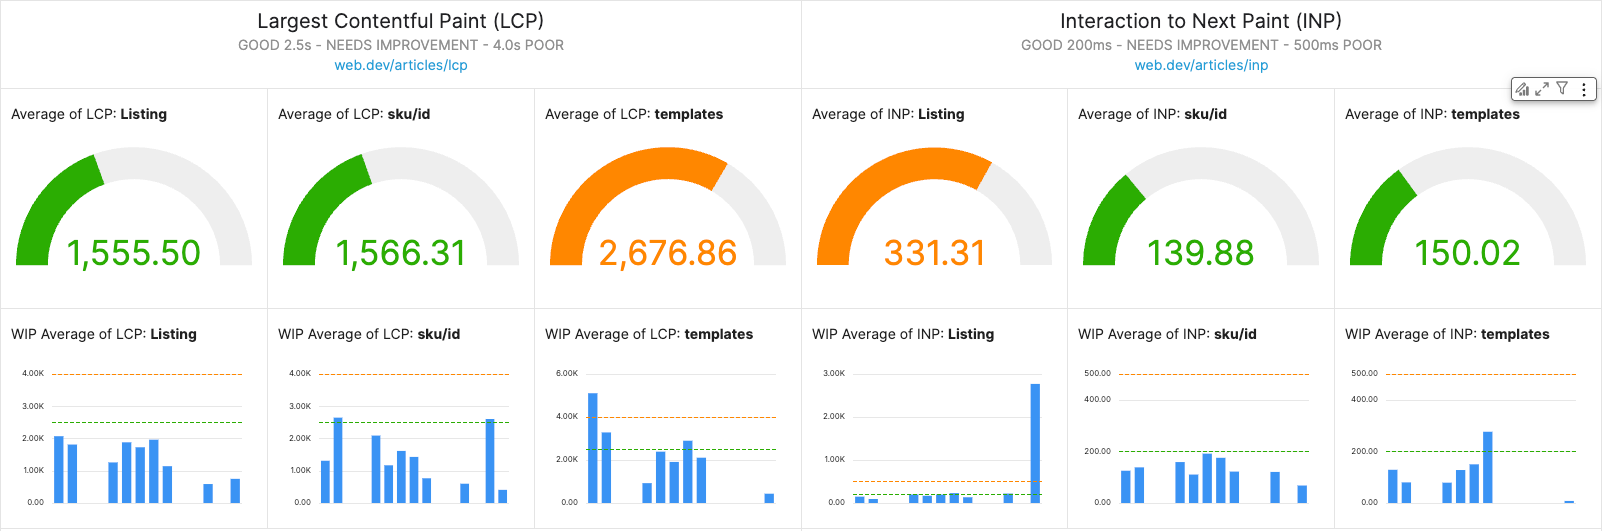
We also send Web Vitals events using the lib next/web-vitals and its hook useReportWebVitals on NextJS-based apps.
Example in a file _app.tsx:
useReportWebVitals((metric) => {
 sendEvent({
   event_category: 'webVitals',
   event_name: `webvitals_${router.route}`,
   metric,
 })
})
Finally, we send apiAnswer events so that we can measure the conversion rate of our frontend applications:
sendEvent({
 event_category: 'apiAnswer',
 event_name: `api-call-prefix-${response.status}`,
})
Once our events are sent and stored, it is time to use them via AWS QuickSight. Since we send schemaless events, a special step is required to extract our data stored in a SUPER field. Otherwise, QuickSight cannot read the data.
We create a simple query when creating a dataset:
SELECT
    Ingestion_time,
    payload.name::varchar,
    payload.account::varchar,
    payload.production::varchar,
    payload.event_name::varchar,
    payload.event_category::varchar
FROM
    "my"."schemaless"."database"
After verification, we can head to the visualization part.
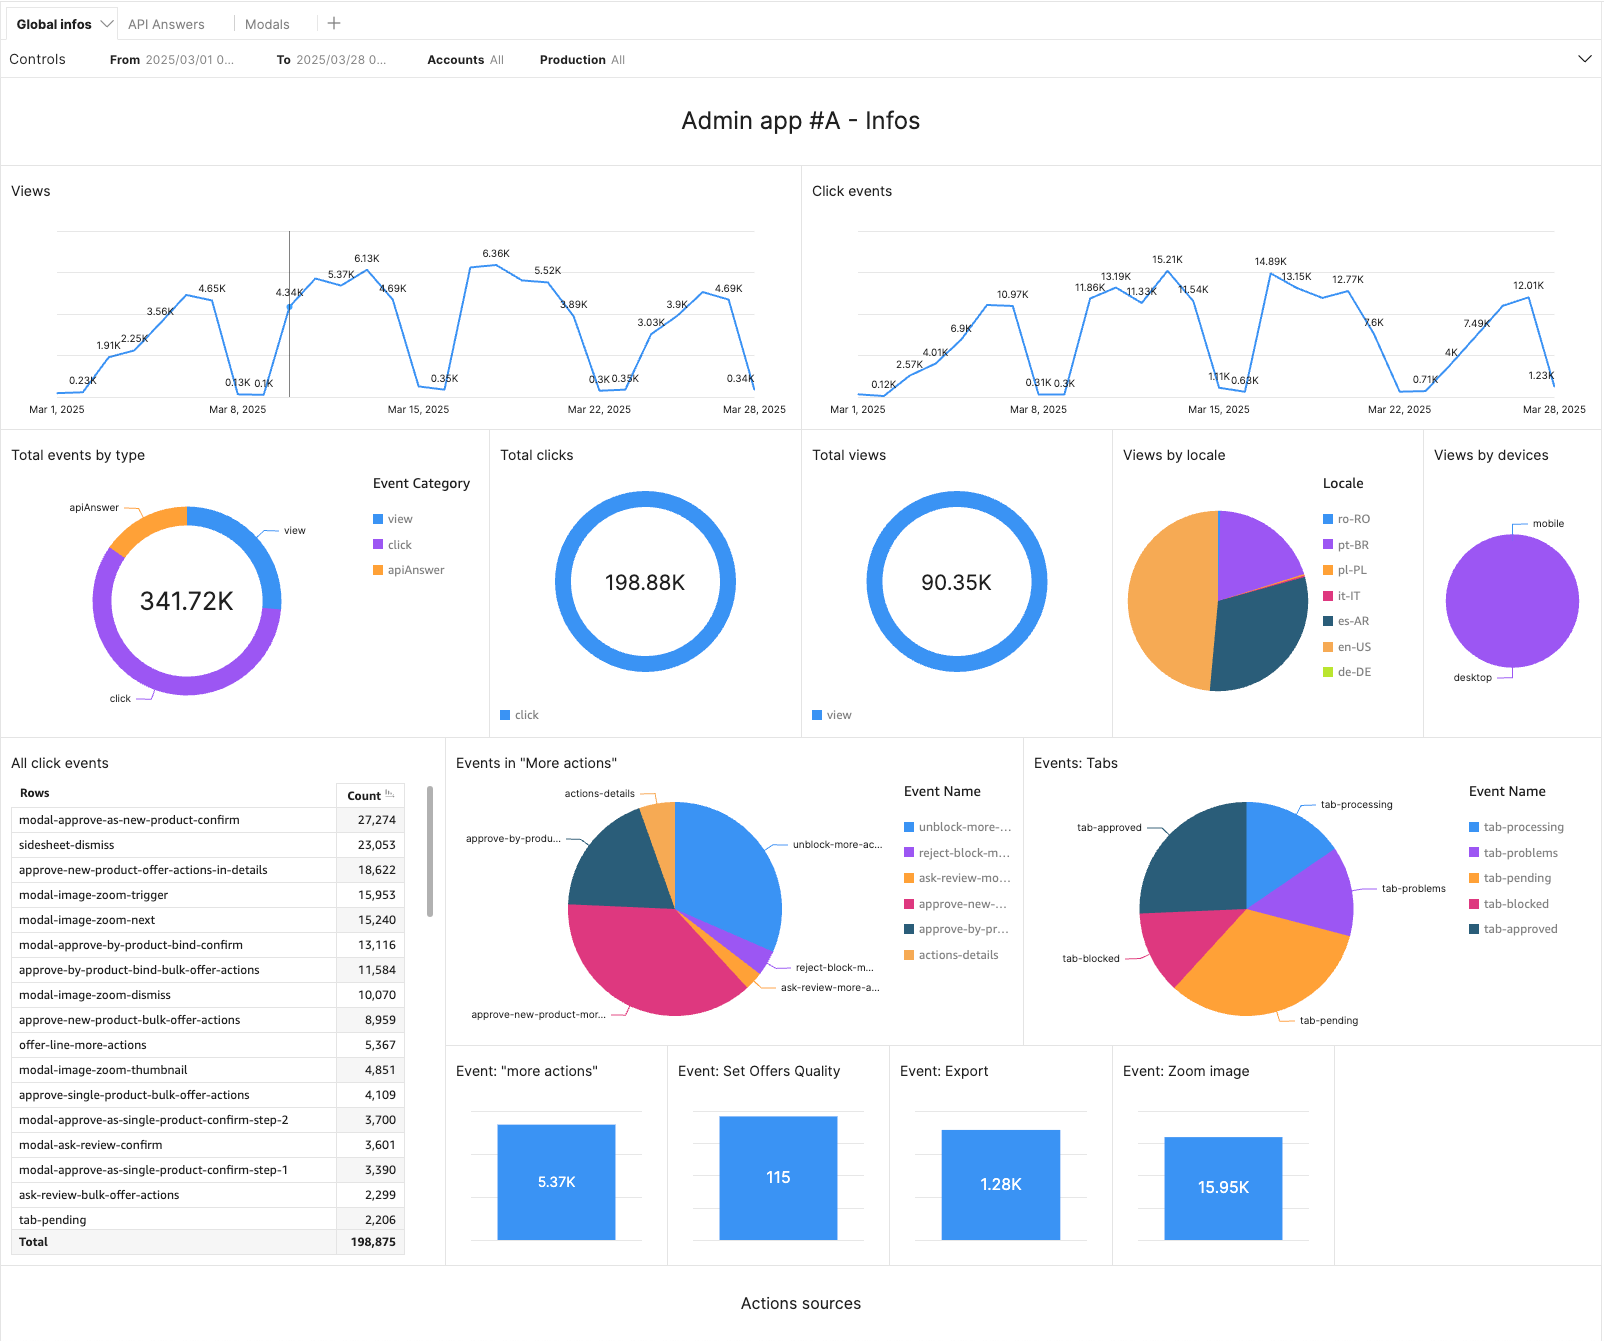
We usually start with two visuals to monitor global views and clicks over time and, if applicable, display extra charts right below to detail the views and events.
Each app is specific, so we do not have two similar dashboards. That said, we keep some consistency so our readers can use them. Line, bar, or pie charts have the same appearance, and we created a VTEX theme to apply styles globally.
One very interesting feature is that we can call data from multiple datasets per dashboard. This is great for creating a side by side views for two apps or more:
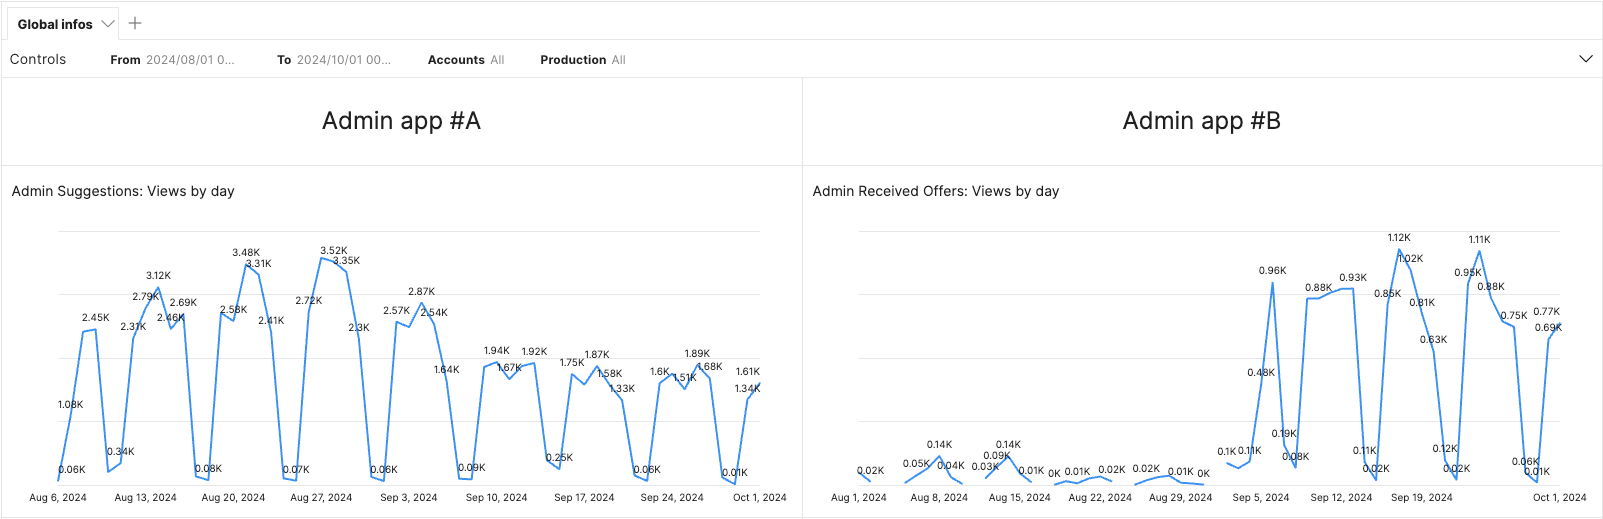
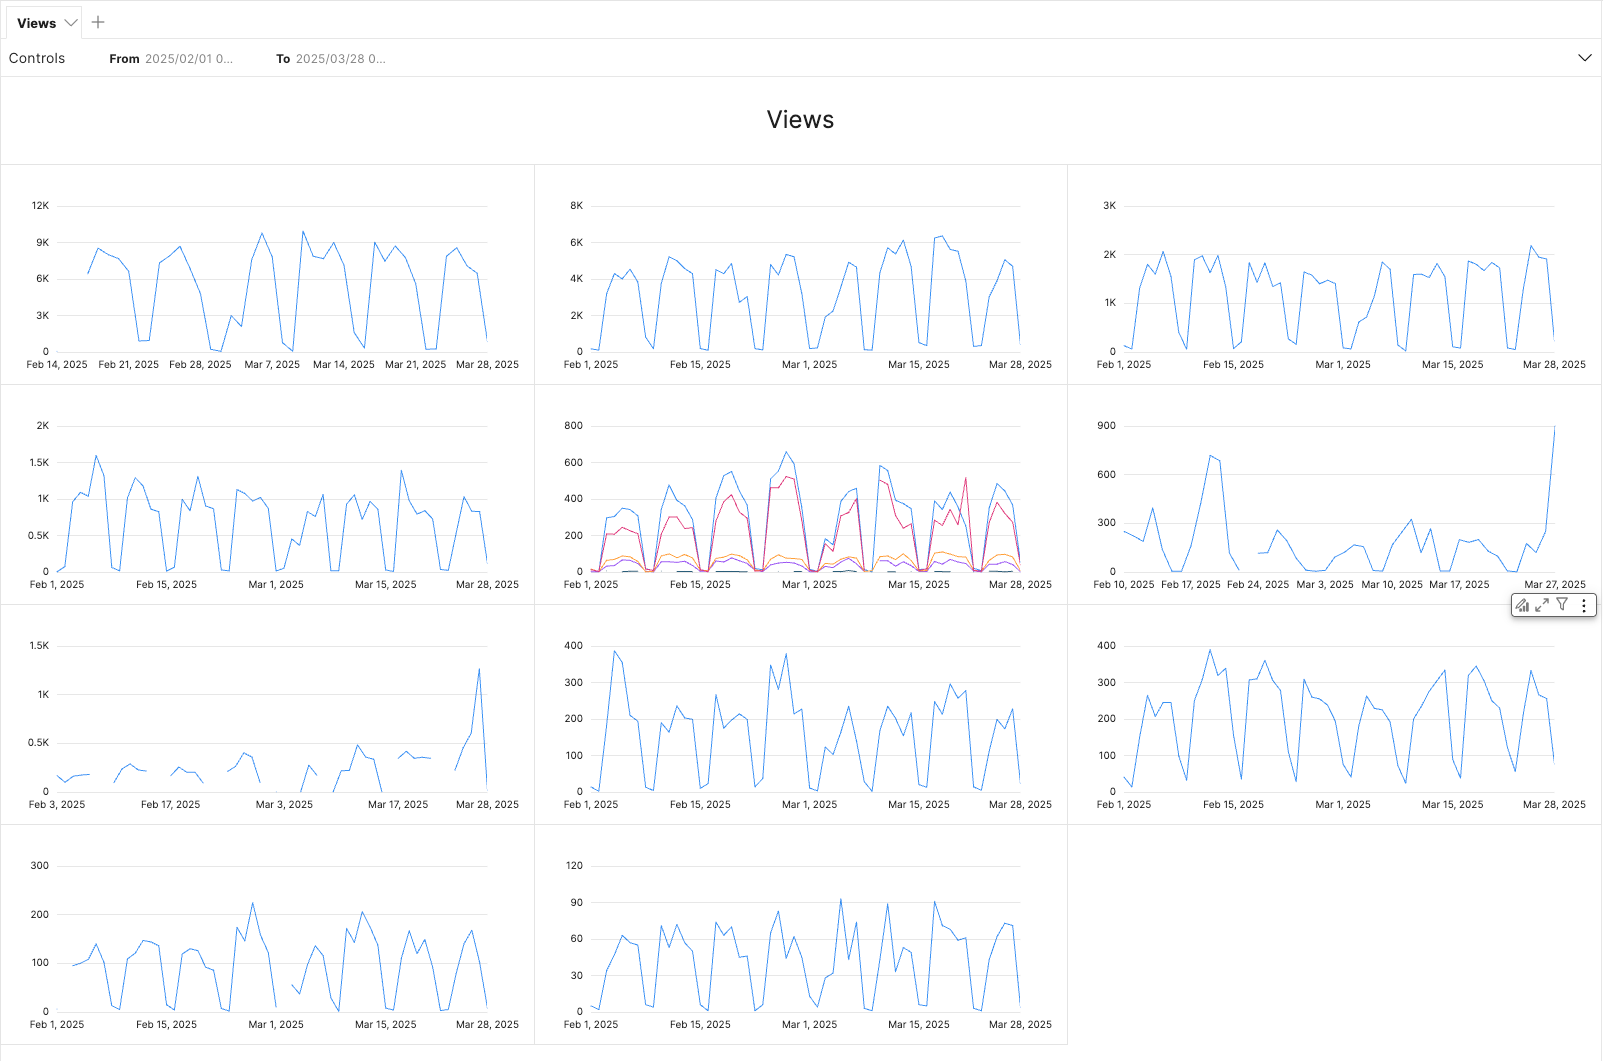
It also allows us to have one global dashboard to see many apps at once:
Example of Web Vitals monitoring:
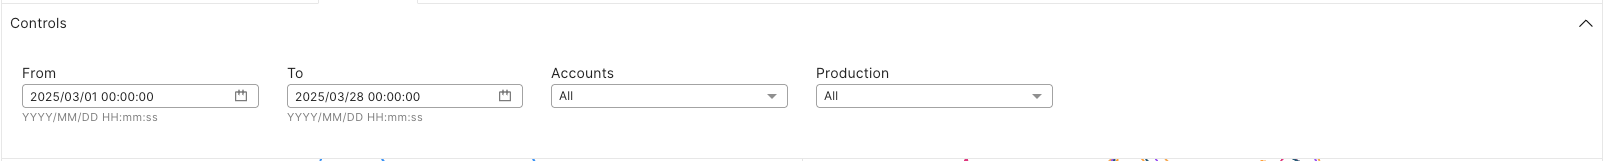
We filter by dates, from and to, account names, and production mode between beta and stable. We apply filters between datasets and add tabs to organize the pages. The possibilities are endless.
We are also experimenting with metrics to track the time users take to complete a specific action, modal actions, image sliders, locale usages, and devices, among other things.
For now, we are gathering data to be able to make decisions in the near future and be able to show that updates to the apps have indeed a positive impact. It could even lead to a negative impact, which we will be able to address asap as we monitor clearly our apps.
We also plan to bring version control into the metrics and A/B testing to see differences between versions.
For frontend software engineers, this is a great way to monitor and work with UX designers and product teams to improve our applications and users' daily tasks. It also allows us to showcase our work on a different level and not only rely on backend metrics.
Today, we track dozens of apps within the Marketplace team and demo this work to encourage other products to adopt the tools. We also made this the official solution for one of the pillars of the Frontend Golden Path we are building at VTEX: Business Metrics.
此内容由惯性聚合(RSS阅读器)自动聚合整理,仅供阅读参考。 原文来自 — 版权归原作者所有。