Customers across the globe are increasingly adopting Amazon Elastic Kubernetes Service (Amazon EKS) to run their Windows workloads. This is a result of customers figuring out that refactoring existing Windows-based applications into an open-source environment, while ideal, is a very complex task. It needs investments that usually don’t immediately translate into cost savings, and investing in this application refactoring isn’t in the best interest for the IT yearly budget. However, re-platforming the existing yet critical Windows-based applications into Windows containers makes sense from a cost-saving and modernization lens.
Tools such as App2Container (A2C) have made application re-platforming easy. However, for successful day two operations, customers should consider certain infra-transformations, such as logging, monitoring, tracing, etc. As part of achieving full Windows containers observability on AWS, in 2022 we published a Containers post on how customers can use an AWS-managed Windows fluent-bit container image to centralize Windows pods log in different destinations.
Prometheus and Grafana are some of the most popular monitoring stacks for Kubernetes-based workloads. Therefore, today we are launching a post focusing on how customers can centralize Windows pod metrics using Amazon Managed Service for Prometheus and Amazon Managed Grafana.
This post walks you through how to set up Windows Exporter (A Prometheus exporter for Windows) as a Kubernetes daemonset and a PromQL (Prometheus Query Language) to enrich windows-exporter container metrics while merging with kube-state-metrics (KSM). This lets you extend existing Linux-based Kubernetes monitoring to support Windows-based workloads.
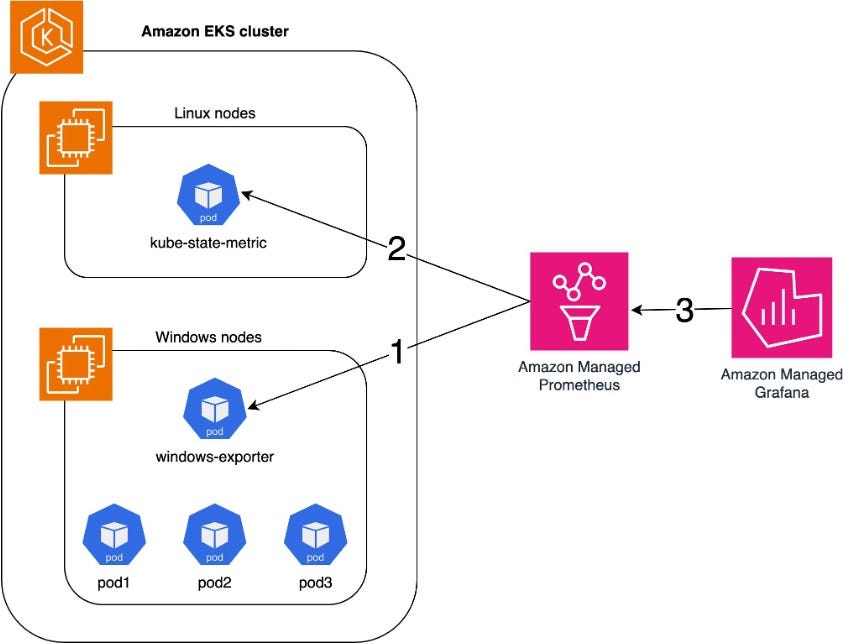
Amazon Managed Service for Prometheus scrapes Windows node/container metrics, such as CPU, Memory, Disk, and Network usage from the Windows Exporter HostProcess DaemonSet.
Amazon Managed Service for Prometheus scrapes KSM to map pod and container names to their container ID.
Amazon Managed Grafana provides the ability to create monitoring dashboards from the collected metrics using Amazon Managed Service for Prometheus as the data source.
The following prerequisites are required to continue with this post:
An Amazon EKS cluster with Windows nodes up and running. See this step-by-step
Amazon Managed Service for Prometheus with Amazon EKS ingestion properly setup. See this step-by-step
Amazon Managed Grafana fully integrated with Amazon Managed Service for Prometheus. See this step-by-step
This post’s prerequisites use AWS-managed services such as Amazon Managed Service for Prometheus with managed-collector and Amazon Managed Grafana. However, this post also applies to self-managed Prometheus, Grafana, and ADOT/Prom-server agents.
The following steps walk you through the steps described previously.
We now install KSM, a simple service that listens to the Kubernetes API server and generates metrics about the state of the objects. We must collect KSM to map pod and container names to their container ID.
1.1 Enter the following command to install KSM:
helm repo add prometheus-community https://prometheus-community.github.io/helm-charts

helm install kube-state-metrics prometheus-community/kube-state-metrics -n kube-system
First, going deep into the daemonset configuration, we are setting up the securityContext to hostProcess:True. This means the container process has access to the host network namespace, storage, and devices, allowing us to fetch metrics for all the containers running at the host by listening to built-in Windows metrics.
The second part is the initContainer, where we set up the host firewall to allow TCP/9182 incoming traffic so that Amazon Managed Service for Prometheus can scrape the host. In the third part, we create a ConfigMap to inject windows-exporter configurations and mount it to the Windows-exporter pod.
2.1 Create a file containing the following code and save it as windows-exporter.yaml:
If you have any taints in the Windows nodes, then make sure you add the tolerations in the Daemonset configuration.
kind: Namespace
apiVersion: v1
metadata:
  name: windows-monitoring
  labels:
    name: windows-monitoring
---
kind: DaemonSet
apiVersion: apps/v1
metadata:
  name: windows-exporter
  namespace: windows-monitoring
  labels:
    app: windows-exporter
spec:
  selector:
    matchLabels:
      app: windows-exporter
  template:
    metadata:
      labels:
        app: windows-exporter
      annotations:
        prometheus.io/scrape: "true"
        prometheus.io/scheme: http
        prometheus.io/path: "/metrics"
        prometheus.io/port: "9182"
    spec:
      securityContext:
        windowsOptions:
          hostProcess: true
          runAsUserName: "NT AUTHORITY\\system"
      hostNetwork: true
      initContainers:
        - name: configure-firewall
          image: mcr.microsoft.com/powershell:lts-nanoserver-1809
          command: ["powershell"]
          args: ["New-NetFirewallRule", "-DisplayName", "'windows-exporter'", "-Direction", "inbound", "-Profile", "Any", "-Action", "Allow", "-LocalPort", "9182", "-Protocol", "TCP"]
      containers:
      - args:
        - --config.file=%CONTAINER_SANDBOX_MOUNT_POINT%/config.yml
        name: windows-exporter
        image: ghcr.io/prometheus-community/windows-exporter:latest
        imagePullPolicy: Always
        ports:
        - containerPort: 9182
          hostPort: 9182
          name: http
        volumeMounts:
        - name:  windows-exporter-config
          mountPath: /config.yml
          subPath: config.yml
      nodeSelector:
        kubernetes.io/os: windows
      volumes:
      - name: windows-exporter-config
        configMap:
          name: windows-exporter-config
---
kind: ConfigMap
apiVersion: v1
metadata:
  name: windows-exporter-config
  namespace: windows-monitoring
  labels:
    app: windows-exporter
data:
  config.yml: |
    collectors:
      enabled: '[defaults],container'
    collector:
      service:
        services-where: "Name='containerd' or Name='kubelet'"
This solution uses a public, open-source Prometheus container image. It is your responsibility to perform security due diligence.
2.2 Create the Kubernetes Namespace, Daemonset and ConfigMap. Enter the following command:
kubectl create -f windows-exporter.yaml2.3 Check if the Daemonset pods are running. Enter the following command:
kubectl get pods -n windows-monitoring2.4 Once the pods are in the running status, you can check if they are accepting connections on port 9182. Enter the following command:
kubectl logs windows-exporter-pod-name -n windows-monitoring2.5 You should see the windows-exporter pod listening on port 9182, which is the one that is scrapped by Amazon Managed Service for Prometheus.
ts=2024-01-30T00:03:22.226Z caller=tls_config.go:313 level=info msg="Listening on" address=[::]:9182Assuming you already have Grafana knowledge, you can create panels that are relevant for your day two operation. In the following, you can find PromQL queries that automatically bring the correct data scrapped by Prometheus, merging Windows container metrics and mapping to its pod. We are setting the query to populate new data every two minutes.
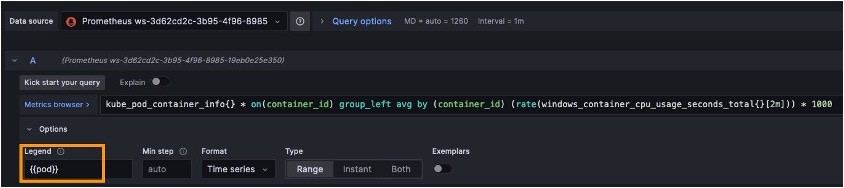
Make sure you are selecting the right data source when creating panels. In this post, we are using Amazon Managed Service for Prometheus as a data source.
Check the Windows Exporter GitHub repository for a complete list of exported Windows container metrics.
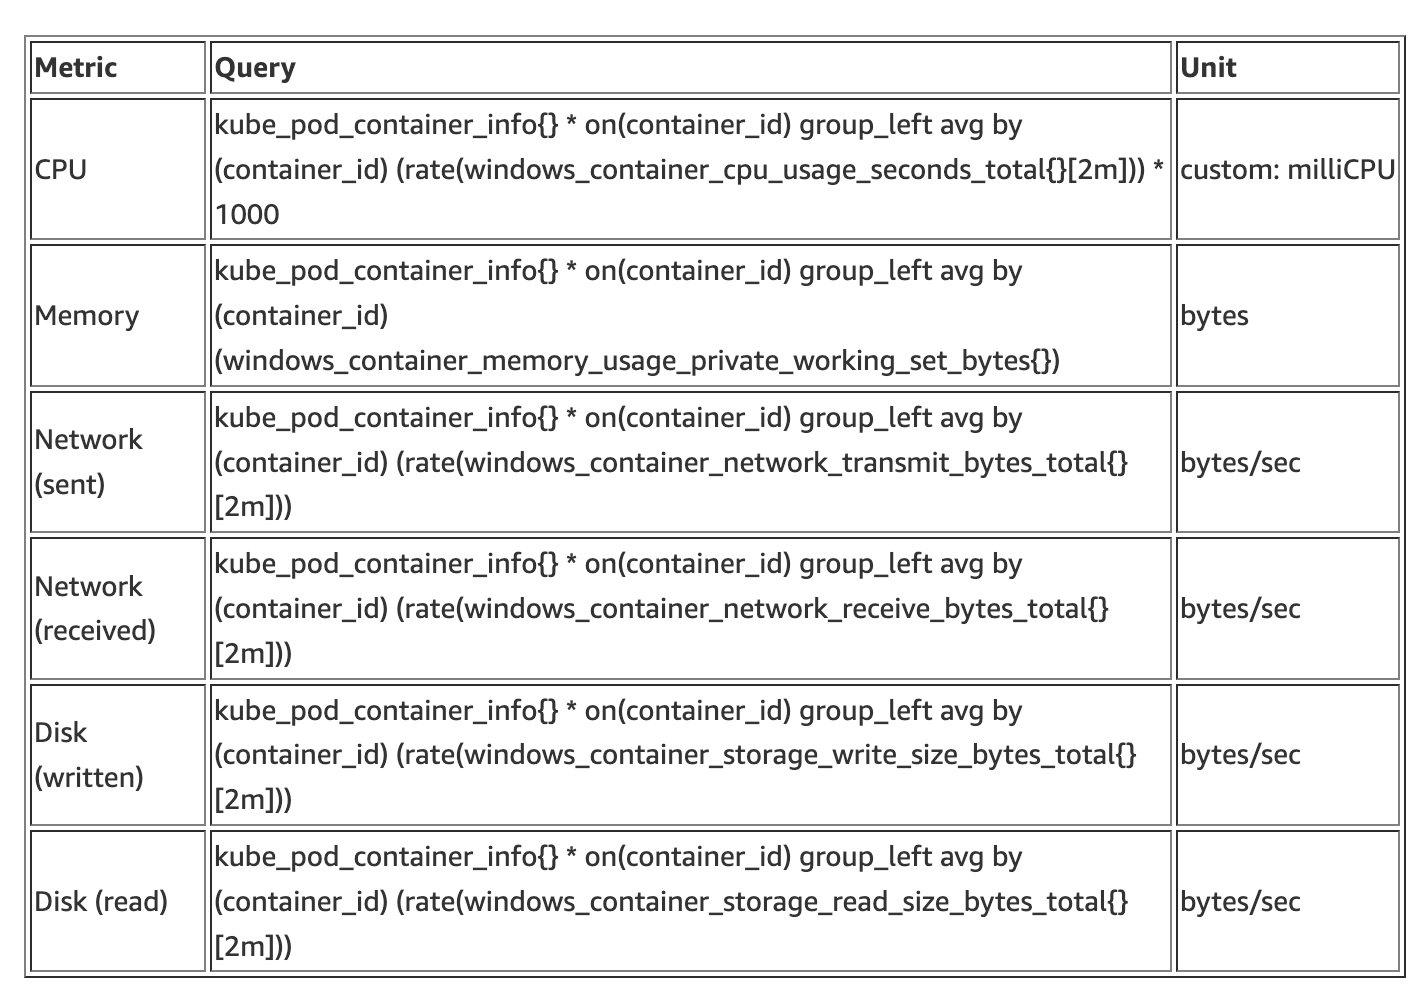
For example, in the following query, we filter the total CPU usage percentage per second at the pod level. To do so, you need to create a custom legend with the value pod. Furthermore, it is essential to set the Units in the panel to the ones in the following table.
The milliCPU query generates the following panel:
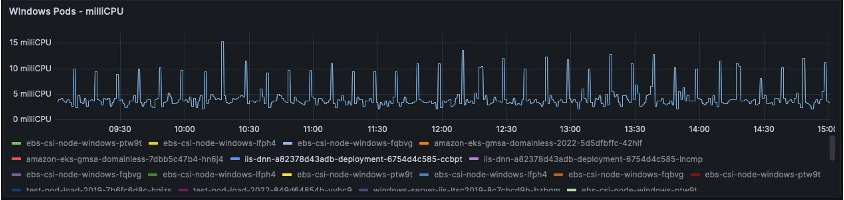
The CPU Query measures Kubernetes CPU Unit usage per second multiplied by 1000 to match Kubernetes milliCPUss. This allows you to quickly and easily identify if a pod needs CPU limits/request right-sizing. A CPU second refers to one second on a CPU. This is the amount of time in seconds your CPU spends actively running a process, as opposed to the elapsed time.
Nonetheless, visualizing Windows nodes metrics is crucial as Windows pods metrics. In the following table, you can find PromQL queries that automatically bring the correct data scrapped by Prometheus per Windows nodes. We are setting the query to populate new data every two minutes.
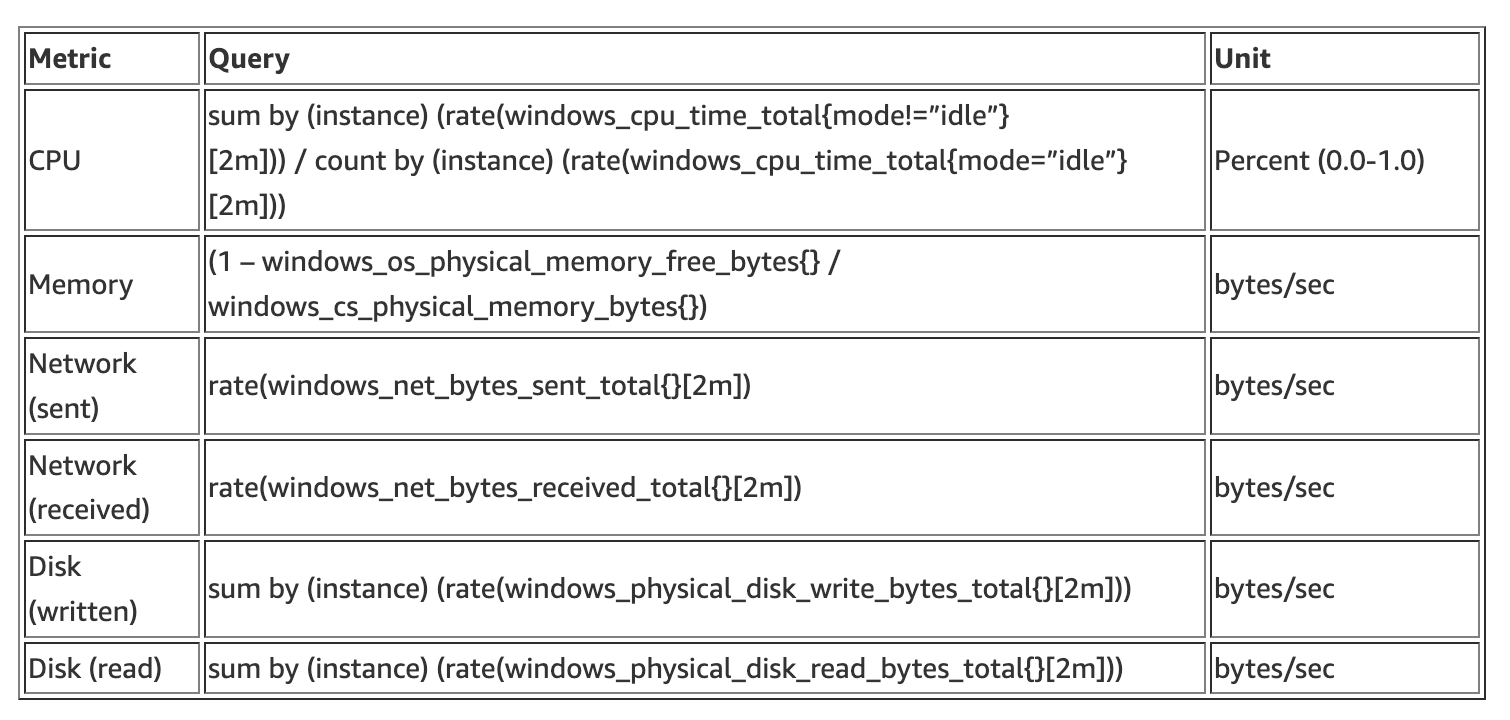
Check the Windows Exporter GitHub repository for a complete list of Windows nodes metrics exported.
For example, in the following query, we are filtering the total CPU usage percentage per second at the pod level. To do so, you must create a custom legend with the value node. Furthermore, it is essential to set the Units in the panel to the ones in the preceding table.
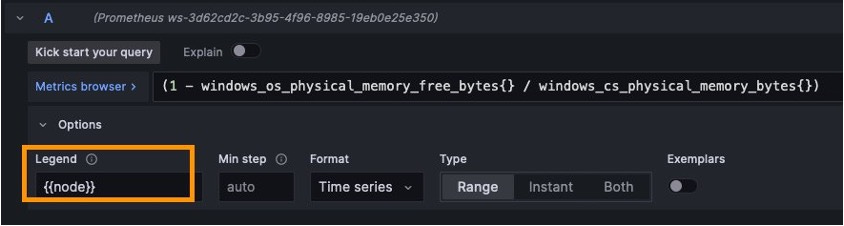
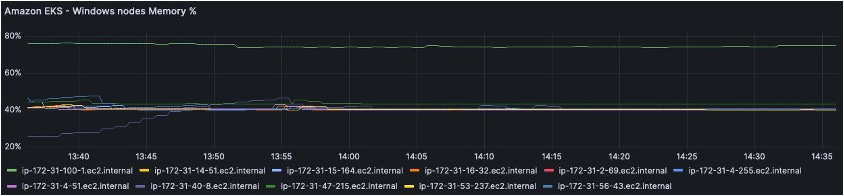
The Memory query generates the following panel:
This post covered how to successfully deploy Windows Exporter as a daemonset using a hostProcess container mode. Then, we covered which Windows and KSM should be used to have a proper Grafana monitoring dashboard. You can also use these metrics to create additional panels to an existing Grafana dashboard, such as when an Amazon EKS with a mixed data plane is deployed.
In addition, see the best practices for running Windows containers on Amazon EKS in the Amazon EKS Best Practice guide.
This article was produced in collaboration with AWS. Original post co-written with Alberto Frocht
此内容由惯性聚合(RSS阅读器)自动聚合整理,仅供阅读参考。 原文来自 — 版权归原作者所有。