I've spent the last decade-plus designing IoT tracker hardware and protocol payloads for logistics, fleet, and cold chain customers across more than a hundred countries. There's a pattern that shows up in roughly half the architecture reviews I sit in: a customer believes they have real-time visibility, the dashboard agrees with them, and the actual telemetry pipeline does not.
This post is the developer-side breakdown of that gap. I'll walk through the visibility maturity ladder I use, the firmware and payload schema decisions that push you up a rung, and what the L2-to-L3 transition actually looks like at the protocol layer. If you're scoping a tracker fleet or working on the ingest side of one, the trade-offs below are the ones that will haunt you in production.
What Are the Five Levels of Supply Chain Visibility?
Supply chain visibility is the operational ability to observe, monitor, and act on what is happening to goods in transit. Practitioners — including the framework I use across architecture reviews, and largely echoing how Gartner has framed logistics maturity for years — break it into five distinct rungs, each defined by what kind of question the underlying telemetry can actually answer in real time:
- Milestone Notifications — discrete carrier events from EDI ("picked up", "delivered"). Retrospective.
- Reactive Tracking — periodic GPS pings (60–120 min interval). Last-known-position dashboard. Stale by design.
- Real-Time Monitoring — continuous position from per-asset trackers, dynamic ETAs, exception alerts in minutes.
- Conditional Visibility — location plus calibrated environmental sensors (temperature, humidity, shock, light, door) with audit-grade timestamps.
- Predictive Intelligence — anomaly detection, predicted disruptions, automated rerouting.
The interesting engineering happens between Level 2 and Level 3. Level 4 adds sensors and calibration discipline. Level 5 is mostly a data and decision-layer problem on top of L3+L4 telemetry.
Why Do Most Fleets Stall at Level 2?
The structural reason most fleets stall at L2 is that a Level 2 telemetry pipeline feeding a Level 3 user interface looks identical to a Level 3 system at a glance. The map renders. The status badges show colors. The connecting lines move when you refresh. The fact that the dots are stale by 90 minutes is invisible until something breaks.
The diagnostic question I keep asking ops teams:
If a temperature excursion happened on a pallet right now, who would know within the hour, and how?
If the answer involves the carrier, the receiving warehouse, or anyone noticing first who isn't your own monitoring stack, you're operating an L2 fleet with an L3 dashboard. The numbers behind this gap are blunt: McKinsey research with senior global supply chain executives found that only about half could describe the location and essential risks of their tier-one suppliers, and only two percent had any meaningful visibility beyond tier two.
The three concrete L2 patterns I see:
- Vehicle telematics only. GPS lives on the truck, not the cargo. Visibility ends at the cross-dock, the intermodal yard, the airline pallet — but the dashboard keeps showing the truck, so nobody notices.
- Hourly position pings to save battery. Trackers configured to TX every 60–120 minutes. Geofence breach detected on the next ping. Exceptions show up after the cargo is already past the customer's escalation window.
- Carrier-portal aggregation dashboards. Polished UI re-displaying EDI milestones. Level 1 data dressed up in an L3 user interface. The most common visibility theater I see, and the hardest to spot from the outside.
What Does L2 → L3 Look Like at the Protocol Layer?
The product pitch is "switch to a real-time platform." The engineering reality is three things you need in parallel: per-asset hardware, a defensible payload schema, and an ops team that can act on the alerts. The first two are what this section is about.
1. Per-asset cellular trackers, not vehicle GPS
The tracker has to ride with the cargo, which means battery-powered, multi-year standby, surviving multi-leg journeys without a charge cycle. The chipset class that makes this practical at scale is the modern LPWA cellular IoT family — Nordic's nRF9160 is the obvious reference design here, with multi-mode LTE-M / NB-IoT, integrated GNSS, and aggressive low-power modes.
The power profile matters more than the radio. A reasonable PSM/eDRX configuration for a fleet tracker on a cold chain lane:
// Minimal PSM + eDRX setup for nRF9160 (illustrative)
// PSM: TAU = 1 day, Active Time = 30s
// Allows ~24h sleep current ~3-5 µA between ping windows
const char *PSM_TAU      = "00100001"; // T3412 = 1 day
const char *PSM_ACTIVE   = "00000011"; // T3324 = 6s
const char *EDRX_LTE_M   = "0010";     // ~20.48s eDRX cycle when paged

AT_send("AT+CPSMS=1,,,\"" PSM_TAU "\",\"" PSM_ACTIVE "\"");
AT_send("AT+CEDRXS=2,4,\"" EDRX_LTE_M "\"");
Numbers I've seen in field tests with that kind of profile, on a CR123A-class battery pack and a one-position-per-15-min duty cycle: 18–36 months standby depending on coverage and how often the modem has to fall back from LTE-M to NB-IoT in marginal zones. Very rough rule of thumb: every order of magnitude reduction in TX cadence buys you roughly one order of magnitude in battery life.
2. A payload schema you can defend
This is the part that almost nobody plans for and almost everybody regrets. "Continuous monitoring" is not "ping more often." The payload has to survive being read by a regulator, an auditor, or a customer's lawyer three months after the fact, on a different system than the one that wrote it.
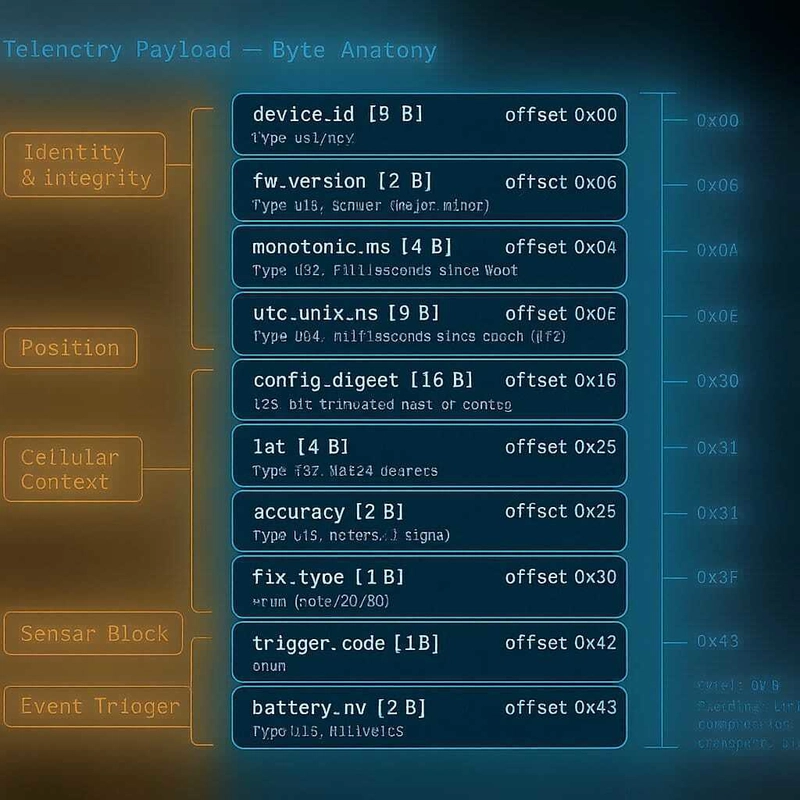
Concretely: stable field semantics, time-synchronized to a clock you trust, with enough metadata to reconstruct what the device knew at the moment it sent the message. The minimum I push customers toward looks something like this (Protobuf-style, JSON works fine too):
message TelemetryFrame {
  // Identity & integrity
  string  device_id        = 1;       // immutable hardware ID
  uint32  fw_version       = 2;       // firmware semver, packed
  uint64  monotonic_ms     = 3;       // device monotonic clock since boot
  int64   utc_unix_ms      = 4;       // GNSS-disciplined UTC, 0 if unknown
  uint32  config_digest    = 5;       // hash of active config blob

  // Position
  sint32  lat_e7           = 10;      // signed micro-degrees * 10
  sint32  lon_e7           = 11;
  uint32  hacc_cm          = 12;      // horizontal accuracy
  uint8   fix_type         = 13;      // 0 none, 2 2D, 3 3D, 4 dgps
  uint8   sat_count        = 14;

  // Cellular context (the field everyone forgets)
  uint16  mcc              = 20;
  uint16  mnc              = 21;
  uint32  cell_id          = 22;
  int8    rsrp_dbm         = 23;
  uint8   rat              = 24;      // 0 LTE-M, 1 NB-IoT

  // Sensor block (Level 4 territory)
  sint16  temp_c_e2        = 30;      // °C * 100
  uint16  humidity_pct_e2  = 31;
  uint16  shock_g_peak_e2  = 32;
  uint8   door_state       = 33;      // bitfield

  // Event reason (the field that makes payloads diagnosable)
  uint8   trigger          = 40;      // 0 timer, 1 movement, 2 geofence,
                                      // 3 threshold, 4 boot, 5 manual
  uint16  battery_mv       = 41;
}
The non-obvious fields are the ones that make the payload defensible later: monotonic_ms, config_digest, trigger, and the entire cellular context block. If a customer asks "why didn't this device alert when the temperature spiked", you need to know what config it was running, whether its UTC was synced, why it sent the frame it sent, and where it was on the network at the time. Without those, you have anecdotes; with them, you have evidence.
Field accuracy you'll actually need at L4 (cold chain pharma):
| Sensor | Practical accuracy bar | Why |
|---|---|---|
| Temperature | ±0.5 °C with traceable cal | EU GDP, USP <659> |
| UTC timestamp | ±1 s with documented sync source | event correlation across devices |
| Position | ≤ 30 m horizontal at 90% | enough for lane, geofence, dwell |
| Shock | ≥ 100 Hz sample rate per axis | catch real impact events |
3. The ingest pipeline that turns frames into alerts
This is where a lot of "real-time" platforms turn out to be batch systems with a thin streaming veneer. The minimum architecture I'd actually call Level 3 looks like this end-to-end:
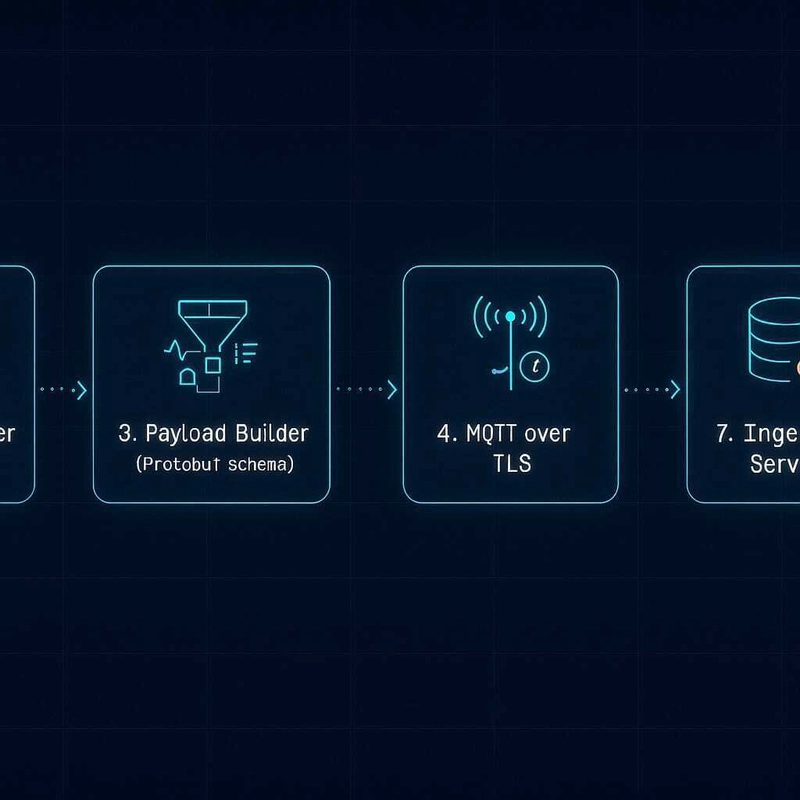
A few decisions that separate a real L3 stack from one that just looks like one:
- MQTT over TLS, not HTTP POST per frame. HTTP per frame burns 5–8 KB of overhead per ping on cellular, which destroys your battery budget. MQTT keepalives plus persistent sessions are roughly an order of magnitude cheaper.
- Edge event filter before the modem wakes. Movement and threshold events need to be evaluated on-device. Pinging unconditionally every N minutes and letting the cloud filter is the L2 pattern in disguise.
-
Hot cache for last-N-minutes per device. Your exception engine needs sub-second access to recent frames, not a query against the full time-series store. Redis or equivalent, keyed by
device_id, sized to your RTO. - Exception routing as code, not a dashboard rule. Versioned, code-reviewed, tested. The "dashboard alert builder" approach falls over the first time you need to debug why an alert didn't fire.
A reasonable end-to-end latency budget for a ping → alert → notification on this stack:
device sample           ~ 0       (sensor read)
edge filter + payload   ~ 50 ms
modem TX + RAN          200–800 ms (good coverage)
ingest + parse          ~ 30 ms
exception eval (hot)    ~ 20 ms
notification dispatch   ~ 100 ms
─────────────────────────────────
Total typical            < 1.5 s end-to-end
If your stack can't hit single-digit-seconds end-to-end on a normal frame, you're somewhere on the L2.5 spectrum even if marketing says otherwise.
How Should You Sequence a Visibility Project?
The single most expensive mistake I watch teams make is trying to instrument the entire fleet at L3 simultaneously. The operations cost of real-time data is paid once per organization: training a team to manage by exception, building the alert-routing rules, defining what success even looks like. Pay it once, on one asset class, before you scale.
The order I push customers toward:
- Pick the highest-risk or highest-value asset class. One.
- Deploy L3 against it. Validate the payload schema and end-to-end latency under load.
- Train the ops team to act on the alerts in real time, not just see them.
- Only then expand — to more lanes at L3, or L4 sensors on the same lane.
- Layer L5 predictive intelligence on lanes where volume justifies the data investment, never network-wide on day one.
L4 is mandatory for regulated cold chain, biotech, and high-value cargo. The bar there is set by auditors, not dashboards. L5 across a full network is realistic only after L3 is fully embedded — most of the disappointing predictive-visibility pilots I've watched up close failed because the underlying L3 telemetry wasn't actually L3.
There's a hardware-side companion to this framework that walks through which device categories map to which rung, if you want a buyer's-perspective complement to the engineering view above.
What Question Should You Sit With?
The single most useful diagnostic for whether your real-time tracking stack is actually L3 is a single question, asked honestly against your own pipeline. If you skim only one thing from this post, sit with it for a minute against your own deployment:
If a temperature excursion happened on one of your assets right now, who would know within the hour, and how?
Trace the answer through your pipeline — sensor sample, edge filter, modem, ingest, exception eval, notification. If any of those stages is fuzzy or "the carrier tells us," you have a clear next thing to work on.
What does your stack look like? I'm always curious about the end-to-end latency people are actually hitting in production, especially on NB-IoT lanes where the RAN side is the long pole. Drop a comment if you've measured it on yours.
This article was written with AI assistance for research and drafting, based on field experience designing cellular IoT trackers and reviewing production telemetry pipelines.