









- Which KPIs Actually Drive Supplier Accountability
- How to Design a Scorecard That Prompts Action (not paperwork)
- Where the Data Should Come From, How Often, and What Targets Look Like
- How Reviews, Escalations, and Rewards Change Supplier Behavior
- A Practical Scorecard Template and Implementation Checklist
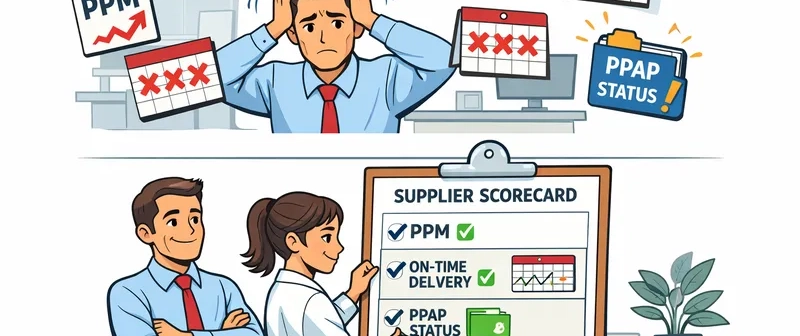
Supplier performance rarely fails because suppliers lack effort; it fails because measurement lacks clarity. A properly designed supplier scorecard ties PPM, on-time delivery, and PPAP status to decisions — not just reporting — so you can protect the line, prioritize corrective action, and invest where it yields measurable returns.
The symptoms are familiar: the procurement spreadsheet says one thing, quality’s inspection log shows another, and production experiences intermittent line stops that nobody can tie to a single root cause. Suppliers get a 20-column report once a month and treat it as compliance theater. The consequence is wasted engineering time, firefighting containment instead of fixing the process, and supplier relationships driven by blame rather than capability building.
Which KPIs Actually Drive Supplier Accountability
Focus on measures that link directly to customer impact and supplier actionability. Your supplier KPIs should answer three questions: What failed? Who caused it? What must happen next?
-
Core KPIs (the ones you should expect on every scorecard):
-
PPM(Parts Per Million defects):PPM = (defects / inspected_units) * 1,000,000. UsePPMfor cross-supplier comparison when unit volumes vary; when opportunities per unit matter, useDPMO. The metric is a standard way to quantify defect intensity. -
On-time delivery(OTD/OTIF):OTD% = (on_time_deliveries / total_deliveries) * 100. Track both on-time and in-full where fill rate matters. This measures supply reliability to the schedule your operations need. -
PPAP status: explicit gate states (e.g., Not Submitted, Submitted, Under Review, Approved — with PPAP Level noted). TreatPPAP statusas a release gate, not a performance vanity metric. -
Process capability (
Cpk): rollingCpkon the critical-to-quality features; target values reflect risk (see targets section). -
First Pass Yield (
FPY) or Escape Rate: measures whether defects are caught before shipment vs. customer escapes. - Corrective action responsiveness: average days to containment / 8D closure; timeliness correlates with supplier discipline.
- Audit / QMS score: supplier audit results (ISO/IATF evidence) and closure status of audit findings.
-
Important: Limit each supplier's scorecard to 3–5 primary KPIs plus a short set of secondary enabling metrics. Too many metrics dilute accountability.
| KPI | Why it matters | Calculation (short) | Typical cadence |
|---|---|---|---|
| PPM | Defect intensity across volume | PPM = (defects / inspected_units) * 1,000,000 |
Weekly / rolling 30–90d. |
| On-time delivery | Line continuity | OTD% = on_time / total * 100 |
Daily exceptions; weekly summary. |
| PPAP status | Release gate for production | Categorical (levels + approval date) | Tracked continuously; reviewed monthly. |
| Cpk | Process capability for CTQ features | Statistical calculation from SPC | Monthly or after process change. |
| SCAR closure time | Supplier responsiveness | Avg days to closure | Weekly exceptions; monthly review. |
Cite only the metrics that link to action. For example, a rising PPM without a SCAR owner is just a trend line.
How to Design a Scorecard That Prompts Action (not paperwork)
Design the scorecard so every item maps to a decision or required activity.
Key design rules:
- One page per supplier/part-family, with a top-line composite and the three most important trend lines visible at a glance.
- Left column: supplier identity, part(s), criticality tier, last audit date,
PPAP status. Right column: the recent trend (last 3 periods) and the next required action. Use explicit owners and due dates. - Present both current state and trend: current
PPM(numeric), trend arrow (▲▼→), and a 30/90-day rolling average. - Use RAG (Red/Amber/Green) definitions tied to escallation rules (not subjective color choice). Example: Green = composite score ≥ 90, Amber = 70–89, Red < 70.
- Weighting: base composite scores on risk. Example weight split for high-risk parts:
PPM 50%,On-time delivery 25%,PPAP/audit 25%.
Example composite scoring pseudo-formula:
# python example: compute composite score
weights = {'ppm': 0.5, 'otd': 0.25, 'ppap_audit': 0.25}
ppm_score = max(0, 100 - (ppm / 10))        # example transform
otd_score = otd_percent                     # already 0-100
ppap_audit_score = (ppap_ok * 100 + audit_score)/2
composite = ppm_score*weights['ppm'] + otd_score*weights['otd'] + ppap_audit_score*weights['ppap_audit']
Use simple transforms so the score is intuitive for business partners.
Design choices that reduce noise:
- Separate operational dashboard (real-time exceptions) from strategic scorecard (monthly governance). Operational systems feed the dashboard; the scorecard drives business reviews.
- Keep the scorecard agnostic to internal org politics: show the data, the owner, and the committed action.
Where the Data Should Come From, How Often, and What Targets Look Like
Trustworthy source selection and cadence remove argument and enable root cause focus.
Primary data sources:
-
ERP / Receiving & ASN records for
on-time deliveryand quantity confirmations. -
Inspection systems / QMS (incoming inspection logs, CMM exports, SPC charts) for
PPM,FPY, andCpk. -
Supplier portal / shared PPAP repository for
PPAP statusand control plans. - Audit reports and supplier corrective action logs for closure and trend analysis.
- Contract / service level documents for agreed targets and penalties.
Cadence recommendations:
- Real-time / daily: exception feeds for late shipments and failed inspections.
-
Weekly:
PPMtrending and open SCARs. - Monthly: formal supplier scorecard and operational review.
- Quarterly: business review with senior procurement, operations, and engineering.
Target-setting method:
- Establish the baseline from the trailing 90 days.
- Set a capability-based target where possible (use
Cpkto determine realistic tolerance). Many organizations useCpk ≥ 1.33as a production baseline andCpk ≥ 1.67for critical features; adjust by risk. - Use benchmark bands for tiers: critical safety parts (target
PPM < 50), critical functional parts (PPM < 200), commodity (PPM < 2,000) — these are starting points; refine with your APQP/PPAP and industry benchmarking. - Convert targets to time-bound stretch goals (e.g., reduce PPM 30% in 90 days for amber suppliers).
Document the data lineage so each KPI links back to a source system and a timestamp. Disputes stop when both parties see the same evidence.
How Reviews, Escalations, and Rewards Change Supplier Behavior
Measurement without governance is decoration. The scorecard must feed a disciplined review, escalation, and recognition process.
Operational rules that work in the field:
- Daily: exceptions list emailed to operations and supplier for immediate containment (e.g., hold suspect lots).
- Weekly: tactical calls for suppliers in amber/red to review containment effectiveness and open SCARs.
- Monthly: formal scorecard review covering the composite score, trends, and commitments; record minutes and owners.
- Quarterly: strategic business review that includes capability development, capacity planning, and commercial consequences.
Escalation matrix (example):
| Trigger | Action | Owner |
|---|---|---|
| PPM > 500 for 2 consecutive weeks | Immediate containment, temporary shipment hold, SCAR required within 48h | Supplier QAM / SQE |
| OTD < 85% for 30 days | Procurement escalation, supplier corrective action plan | Procurement Lead |
| PPAP not approved at production start | Stop production release until PPAP gate cleared | Engineering / SQE |
A disciplined SCAR process with 8D/RCAs, containment evidence, and verification prevents repeat issues. Timebox SCAR closures (e.g., containment within 48 hours, root cause within 14 days) and track overdue SCARs on the scorecard.
Rewards and incentives:
- Award preferred supplier status, early-payment terms, or incremental sourcing volumes to suppliers that demonstrate sustained improvement and capability investment.
- Pair rewards with capability development: kaizen events, SPC training, shared FMEA sessions.
Use governance to allocate your supplier development dollars to the suppliers who offer the best return on fixing root causes rather than covering recurring containment costs.
A Practical Scorecard Template and Implementation Checklist
A lightweight, executable template plus an implementation checklist accelerates adoption.
Scorecard columns (one-line explanation):
-
SupplierID,SupplierName -
PartNumber,CriticalityTier -
PeriodStart,PeriodEnd -
InspectedUnits,Defects,PPM -
OnTimeDelivery%,PPAPStatus(Level + ApprovalDate) -
Cpk,AuditScore -
OpenSCARs,AvgSCARDays -
CompositeScore,RAG,Owner,LastReviewDate,NextAction
Sample CSV scorecard row (CSV format):
SupplierID,SupplierName,PartNumber,CriticalityTier,PeriodStart,PeriodEnd,InspectedUnits,Defects,PPM,OnTimeDelivery%,PPAPStatus,Cpk,AuditScore,OpenSCARs,AvgSCARDays,CompositeScore,RAG,Owner,LastReviewDate,NextAction
S-1001,Acme Metals,PN-4501,High,2025-11-01,2025-11-30,12000,3,250,98,Level3_Approved_2025-06-25,1.45,92,0,0,92,Green,Jason Li,2025-12-05,"No action"
Sample scoring snippet (Python):
def ppm_to_score(ppm):
    # simple mapping: 0 ppm -> 100, 1000 ppm -> 0
    return max(0, 100 - (ppm / 10))

def composite_score(ppm, otd_percent, ppap_ok, audit_score, weights):
    ppm_s = ppm_to_score(ppm)
    ppap_audit_s = (100 if ppap_ok else 50 + audit_score/2)
    return round(ppm_s*weights['ppm'] + otd_percent*weights['otd'] + ppap_audit_s*weights['ppap_audit'], 1)
Implementation checklist (practical, step-by-step):
- Classify suppliers by part criticality and annual spend; assign Tier 1/Tier 2/Tier 3.
-
Select 3–5 KPIs per tier (Tier 1:
PPM,OTD,PPAP status; Tier 3:OTD, basic quality). - Map data sources and validate a 30-day pilot data pull for three representative suppliers.
- Agree targets with procurement, operations, and engineering using baseline + capability logic.
- Build one-page scorecard (spreadsheet or BI view) with owner, RAG definitions, and next action fields.
- Run a 90-day pilot with weekly operational calls and monthly governance; collect feedback and adjust transforms/weights.
- Institutionalize governance: weekly exception handling, monthly scorecard review, quarterly strategic review.
- Tie outcomes: use scorecard results to prioritize SCARs, supplier development funds, and sourcing decisions.
Monthly review agenda (brief):
- Top-line composite and change since last month.
- Two suppliers with improving trends and two suppliers in red (action log review).
- Open SCARs: status and overdue items.
- PPAP and audit actions required for upcoming production ramps.
Sources:
ISO 9001: Quality management systems - Reference for supplier QMS expectations and audit context used when recommending audit scores and QMS alignment.
AIAG (Automotive Industry Action Group) - Source for PPAP process and submission level guidance; used to frame PPAP status as a gate and to reference PPAP levels.
ASQ — Quality resources - Used for PPM/DPMO and process capability (Cpk) concepts and common interpretation of defect and capability metrics.
ASCM (formerly APICS) - Used for definitions and best-practice cadences for delivery metrics such as On-time delivery / OTIF.
Lean Enterprise Institute - Principles and practical guidance on focusing metrics that drive continuous improvement and capability building.
APQC — Benchmarking and metrics - Used for benchmarking approaches and for guidance on target-setting processes across supplier tiers.
Adopt the discipline of fewer, well-sourced metrics; make PPM, on-time delivery, and PPAP status the plumbing of your supplier performance management; and insist that every scorecard row maps to an owner and a required action. Drive the governance and the money to the issues that move the needle and you will see supplier performance migrate from surprise to predictability.