





I Built a Carbon Footprint Calculator That Generates Unique SVG Fingerprints — Here's How (Earth Day 2026 🌍)
TL;DR: Carbon Fingerprint is a single-file web app that calculates your carbon footprint from 5 lifestyle questions, then renders a unique organic SVG fingerprint seeded from your answers. It's backed by real NASA GISS temperature data (1880–2025), IPCC AR6 emission factors, and covers 5,012 cities across 157+ countries. Zero backend. Zero API keys. Just one index.html.
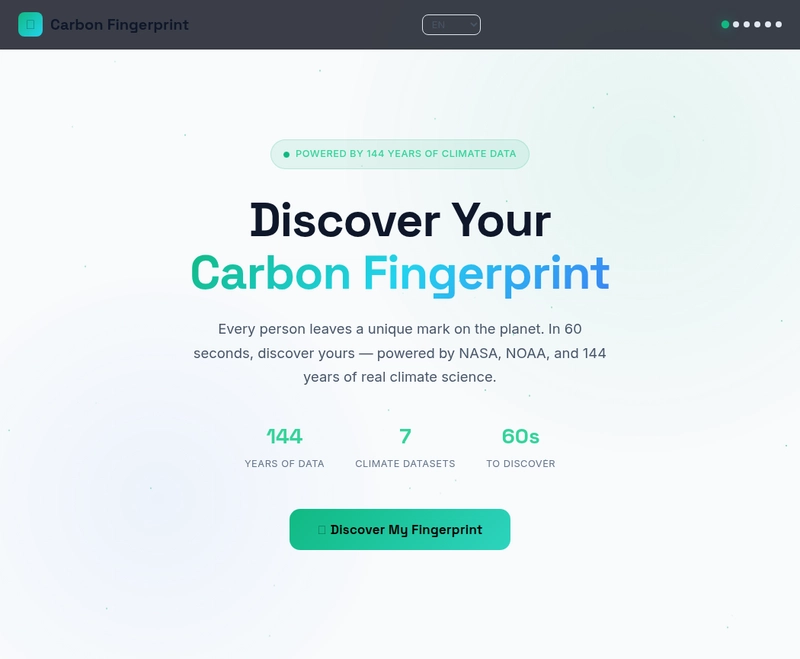
The landing page — dark mode with animated SVG particles and a glowing radial gradient backdrop.
Why Another Carbon Calculator?
Most carbon footprint calculators feel like tax forms — long, boring, and forgettable. You fill them out, get a number, and never think about it again.
I wanted something different. Something visual, personal, and shareable. Something where the result itself feels like yours — not just a number, but a pattern that's as unique as your actual environmental impact.
That's where the fingerprint idea came from.
The Concept: Your Carbon = Your Fingerprint
The core idea: your answers to 5 simple questions get transformed into a procedurally generated SVG fingerprint. No two people get the same visualization because the pattern is seeded from their specific answer combination.
// Seed from user's answers for unique fingerprint
const seed = answers.reduce((a, b) => a * 7 + b, 42);

function seededNoise(i, j) {
  const x = Math.sin(seed * 127.1 + i * 311.7 + j * 74.7) * 43758.5453;
  return x - Math.floor(x);
}
The fingerprint uses organic ridge patterns — concentric rings perturbed by multiple sine waves, a central spiral whorl, and category-specific arc segments that glow based on your highest emission areas. It's not just decorative; it encodes real data.
The 5 Questions (Backed by Real Science)
Each question maps to a lifestyle category with IPCC AR6-calibrated emission factors:
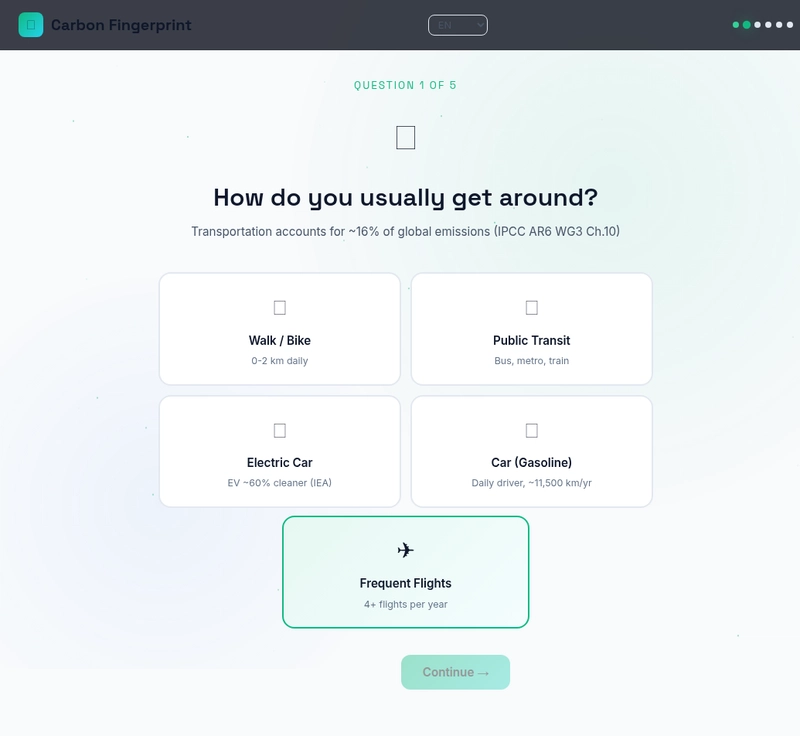
One of 5 quiz questions — each option shows the CO₂ equivalent and the scientific source.
| # | Category | Example Options | Source |
|---|---|---|---|
| 1 | 🚗 Transport | Walk/bike (0.2t) → Frequent flights (4.5t) | IPCC AR6 WG3 Ch.10 |
| 2 | 🥗 Diet | Plant-based (1.0t) → Heavy meat (3.5t) | Poore & Nemecek 2018 |
| 3 | ⚡ Energy | Renewable (0.3t) → Fossil heavy (3.2t) | IEA 2023 |
| 4 | 📦 Consumption | Minimal (0.4t) → High volume (2.8t) | UNEP / IPCC AR6 WG3 Ch.5 |
| 5 | ✈️ Flights | None (0t) → 3+ flights (4.0t) | IPCC AR6 WG3 Ch.10 |
A base emission of 1.5 tonnes is added to every result (shared infrastructure, government services, etc.). Total CO₂ determines your label:
- ≤2.5t → 🌱 Climate Champion
- ≤4.5t → 🌿 Eco-Conscious
- ≤7t → 🌳 Growing Awareness
- ≤12t → 🔥 Above Average
- >12t → 💨 Heavy Footprint
Under the Hood: The Fingerprint Generator
This is the part I'm most proud of. The SVG is built entirely in JavaScript — no images, no canvas, no libraries.
Ridge Pattern Generation
The fingerprint consists of ~26 concentric organic rings, each perturbed by three overlapping sine waves:
for (let r = 18; r < 148; r += 5) {
  for (let i = 0; i <= segments; i++) {
    const angle = (i / segments) * Math.PI * 2;
    // Three-layer organic perturbation
    const n1 = Math.sin(angle * 3 + r * 0.1 + seed * 0.01) * (2 + r * 0.03);
    const n2 = Math.sin(angle * 7 + r * 0.05) * (1 + r * 0.015);
    const n3 = Math.cos(angle * 5 + seed * 0.02) * (1.5 + r * 0.02);
    const perturbedR = r + n1 + n2 + n3;
    // ... build SVG path with cubic bezier smoothing
  }
}
The seed parameter comes from the user's answers, so different response combinations produce visibly different ridge shapes — just like real fingerprints.
Category Arcs
Overlaid on the ridges are segmented arcs — one ring per emission category. The arc length and opacity scale with the CO₂ value for that category:
// Transport arc (blue gradient)
const transportArc = createArc(cx, cy, 55, 270, 270 + (categoryCO2.transport / maxVal) * 180);
// Diet arc (green gradient)
const dietArc = createArc(cx, cy, 70, 180, 180 + (categoryCO2.diet / maxVal) * 180);
So a heavy meat eater gets a longer, brighter diet arc. A frequent flyer gets a dominant transport ring. The fingerprint literally reflects your lifestyle.
Animated Entry
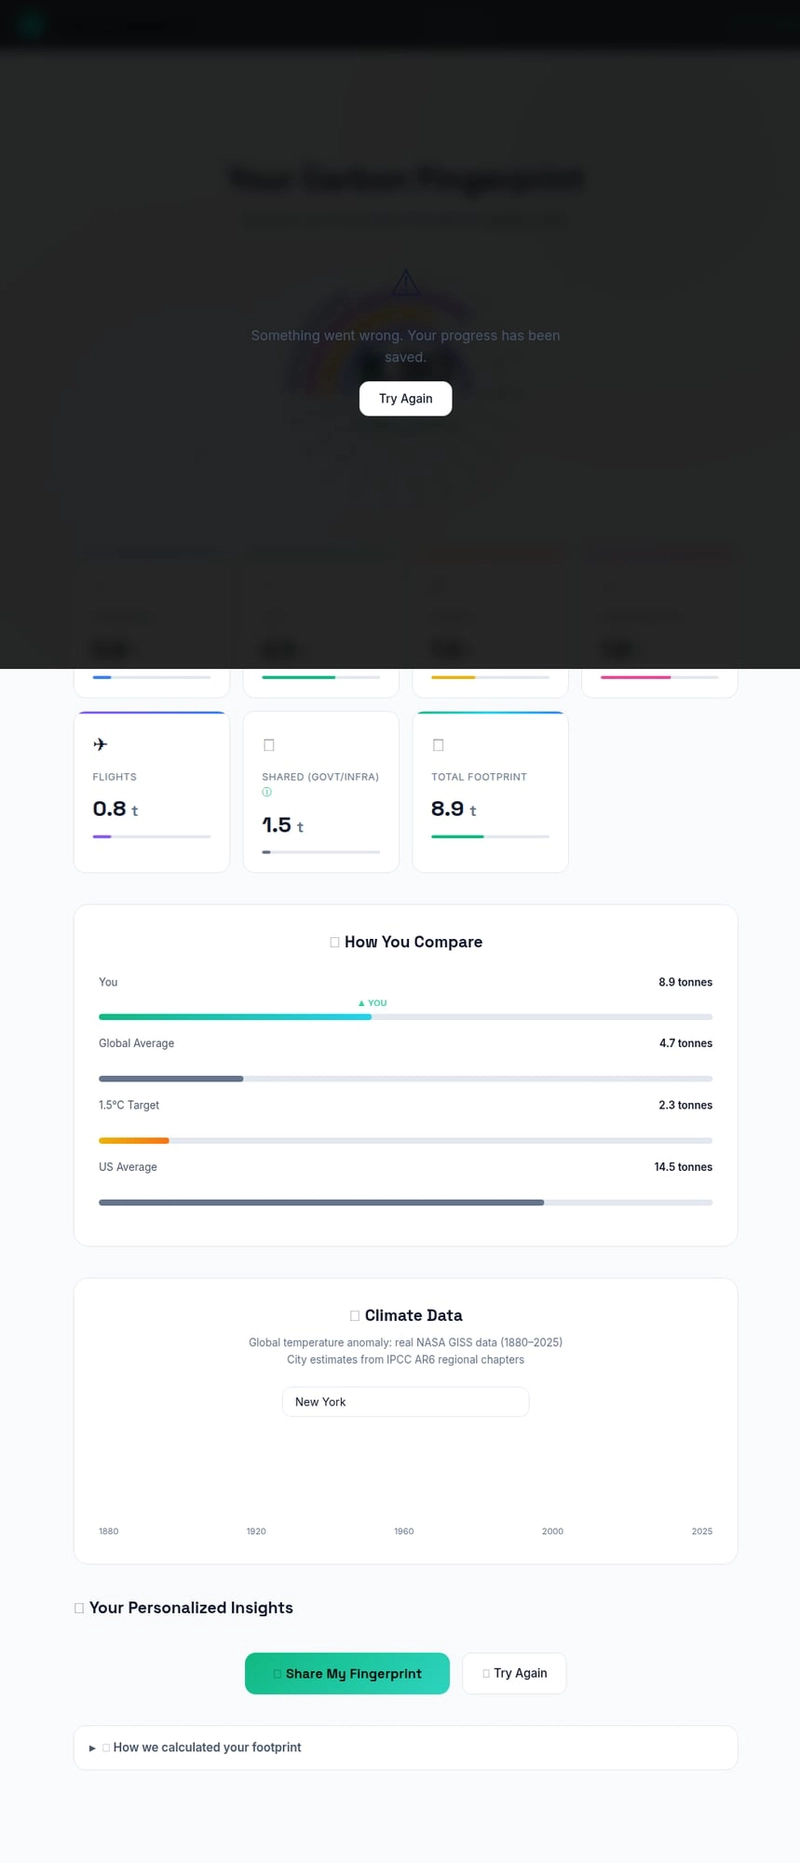
The full results view — unique SVG fingerprint, CO₂ score, category breakdown bars, comparison chart vs global/US averages and the 1.5°C target, and city-specific climate data.
The whole thing draws itself with a CSS stroke-dashoffset animation:
.fingerprint-svg path {
  stroke-dasharray: 1000;
  stroke-dashoffset: 1000;
  animation: drawRidge 2s ease forwards;
}

@keyframes drawRidge {
  to { stroke-dashoffset: 0; }
}
Each ring has a staggered delay, creating that "drawing itself" effect.
Real Climate Data: 144 Years of NASA Temperature Data
The app embeds real NASA GISS temperature anomaly data from 1880 to 2025 — not estimates, actual measurements:
const GISS_GLOBAL_ANOMALY = [
  -0.17, -0.8, -0.11, -0.17, -0.28, -0.33, // 1880-1885
  // ... 140+ years of data ...
  1.17, 1.28, 1.19  // 2023-2025
];
This data renders as an animated timeline chart in the results section, showing the unmistakable warming trend from the late 1800s to today. When someone sees their carbon fingerprint next to real temperature data spanning their great-grandparents' lifetimes, it hits differently than a bar chart.
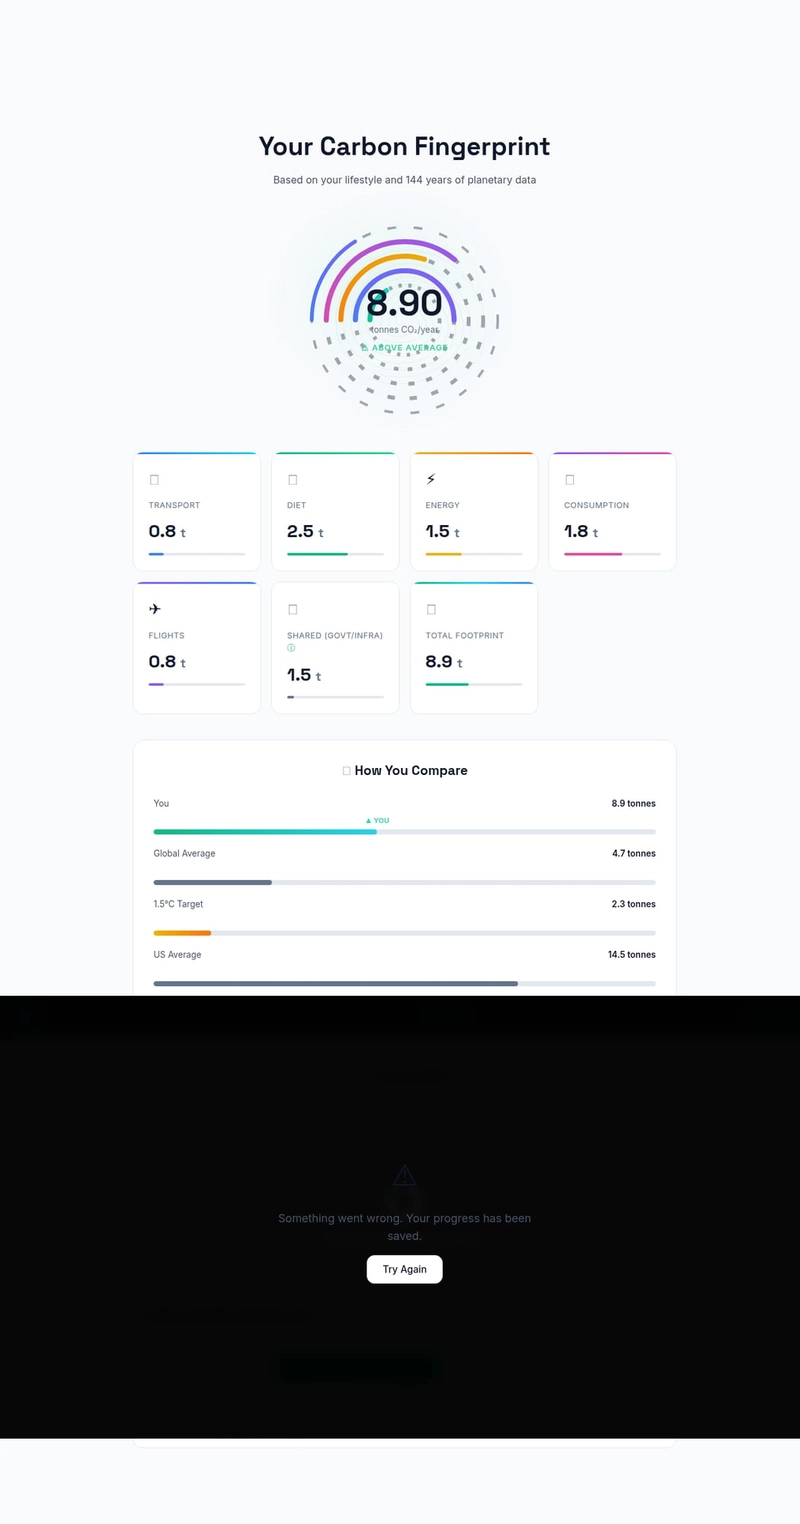
The climate section — NASA GISS temperature anomaly timeline (1880–2025), searchable city dropdown (5,012 cities), and local climate indicators.
5,012 Cities with Local Climate Indicators
Each city carries four data points from IPCC AR6 regional chapters and national meteorological services:
| Indicator | Example (New Delhi) | Source |
|---|---|---|
| 🌡️ Local Temperature | 25.8°C, +2.1°C rise | IMD / IPCC AR6 WG2 Ch.10 |
| 🏭 CO₂ Concentration | 421 ppm | Global (Mauna Loa) |
| 🌊 Sea Level Rise | 0m (inland) | IPCC AR6 WG2 |
| ⚡ Extreme Weather Days | 72 days/year | IMD / IPCC AR6 WG2 |
Coverage spans 157+ countries — from Whitehorse, Canada (temp rise: +2.8°C 🥶) to Darwin, Australia (65 extreme weather days/year 🌀).
The Share Card: From SVG to PNG
Users can export their results as a 1080×1350px PNG (Instagram-ready). The pipeline:
- Build a hidden
divwith the fingerprint, breakdown, comparison bars, and city data - Lazy-load
html2canvasfrom CDN (only when the user clicks "Share") - Render to canvas → convert to PNG → trigger download
async function generateShareCard() {
  await loadHtml2canvas(); // lazy, ~45KB gzipped
  const card = document.getElementById('shareCard');
  const canvas = await html2canvas(card, {
    scale: 2,
    backgroundColor: '#0a0f1a',
    useCORS: true
  });
  canvas.toBlob(blob => {
    const url = URL.createObjectURL(blob);
    // download or native share...
  });
}
The share card also includes a shareable URL — answers are base64-encoded in the query string (?r=MjIxMDE), so you can send your exact fingerprint to a friend and they see it instantly.
10 Languages, 1 File
The entire i18n system is a nested object with string keys:
const translations = {
  en: { hero_title_1: 'Discover Your', hero_title_2: 'Carbon Fingerprint', ... },
  es: { hero_title_1: 'Descubre Tu', hero_title_2: 'Huella de Carbono', ... },
  zh: { hero_title_1: '发现你的', hero_title_2: '碳指纹', ... },
  // + hi, pt, fr, de, ja, ko, ar
};
Browser language is auto-detected. A manual selector sits in the header. Every UI element — quiz options, results, methodology, share card — is translated.
Technical Choices I'd Make Again
Single HTML File
The entire app is one 9,400-line index.html. CSS is in <style>, JS is in <script>, data is embedded. No build step, no bundler, no node_modules.
Why it works: For a project like this, the complexity of a framework would add nothing. The quiz has 5 screens. The state is a single array. The "hardest" part (the SVG fingerprint) is pure math. Vercel deploys it with zero config.
PWA + Offline Support
The manifest.json makes it installable on phones. After the first load, everything works offline — the NASA data, city data, translations, all embedded.
Privacy-Respecting Analytics
Just anonymous hit counters via countapi.xyz. No cookies, no PII, no tracking scripts. You don't need to know who took the quiz, just that people are engaging.
Accessibility Built In
- ARIA roles on all interactive elements
- Keyboard navigation throughout
-
prefers-reduced-motiondisables all animations - Skip-to-content link
- Screen reader labels on the fingerprint visualization
What I Learned Building This
SVG math is addictive. Once I started generating organic patterns with sine wave perturbation, I couldn't stop tweaking parameters. The fingerprint went through ~30 iterations.
Real data > synthetic data. Embedding actual NASA temperature anomalies made the results feel credible. People trust a number more when they can see the 144-year dataset behind it.
i18n from day one is worth it. Adding 10 languages after the fact would have been painful. Doing it as a
translations[key]pattern from the start was maybe 2 extra hours.Single-file apps have superpowers. No CI/CD pipeline. No dependency audits. No framework migrations. Just
index.htmlon Vercel. For a focused tool, this is the way.
Try It
Take the quiz in 60 seconds. Get your fingerprint. Share it. Compare with friends.
⭐ Star the repo on GitHub if you find it useful.
Happy Earth Day 2026. 🌍 Our Power, Our Planet.
Built with vanilla JS, SVG math, and 144 years of climate data. No frameworks were harmed in the making of this app.