





“Why is it so slow even though I have a GPU?” I’d like to share my three-week struggle, which began with this single question.
Introduction
While developing the Vision AI service, I chose Nvidia Triton Inference Server as the framework for model serving. Its features—such as multi-framework support, dynamic batching, and ensemble pipelines—were excellent, and I was particularly drawn to its ability to fully leverage NVIDIA GPUs.
For the deployment environment, I chose AWS ECS over SageMaker. I was already familiar with ECS from previous experience, and there was a requirement to expose Triton’s gRPC endpoints directly. However, once we actually deployed Triton on ECS, we encountered some unexpected issues.
This post documents the three main issues we faced and how we resolved them during that process.
Deployment Environment Overview
First, here is a brief overview of the overall architecture.
[Triton on ECS Architecture]
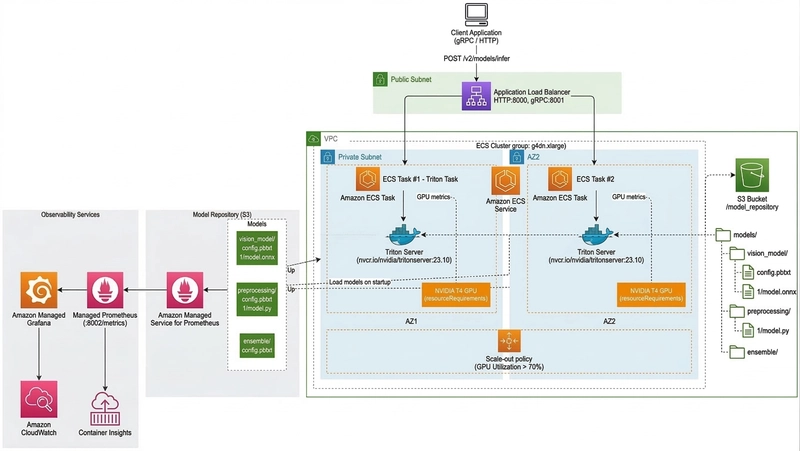
The main components are as follows. We deploy the Triton container as an ECS service on an ECS cluster composed of GPU instances (g4dn.xlarge, NVIDIA T4). The model files are stored in S3 and loaded from S3 when Triton starts. We route HTTP (:8000) and gRPC (:8001) traffic through ALB and monitor GPU metrics using Prometheus and Grafana.
The key settings for the ECS Task Definition are as follows.
{
  “containerDefinitions”: [
    {
      “name”: “triton-server”,
      ‘image’: “nvcr.io/nvidia/tritonserver:23.10-py3”,

“command”: [
        ‘tritonserver’,
        “--model-repository=s3://my-bucket/model_repository”,
        “--allow-grpc=true”,
        “--grpc-port=8001”,

“--allow-http=true”,
        “--http-port=8000”,
        “--allow-metrics=true”,
        “--metrics-port=8002”

],
      “portMappings”: [
        { “containerPort”: 8000, “protocol”: “tcp” },
        { “containerPort”: 8001, ‘protocol’: “tcp” },

{ “containerPort”: 8002, “protocol”: “tcp” }
      ],
      “resourceRequirements”: [
        {
          “type”: “GPU”,
          ‘value’: “1”

}
      ],
      “logConfiguration”: {
        “logDriver”: “awslogs”,
        ‘options’: {
          “awslogs-group”: “/ecs/triton-server”,
          “awslogs-region”: “ap-northeast-2”,

“awslogs-stream-prefix”: “triton”
        }
      }
    }
  ]
}
Issue 1: GPU Not Detected
Symptoms
The ECS task appeared to be running normally, but the following warning continued to appear in the Triton logs.
W0115 09:23:41.123456 1 backend_manager.cc:295]

Unable to load backend ‘tensorrt’:
  failed to load library /opt/tritonserver/backends/tensorrt/libtriton_tensorrt.so:
  libcuda.so.1: cannot open shared object file: No such file or directory
The model had loaded, but inference was running on the CPU instead of the GPU. When I ran nvidia-smi inside the container, there was no output.
Root Cause Analysis
The issue lay in the instance configuration of the ECS cluster. Although we were using a GPU instance (g4dn.xlarge), we were using a standard ECS-Optimized AMI instead of an ECS-Optimized GPU AMI.
To use GPUs in ECS, both of the following conditions must be met.
| Condition | Description |
|---|---|
| ECS-Optimized GPU AMI | An AMI with NVIDIA drivers and nvidia-container-toolkit pre-installed |
resourceRequirements in Task Definition |
GPU resources must be explicitly requested for ECS to allocate a GPU to the container |
Since the standard ECS AMI does not have NVIDIA drivers installed, the container was unable to recognize the GPU.
Resolution
In the AWS Console, I replaced the Auto Scaling Group AMI for the ECS cluster with ami-xxxxxxxx (ECS-Optimized GPU AMI). Here’s how to check the latest GPU AMI ID using the AWS CLI:
# Check the latest ECS-Optimized GPU AMI ID for the current region
aws ssm get-parameters \
  --names /aws/service/ecs/optimized-ami/amazon-linux-2/gpu/recommended/image_id \
  --region ap-northeast-2 \
  --query “Parameters[0].Value” \
  --output text
After replacing the AMI and restarting the instance, nvidia-smi recognized the GPU normally, and Triton successfully loaded the TensorRT backend.
Key Takeaway: When using GPUs in ECS, you must use an ECS-Optimized GPU AMI. While it is possible to manually install NVIDIA drivers on a standard ECS AMI, this is not recommended because the drivers may be reset during AMI updates.
Issue 2: Throughput is Only One-Third of Expectations
Symptoms
After resolving the GPU recognition issue, I ran a load test. The results measured by perf_analyzer were shocking.
# perf_analyzer execution results (Dynamic Batching OFF)
Concurrency: 8
  Throughput: 22.3 infer/sec
  Latency p50: 178ms

Latency p95: 312ms
  Latency p99: 445ms
The inference throughput of 22 requests per second was only one-third of the expected value (~70 req/s). Upon checking the GPU utilization, it was only 18% on average. The GPU was sitting idle despite being available.
Root Cause Analysis
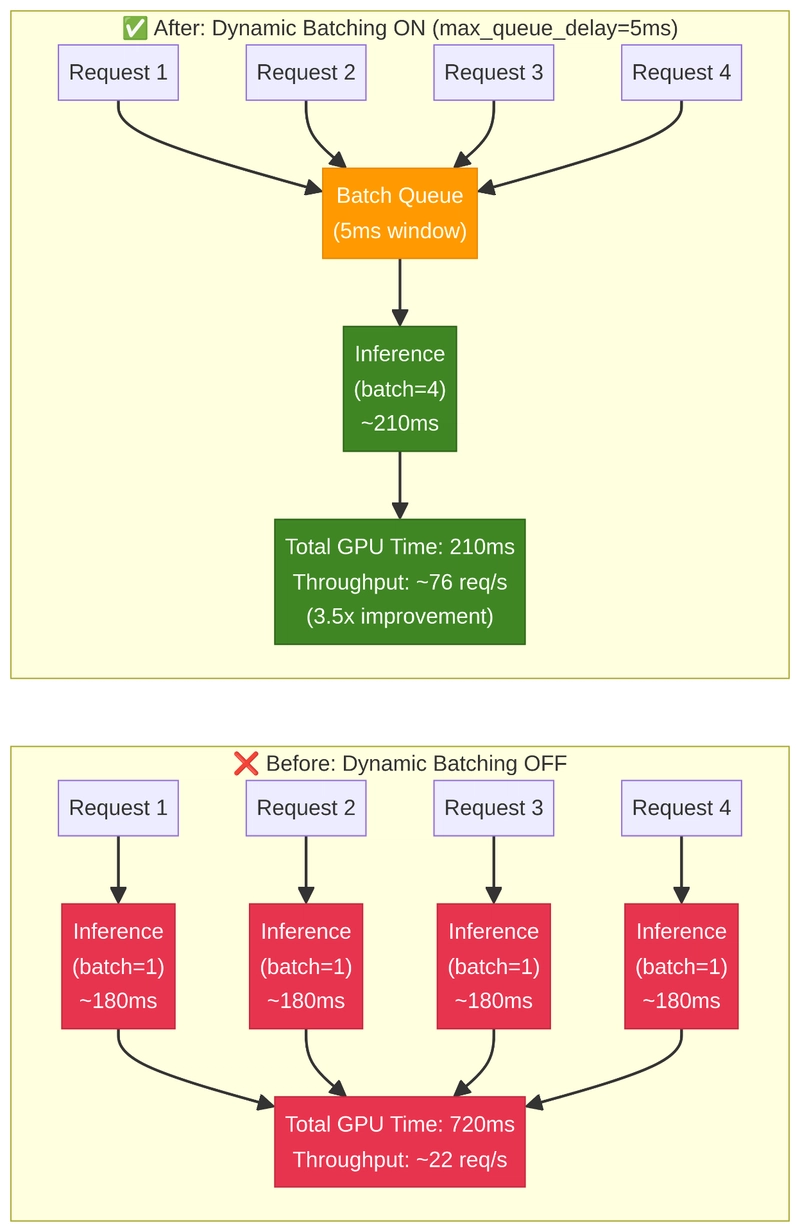
The problem was that Dynamic Batching was disabled. Since each inference request was being sent to the GPU individually, we were not utilizing the GPU’s parallel processing capabilities at all.
GPUs are specialized for parallel matrix operations. The time difference between running inference with batch=1 and batch=8 is not as significant as one might think. In other words, by grouping multiple requests and processing them at once, we can simultaneously increase both GPU utilization and throughput.
[Comparison of Dynamic Batching Effects]
Solution
We added the Dynamic Batching configuration to the model’s config.pbtxt.
# model_repository/vision_model/config.pbtxt

name: “vision_model”
backend: ‘onnxruntime’
max_batch_size: 8

input [
  {
    name: “input_image”

data_type: TYPE_FP32
    dims: [ 3, 640, 640 ]
  }
]

output [
  {
    name: “output_detections”
    data_type: TYPE_FP32
    dims: [ -1, 6 ]
  }
]

# Enable Dynamic Batching
dynamic_batching {
  preferred_batch_size: [ 4, 8 ]
  max_queue_delay_microseconds: 5000 # Execute batch after a 5ms wait
}

# Number of concurrent model instances (within the limits of available GPU memory)
instance_group [
  {
    count: 1

kind: KIND_GPU
  }
]
max_queue_delay_microseconds: 5000 means the system waits up to 5ms to fill a batch. If this value is too large, latency increases; if it is too small, batch efficiency decreases. For our service, 5ms was the optimal balance between throughput and latency.
The results after changing the settings are as follows.
# perf_analyzer execution results (Dynamic Batching ON)
Concurrency: 8
  Throughput: 76.1 infer/sec (+241%)
  Latency p50: 98ms (-45%)
  Latency p95: 187ms (-40%)

Latency p99: 234ms (-47%)
Throughput improved by 3.5 times, from 22 req/s to 76 req/s, and GPU utilization also increased from 18% to 72%.
Key Takeaway: Enable Dynamic Batching by default when deploying Triton for the first time. Set
preferred_batch_sizebased on the model’smax_batch_sizeand actual traffic patterns, and adjustmax_queue_delay_microsecondsto meet your service’s latency SLA.
Issue 3: ECS tasks periodically crash due to OOM
Symptoms
After enabling Dynamic Batching and running it for a few days, we observed that ECS tasks were restarting periodically. Checking the CloudWatch logs revealed that the cause was **OOMKilled (Out of Memory)**.
# CloudWatch Logs
[ERROR] Container ‘triton-server’ failed with exit code 137 (OOMKilled)
What was strange was that it was not GPU memory but **CPU memory (RAM)** that was running low. The g4dn.xlarge instance provides 16GB of RAM, but the Triton container was using over 12GB.
Root Cause Analysis
The issue lay in how Triton’s CUDA Unified Memory operates. By default, Triton uses CPU memory as a fallback when GPU memory is insufficient. It also caches model weights in CPU memory during model loading.
In the case of our model, the ONNX file size was approximately 800MB, and Triton was excessively using CPU memory by copying it multiple times internally. In particular, enabling Dynamic Batching resulted in additional intermediate buffers being allocated for batch processing.
Solution
We resolved the issue by combining three approaches.
1. Adjusting Memory Limits in the ECS Task Definition
We explicitly set the soft limit (memoryReservation) and hard limit (memory) for the ECS Task.
{
  “name”: “triton-server”,
  “memory”: 14336,
  “memoryReservation”: 10240,
  “resourceRequirements”: [{ “type”: “GPU”, ‘value’: “1” }]
}
2. Limiting Triton’s GPU Memory Usage
We explicitly specified the GPU memory pool size using the --cuda-memory-pool-byte-size option.
tritonserver \
  --model-repository=s3://my-bucket/model_repository \
  --cuda-memory-pool-byte-size=0:3221225472 \ # Allocate 3GB to GPU 0

--pinned-memory-pool-byte-size=1073741824 \ # 1GB of pinned memory
  --allow-grpc=true \
  --allow-http=true
3. Add memory optimization settings to the model's config.pbtxt
# Add to model_repository/vision_model/config.pbtxt
optimization {
  cuda {
    graphs: true # Reduce kernel launch overhead using CUDA Graphs
  }
}

# Disable CPU fallback when GPU memory is insufficient (force explicit failure)
instance_group [
  {
    count: 1
    kind: KIND_GPU
    gpus: [ 0 ]
  }
]
After applying these three measures, memory usage stabilized, and restarts caused by OOM completely disappeared.
Key Takeaway: When deploying Triton on ECS, you must monitor CPU memory usage as well as GPU memory. It is particularly important to explicitly control memory usage with the
--cuda-memory-pool-byte-sizeand--pinned-memory-pool-byte-sizeoptions when serving large models.
Final Performance Comparison
The final performance results after resolving all three issues are summarized below.
| Metric | Initial (Issue State) | Final (After Optimization) | Improvement Rate |
|---|---|---|---|
| Throughput (req/s) | 22.3 | 76.1 | +241% |
| P50 Latency | 178ms | 98ms | -45% |
| P99 Latency | 445ms | 234ms | -47% |
| GPU Utilization | 18% | 72% | +300% |
| OOM Restarts | 2–3 times per week | 0 times | Fully Resolved |
Conclusion
Triton Inference Server is a powerful tool, but to use it effectively in an ECS environment, you need to avoid a few pitfalls. The three issues covered in this article—failed GPU detection, Dynamic Batching not enabled, and CPU memory OOM—are all mentioned in the official documentation, but they are easy to overlook until you actually encounter them.
In particular, Dynamic Batching is one of Triton’s most powerful features, so it’s unfortunate that it is disabled by default. If you are deploying Triton for the first time, please be sure to check this setting.
In the next post, we will cover how to use Triton’s Model Ensemble to handle the preprocessing-inference-postprocessing pipeline on the server side.