





"Will adding a heatmap tool grow our revenue?" It's the most common question I hear from ecommerce operators. The honest answer turned out to be more interesting than I expected.
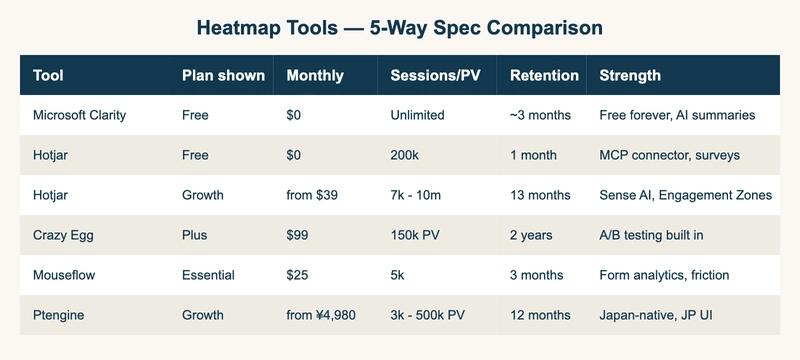
I compared five heatmap tools — Microsoft Clarity, Hotjar, Crazy Egg, Mouseflow, and Ptengine — by feature set, pricing, session limits, and data retention. The market is mature, the segmentation is clean, and picking among them is mostly mechanical once you know what you actually want to fix. But after lining them up, what stayed with me was a different observation: all five share the same structural blind spot, and it's not something you can solve by upgrading to a more expensive plan.
TL;DR
- Free tier is two-horse: Microsoft Clarity (free forever, unlimited sessions) and Hotjar Free (200k sessions/month, MCP connector). Run both — they're free and complementary.
- Paid tier is goal-driven: Crazy Egg ($99) for A/B testing, Mouseflow ($25) for form analytics, Hotjar Pro for per-zone revenue analytics.
- Ptengine ($33-equivalent) wins for Japan-only teams that need a native-language UI.
- The shared blind spot: heatmaps tell you where on the page revenue leaks. None of them tells you which traffic source delivered the buyer.
The two free options actually solve different problems
I expected the free tier to be a single dominant tool. It isn't.
Microsoft Clarity has been free since launch and stays that way at any traffic volume. The page literally says "available permanently at no cost" and "no traffic restrictions." Session recordings, click and scroll heatmaps, AI summaries, and an LLM chat interface against your behavioral data — all free, no session cap.
Hotjar Free (now part of the Contentsquare group after the 2021 acquisition) gives you 200k monthly sessions before any payment, plus a 1-month data retention window, surveys, and an MCP connector that lets LLMs query your Hotjar data directly. The MCP connector is genuinely interesting if you're already running an AI workflow.
The takeaway: if you're a small team and price is the wall, install both. They cover slightly different angles and the only operational cost is a second tag in your tag manager.
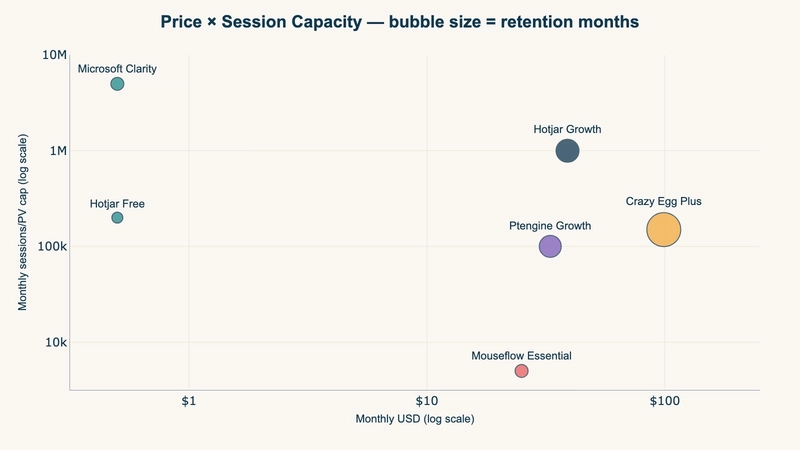
Plotting price against monthly session capacity makes the segmentation visible. Microsoft Clarity sits alone in the upper-left (free, unlimited). Mouseflow Essential is the small bubble at the bottom-right — low session ceiling, paid pricing — which only makes sense when you read it as "investment in form analytics," not as a generic heatmap subscription.
The paid tier is mechanically goal-driven
Once free hits a wall, the choice between paid options collapses to a one-line decision.
| Goal | Pick | Why |
|---|---|---|
| Per-zone revenue on a landing page | Hotjar Pro | "Zone-based Heatmaps with Revenue metrics" |
| A/B testing built in for under $100 | Crazy Egg Plus ($99) | A/B testing native, 150k pageviews |
| Checkout form drop-off forensics | Mouseflow Essential ($25) | Form analytics + Friction Detection from the lowest paid tier |
| Generous budget, want everything | Hotjar Pro | Sense AI integrated platform |
There's a notable thing in Hotjar Pro: revenue per page zone. This is the most advanced feature in heatmap-land today and is worth pausing on. It tracks how much revenue each on-page zone is responsible for. That's a real evolution of the category. But — and this is the point of the article — it's still answering where on the page, not which traffic source. We come back to this below.
Ptengine is the Japan-local outlier
Worth a separate note for teams operating in the Japanese market.
Ptengine has a fully Japanese UI, Japan-based support, and bundles analytics ("Insight") with experimentation and personalization ("Experience") in one platform. Free tier covers 3,000 PV/month with 30 days of retention; the Growth plan starts at ¥4,980 (around $33) and unlocks unlimited heatmaps with 12-month retention.
The pricing is metered by pageviews, not sessions, so model your numbers carefully — a site averaging 5 PV per session pushes 100k sessions into the Premium tier ($600+).
The weakness: sampling on lower plans, recording features less granular than the Western competitors. But for a Japan-first team, the language and support advantage is real.
The shared limit none of them solve
Here's the part that surprised me.
After lining up five tools and reading their feature pages cover-to-cover, the question that every one of them refuses to answer is the same:
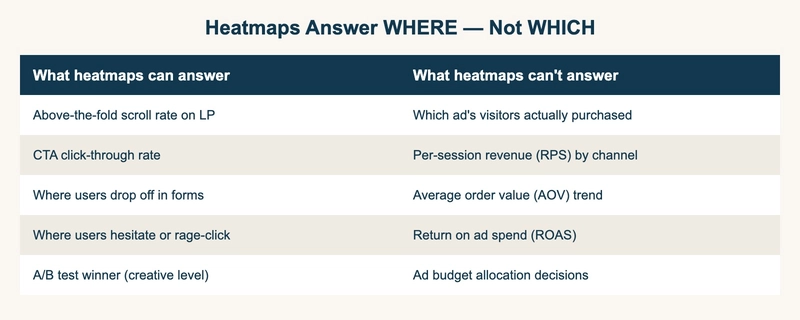
Heatmaps quantify in-page behavior — clicks, scroll depth, mouse movement, form-field interaction. They don't quantify the relationship between traffic source and revenue. Which channel delivered the buyer? What's per-session revenue from Meta Ads vs. Google Search? Which UTM combination has the highest AOV? None of those questions are answerable from heatmap data, no matter how expensive the plan.
Even Hotjar Pro's Zone-based Heatmaps with Revenue metrics — the most sophisticated revenue feature in the category right now — measures revenue per page zone. That's a spatial axis. The traffic-source axis is a separate problem and stays that way.
The framing that helps: WHERE on page vs. WHICH channel
I've started thinking about analytics tools in two layers:
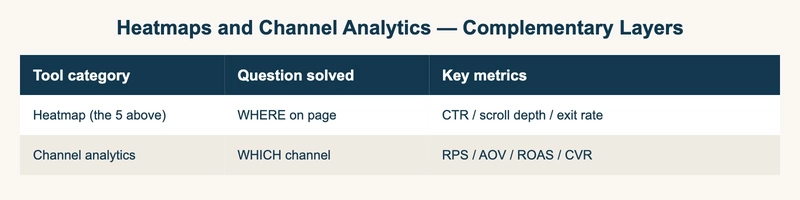
Moving a CTA two sections up to cut LP drop-off by 30% is heatmap work. Killing one ad platform to redirect spend into another and lifting overall ROAS from 180% to 240% is channel-analytics work. Both are needed, and they live in different tools.
When I see an ecommerce team with a heatmap installed but no clear answer to "which channel is generating the highest per-session revenue," I now know the gap isn't in their heatmap selection. It's in the layer they haven't installed yet.
What I'd actually do
If I were starting from zero today on an ecommerce site:
- Install Microsoft Clarity (free, unlimited, takes 5 minutes)
- Install Hotjar Free in parallel for the surveys and MCP angle
- Layer a channel-analytics tool on top — GA4 minimum, plus something that answers per-channel RPS/AOV/ROAS without the standard GA4 friction
- Only upgrade to a paid heatmap when a specific question needs it (form analytics → Mouseflow; A/B testing → Crazy Egg; per-zone revenue → Hotjar Pro)
That's the order that closes the optimization loop without overspending.
For Japan-specific teams, swap Clarity/Hotjar for Ptengine on the heatmap layer and the rest of the stack stays the same.
So what?
Heatmap selection is a real decision but it's a smaller one than the category implies. Five mature tools, clean segmentation, mechanical fit-to-goal. The bigger question — the one that none of them touches — is whether you've installed the second analytics layer that actually answers your traffic-source decisions.
Curious what stack you're running, especially the part outside the heatmap.
I'm building RevenueScope, a "reverse-from-revenue" analytics tool aimed at ecommerce SMBs in Japan. The full breakdown of all five heatmap tools (with the source links and pricing detail) is on the RevenueScope blog.