









An Agent makes a call to an LLM. The LLM decides which MCP server tool should be used for a task. The Agent then makes a call to said tool. This can happen once, or it can happen hundreds of times.
Here's the question: Do you know what MCP Server tools were used, when they were used, and where the prompt originated from? In other words, how can you actually track and confirm tool traces within your MCP Gateway?
That's where having an MCP Gateway that exposes these traces and metrics comes into play.
In this blog, you'll learn how to do full end-to-end trace observability for any MCP Server and tool.
Prerequisites
To follow along with this blog post in a hands-on fashion, you will need:
- A k8s cluster (local is fine).
- Agentgateway OSS installed, which you can find here.
- A GitHub account because you will need a PAT (personal access token) to use the GitHub Copilot MCP Server.
If you don't have a k8s cluster, there's a large chunk of this blog post that's pretty visual, so you can follow along from a theoretical standpoint.
How Agentgateway Exposes MCP Traces
Agentgateway exposes the agentgateway_mcp_requests_total metric which includes:
- The method used
- Resource
- MCP Server
- MCP session ID
- Tool name
- Listener
- Route
- Routing rules
I can view the metrics within agentgateway after I make an MCP Server tool call by port-forwarding the Gateway Pod and using a curl over port 15020, which is the agentgateway pod internal metrics/stats listener.
kubectl port-forward -n agentgateway-system pod/mcp-gateway-7f9f6679cd-d5jmg 15020:15020

curl -s http://127.0.0.1:15020/metrics | grep agentgateway_mcp_requests
And then I can see the following metric output:
agentgateway_mcp_requests_total{method="tools/call",resource_type="tool",server="github-copilot",resource="get_me",bind="3000/agentgateway-system/mcp-gateway",gateway="agentgateway-system/mcp-gateway",listener="mcp",route="agentgateway-system/mcp-route",route_rule="unknown"} 1
However, if you want to collect more distinct information within a tracing tool using an OTel collector, you can use CEL expressions to specify what you want exported:
  - name: mcp.tool_name
    expression: 'default(mcp.tool.name, "")'
  - name: mcp.tool_target
    expression: 'default(mcp.tool.target, "")'
  - name: mcp.method_name
    expression: 'default(mcp.methodName, "")'
Agentgateway emits base traces, but with the above, you can enrich the trace output with MCP-specific details.
In the next section, you will set up an agentgateway configuration with MCP so the traces can be viewed within an observability tool.
Gateway and MCP Setup
With some theory on the "how" and the "why" done, let's get hands-on and see how to set your gateway and MCP Server up.
- Create a new Gateway using the agentgateway Gateway Class.
kubectl apply -f - <<EOF
apiVersion: gateway.networking.k8s.io/v1
kind: Gateway
metadata:
  name: mcp-gateway
  namespace: agentgateway-system
  labels:
    app: github-mcp-server
spec:
  gatewayClassName: agentgateway
  listeners:
    - name: mcp
      port: 3000
      protocol: HTTP
      allowedRoutes:
        namespaces:
          from: Same
EOF
- Create a secret to authenticate with the GitHub Copilot MCP Server.
export GITHUB_PAT=

kubectl apply -f - <<EOF
apiVersion: v1
kind: Secret
metadata:
  name: github-pat
  namespace: agentgateway-system
type: Opaque
stringData:
  Authorization: "Bearer ${GITHUB_PAT}"
EOF
- Create an agentgatewaybackend, which tells the Gateway to route to the GitHub Copilot MCP Server.
kubectl apply -f - <<EOF
apiVersion: agentgateway.dev/v1alpha1
kind: AgentgatewayBackend
metadata:
  name: github-mcp-server
  namespace: agentgateway-system
spec:
  mcp:
    targets:
      - name: github-copilot
        static:
          host: api.githubcopilot.com
          port: 443
          path: /mcp/
          protocol: StreamableHTTP
          policies:
            tls: {}
            auth:
              secretRef:
                name: github-pat
EOF
- Create an HTTPRoute with the agentgatewaybackend as the reference/target.
kubectl apply -f - <<EOF
apiVersion: gateway.networking.k8s.io/v1
kind: HTTPRoute
metadata:
  name: mcp-route
  namespace: agentgateway-system
  labels:
    app: github-mcp-server
spec:
  parentRefs:
    - name: mcp-gateway
  rules:
    - matches:
        - path:
            type: PathPrefix
            value: /mcp
      backendRefs:
        - name: github-mcp-server
          namespace: agentgateway-system
          group: agentgateway.dev
          kind: AgentgatewayBackend
EOF
With the Gateway configured, let's do a test to ensure that the MCP Server can be connected to.
Quick Test
- Retrieve your gateways ALB IP address. If you're running a k8s cluster locally, you may not have this, so you can instead us
localhostwherever$GATEWAY_IPis used.
export GATEWAY_IP=$(kubectl get svc mcp-gateway -n agentgateway-system -o jsonpath='{.status.loadBalancer.ingress[0].ip}')
echo $GATEWAY_IP
- Open MCP Inspector, which is a popular MCP client.
npx modelcontextprotocol/inspector#0.18.0
You should be able to see the list of tools within the GitHub Copilot MCP Server.
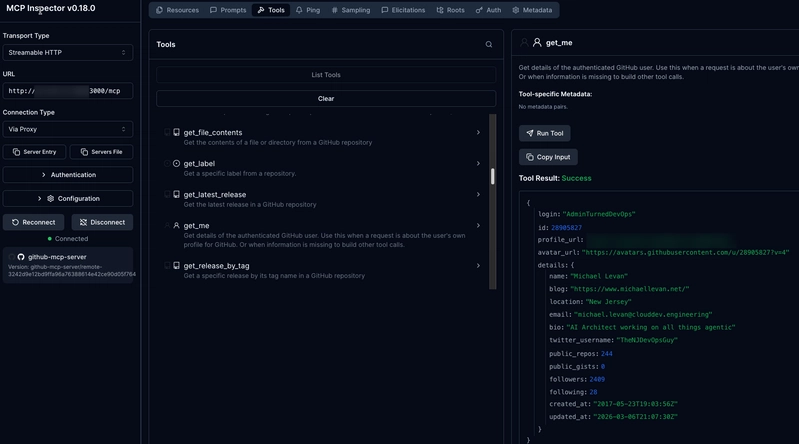
Now that we know the MCP Server works as expected, let's set up the observability configuration.
Observability Setup
With the Gateway and MCP Server configured and connection tested, it's time to set up the tracing mechanism along with the OTel collector and the ability to view the traces visually. This section will cover how to set up tempo, an OTel tracing collector, and kube-prometheus.
- Install Tempo.
helm upgrade --install tempo tempo \
  --repo https://grafana.github.io/helm-charts \
  --version 1.16.0 \
  --namespace telemetry \
  --create-namespace \
  --values - <<EOF
persistence:
  enabled: false
tempo:
  receivers:
    otlp:
      protocols:
        grpc:
          endpoint: 0.0.0.0:4317
EOF
- Install the OTel traces collector.
helm upgrade --install opentelemetry-collector-traces opentelemetry-collector \
  --repo https://open-telemetry.github.io/opentelemetry-helm-charts \
  --version 0.127.2 \
  --set mode=deployment \
  --set image.repository="otel/opentelemetry-collector-contrib" \
  --set command.name="otelcol-contrib" \
  --namespace telemetry \
  --create-namespace \
  -f - <<EOF
config:
  receivers:
    otlp:
      protocols:
        grpc:
          endpoint: 0.0.0.0:4317
        http:
          endpoint: 0.0.0.0:4318
  exporters:
    otlp/tempo:
      endpoint: http://tempo.telemetry.svc.cluster.local:4317
      tls:
        insecure: true
    debug:
      verbosity: detailed
  service:
    pipelines:
      traces:
        receivers: [otlp]
        processors: [batch]
        exporters: [debug, otlp/tempo]
EOF
- Install Grafana with Tempo as the data source.
helm upgrade --install kube-prometheus-stack kube-prometheus-stack \
  --repo https://prometheus-community.github.io/helm-charts \
  --namespace telemetry \
  --create-namespace \
  --values - <<EOF
alertmanager:
  enabled: false
prometheus:
  prometheusSpec:
    enableRemoteWriteReceiver: true
grafana:
  enabled: true
  datasources:
    datasources.yaml:
      apiVersion: 1
      datasources:
      - name: Prometheus
        type: prometheus
        uid: prometheus
        access: proxy
        url: http://kube-prometheus-stack-prometheus.telemetry:9090
      - name: Tempo
        type: tempo
        uid: tempo
        access: proxy
        url: http://tempo.telemetry.svc.cluster.local:3100
EOF
- Because agentgateway and the OTel collector are in different namespaces, the Kubernetes Gateway API requires a reference grant.
kubectl apply -f - <<EOF
apiVersion: gateway.networking.k8s.io/v1beta1
kind: ReferenceGrant
metadata:
  name: allow-otel-collector-traces-access
  namespace: telemetry
spec:
  from:
  - group: agentgateway.dev
    kind: AgentgatewayPolicy
    namespace: agentgateway-system
  to:
  - group: ""
    kind: Service
    name: opentelemetry-collector-traces
EOF
- Enable traces on the MCP Gateway and use CEL to add the attributes you want within the trace so you can get a visual representation of the MCP Server tool call.
kubectl apply -f - <<EOF
apiVersion: agentgateway.dev/v1alpha1
kind: AgentgatewayPolicy
metadata:
  name: mcp-tracing
  namespace: agentgateway-system
spec:
  targetRefs:
  - group: gateway.networking.k8s.io
    kind: Gateway
    name: mcp-gateway
  frontend:
    tracing:
      backendRef:
        name: opentelemetry-collector-traces
        namespace: telemetry
        port: 4317
      protocol: GRPC
      clientSampling: "true"
      randomSampling: "true"
      resources:
      - name: service.name
        expression: '"agentgateway-mcp"'
      - name: deployment.environment.name
        expression: '"development"'
      attributes:
        add:
        - name: mcp.method_name
          expression: 'default(mcp.methodName, "")'
        - name: mcp.session_id
          expression: 'default(mcp.sessionId, "")'
        - name: mcp.tool_name
          expression: 'default(mcp.tool.name, "")'
        - name: mcp.tool_target
          expression: 'default(mcp.tool.target, "")'
        - name: backend.name
          expression: 'default(backend.name, "")'
        - name: backend.type
          expression: 'default(backend.type, "")'
    accessLog:
      attributes:
        add:
        - name: mcp.tool_name
          expression: 'default(mcp.tool.name, "")'
        - name: mcp.tool_target
          expression: 'default(mcp.tool.target, "")'
        - name: mcp.method_name
          expression: 'default(mcp.methodName, "")'
EOF
You now have everything you need to capture MCP Server and tool traces.
Run A Tool Call
In the previous section, you installed and configured tracing to work for your MCP Gateway. Now, it's time to put it to the test and look at some traces along with seeing them visually.
- Run the following command. This pulls the last 100 logs from your OTel tracing collector.
kubectl logs -n telemetry -l app.kubernetes.io/instance=opentelemetry-collector-traces --tail=100
- Once you run the above, you will see the following:
InstrumentationScope agentgateway
Span #0
    Trace ID       : 2aba28785b334fd105f4c2b4dee2b6f5
    Parent ID      :
    ID             : e93f58c47c723d77
    Name           : POST /mcp/*
    Kind           : Server
    Start time     : 2026-04-25 23:44:23.281302662 +0000 UTC
    End time       : 2026-04-25 23:44:23.4975073 +0000 UTC
    Status code    : Unset
    Status message :
Attributes:
     -> gateway: Str(agentgateway-system/mcp-gateway)
     -> listener: Str(mcp)
     -> route: Str(agentgateway-system/mcp-route)
     -> src.addr: Str(10.224.0.62:36759)
     -> http.method: Str(POST)
     -> http.host: Str(52.225.32.209)
     -> http.path: Str(/mcp)
     -> http.version: Str(HTTP/1.1)
     -> http.status: Int(200)
     -> trace.id: Str(2aba28785b334fd105f4c2b4dee2b6f5)
     -> span.id: Str(e93f58c47c723d77)
     -> protocol: Str(mcp)
     -> mcp.method.name: Str(tools/call)
     -> mcp.target: Str(github-copilot)
     -> mcp.resource.type: Str(tool)
     -> mcp.session.id: Str(vzMGQa/WpW6P/rAJ57/rpM3Wl+so/kCXVV8oWkdPBc6hwIgTLGjd5eOgZ9XC1JCRtjBsQwMZnTAUdPR+YFvYdYadKTJVPrH85YllyUdxGXvDDAmX+HkjmuvfPNNu9wcyEWc6DlyoHFJPANq2/vct)
     -> duration: Str(216ms)
     -> url.scheme: Str(http)
     -> network.protocol.version: Str(1.1)
     -> mcp.method_name: Str(tools/call)
     -> mcp.session_id: Str(vzMGQa/WpW6P/rAJ57/rpM3Wl+so/kCXVV8oWkdPBc6hwIgTLGjd5eOgZ9XC1JCRtjBsQwMZnTAUdPR+YFvYdYadKTJVPrH85YllyUdxGXvDDAmX+HkjmuvfPNNu9wcyEWc6DlyoHFJPANq2/vct)
     -> mcp.tool_name: Str(get_me)
     -> mcp.tool_target: Str(github-copilot)
     -> backend.name: Str(agentgateway-system/github-mcp-server)
     -> backend.type: Str(mcp)
Notice how everything and anything you can think of in terms of "how do I observe an MCP Server tool call" is with the log.
You can also view them from a dashboard.
To view the traces in Grafana, do the following:
- Port-forward the Grafana service:
kubectl --namespace telemetry port-forward svc/kube-prometheus-stack-grafana 3000 - Open
http://localhost:3000 - Log in with username
adminand the password is underkubectl get secret kube-prometheus-stack-grafana -n telemetry -o jsonpath='{.data.admin-password}' | base64 --decode
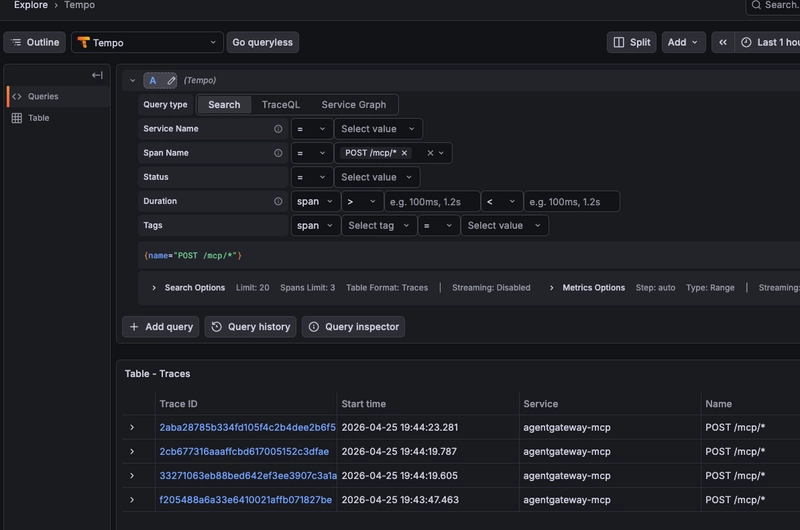
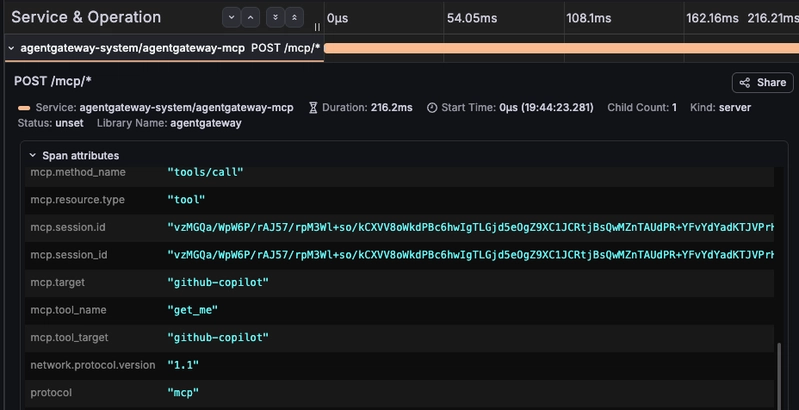
Once logged in, if you go to the traces view under Explore -> Tempo, you can see your MCP Server tool calls.
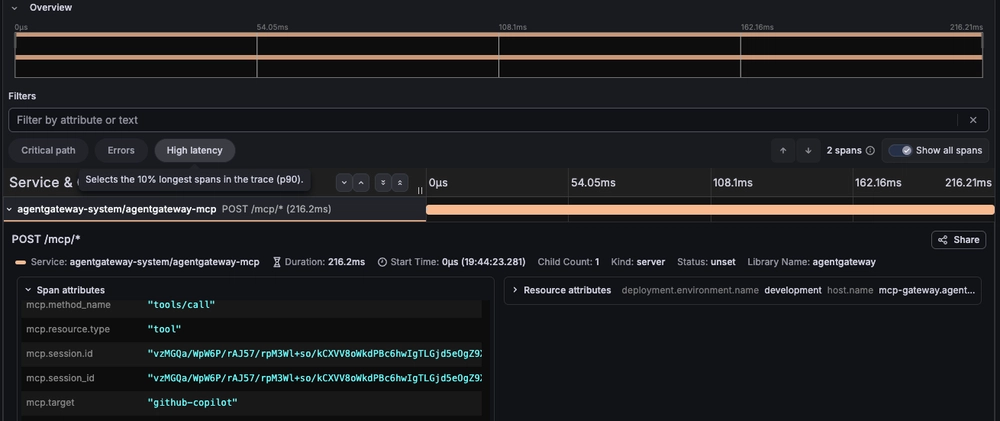
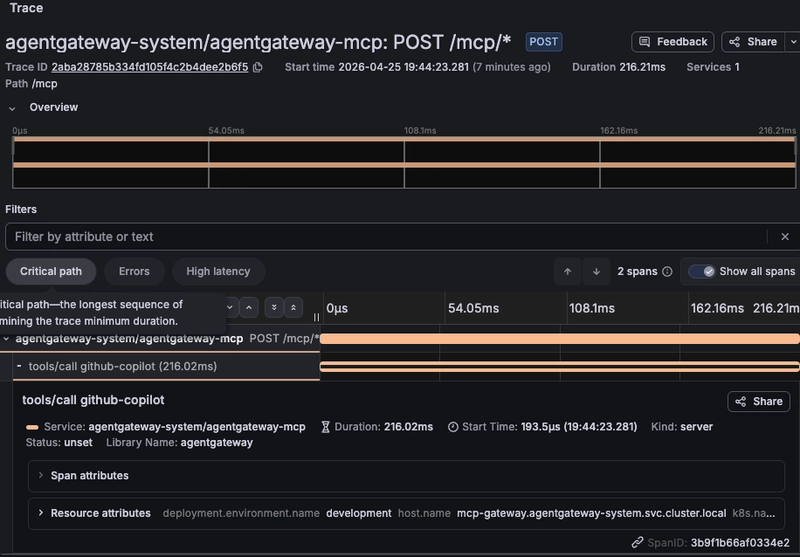
And if you dive into the span, you can see everything from the tool name to the session ID. This is a collection of everything you'd need to know to follow the trace of a tool call from your Agent.
Wrapping Up
Observability and tracking MCP Server tool calls isn't about putting red tape in front of MCP. Yes, you need to secure MCP Servers and the tools that an Agent is being called. There is definitely no debating that. What you also need, however, is the ability to ensure that an Agent actually called the right tool and collect/log the information of an Agent call for auditing and tracking purposes. MCP Servers are "black boxes" and so is just about everything else in AI, but if you set up proper tracing, you can have an understanding of what's going on within the system in production.