



Like I stated in my previous article How Excel is Used in Real-World Data Analysis, I'm on a learning journey. The next data analysis tool to be added to my toolkit is 'you guessed it!' Power BI. The last 2 weeks, have been eye-opening. I have learned that in addition to Excel (still a vital tool), there exists other tools that can do similar but better job. Below, I'll be explaining some concepts I have learned so far that could benefit your learning journey as well.
Data Modeling: What is it?
A Data Model is a visual representation of how data will be organized and stored in a database. It's like a map that shows what data is stored in each table and how they are connected or related to each other.
Data Modeling is the process of creating the 'map' and connecting the different data sources, defining how they relate to one another and organizing them into a structure that supports analysis.
How is a Data Model Created?
I will illustrate the process using a dataset that will hopefully help us better understand what a Data Model and Data Modeling is.
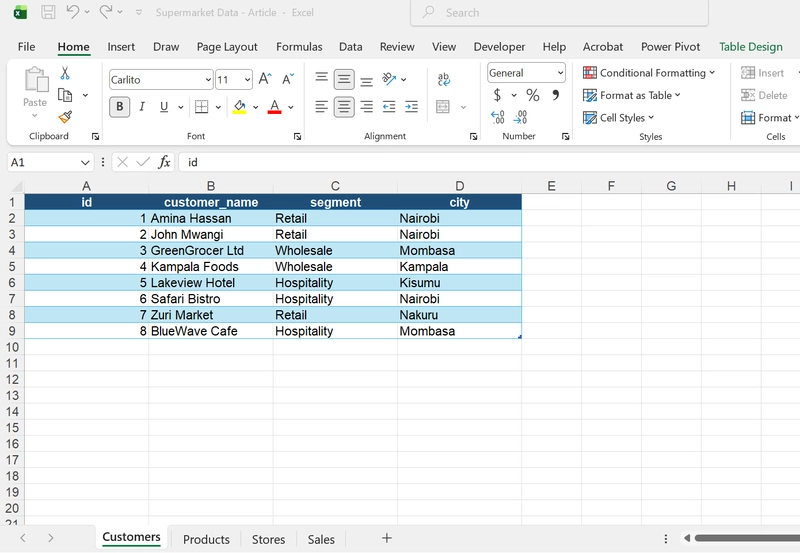
Below is a representation of what the dataset looks like in Excel. It contains multiple tables(customers, products, stores, sales) in different worksheets.
There are three methods used in Power BI:
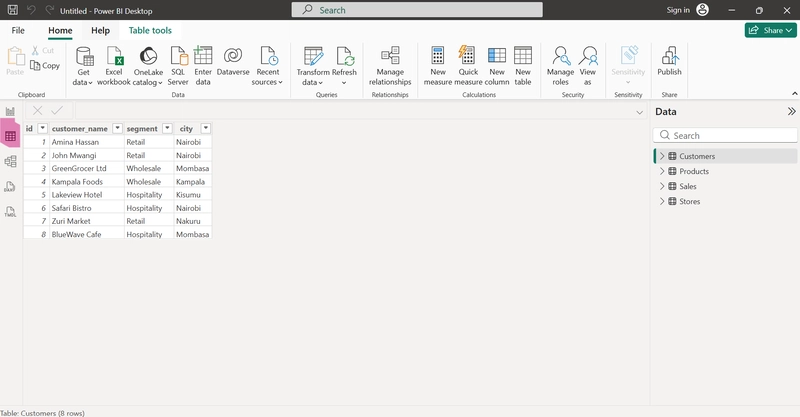
Table View (highlighted in the picture): We start with loading our data into Power BI by opening a blank report and load our workbook using the Get Data command found in the ribbon. (we assume we have a clean dataset if not use the transform button to clean your dataset first then build your model)

Once your dataset is loaded, we can now begin building our Data Model using the Manage Relationships features seen on the ribbon
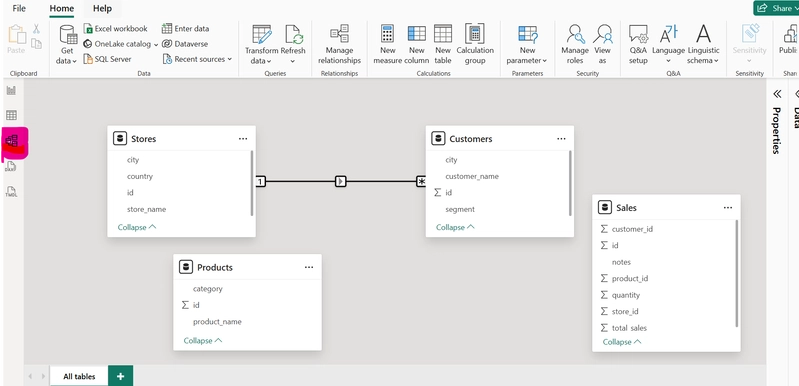
Model View (highlighted in the picture): We can also use the Manage Relationships feature under this set up to build our model.
Below is a snapshot what our model looks like before establishing the relationships between the tables.
This is how we 'Manage Relationships' between our tables. Once you click on the manage relationships feature, a pop out will appear with a large green button written '+New Relationship', click on it and below is what you should see.
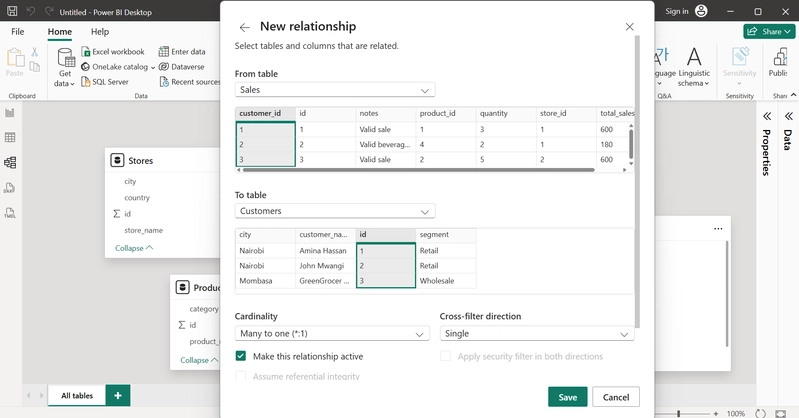
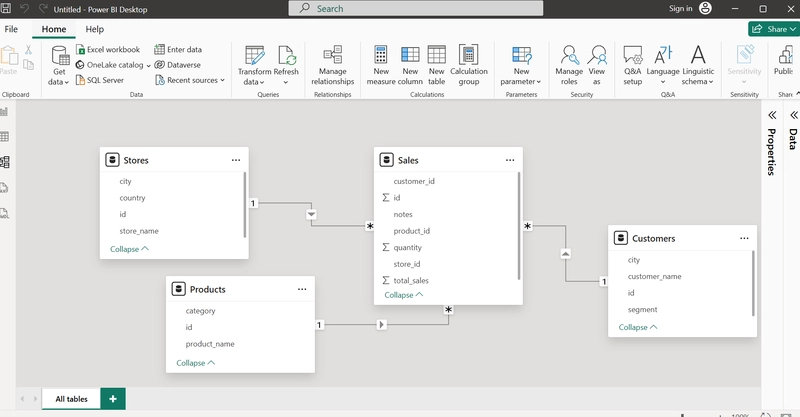
From our example, we are establishing the relationship between the sales table and the customers table by selecting their shared column which is the ID columns. After doing the same with the rest of the tables this is our output:
The Data Model
Report View (the icon above the table view icon I've highlighted in the snapshot above): You can also Manage relationships from there and build your model.
Joins
These are methods used to combine rows in tables based on related columns. In Power BI, they are executed using the Merge Queries Command in Power Query.

Different types of Joins in Power BI explained:
- Left Outer Join: This is the most common join type. It will keep all rows in your left table and match with the ones from your right table. In the Merge queries pop up window, look at the very bottom to see how many rows have been matched. If it's less than the total rows, it means there are extra rows in the left table that do not exist in the right table and will return as null.
- Right Outer Join: This join merges tables by retaining all the rows in the right table and matching them to the related rows in the left table. In this case, whatever is in the left table that does not exist in the right table will return as null in the left table.
- Full Outer Join: This join merges both the left and right table by keeping all the rows. Whatever row is missing in the right table will return as null, and if there is a match the rows are combined. The same happens in the left table.
- Inner Join: It combines the left and right tables by matching exact rows therefore, reducing the number rows in the final table.
- Left Anti Join: This join checks for matches and only returns the rows in the left table that don't match with the right table.
- Right Anti Join: This join also checks for matches from the right table to the left table and will return the rows from the right table that don't match with the rows left table.
Relationships
In Power Bi, Relationships refer to the links or connections between tables. This is how Power BI is able to know which table is related to which via a common column.
Types of relationships:
- 1:M - This is a One to Many relationship, meaning one table links to many other tables. From our model view above you can see that the sales table is linked to the other 3 tables. This is the most common relationship and can also be termed as a Many to One. This also enables smooth aggregation of data when it comes to analysis.
- M:M - This is a Many to Many relationship, meaning multiple fields in one table are related to multiple fields in another table. This could cause errors during calculations and so it's best to avoid it.
- 1:1 - This is a One to One relationship, meaning one table is connected to another table via a related column. This is rare to occur.
- Active vs Inactive - You can have multiple relationships between tables. By default Power BI will use the active relationship every time you are conducting your analysis. For the inactive relationship to be used, you must manually instruct power bi to do so.
- Cardinality - This defines the nature of relationships between tables [1:M, M:M or 1:1].
-
Cross-filter direction -This is a feature in Power BI that determines how filters will affect the data in your related tables. There are two types of cross-direction filters:
- Single direction: This filter only moves in one direction from the main table to the other tables connected to it but not the other way around, meaning that when you apply a filter in your secondary table, it will not affect the main table.
- Bidirectional: This filter moves both ways from the main table to the secondary tables and vice versa.
The difference between Joins and Relationships is that, Joins literally combines tables into one big table and Relationships show you how the tables are connected but it keeps them separate.
Schemas
Star Schema is a data model with a central table and several lookup tables, like in our data model. The sales table is our central table and the customers, products, stores are our lookup tables. The central table is also known as a Facts tables. This is because it contains facts that can be measured(quantitative data) like quantity sold, price, stock levels etc. The lookup tables are also known as Dimension tables. They give context to the facts tables meaning they contain descriptive information(qualitative data) like names, cities, categories, email addresses etc.
Snowflake Schema is a data model where the dimension tables also have dimension tables(sub-dimensions). One way to do it is by extending the dimensions tables in a star schema.
Flat Table (DLAT) - This is a table that contains all the information, what is supposed to be in the facts table and dimension tables is combined in a single table. For example, a single excel worksheet with all business information acting as its database.
Key points to note is to always use cleaned data before building your data model. This can easily be done using power query, you don't have to use excel. Use a star schema, it's easy to comprehend relationships between the tables and avoid many to many relationships as this could complicate computations and lead to errors.