








Your GPU utilization dashboard reads 40%. The cluster is healthy. The GPUs are loaded.
Except they're not working.
That 40% is a peak average across a monitoring window. It doesn't show the forty minutes after the spike when the inference queue drained and the cluster sat fully provisioned against a trickle of requests two nodes could have handled.
The cluster isn't underutilized. It's mispriced against actual demand.
That's a different problem with a different root cause — and the mistake that created it didn't happen in your scheduler. It happened at design time.
Why GPU Utilization Numbers Lie
Most monitoring platforms conflate two things with almost nothing in common: memory residency and compute activity.
A GPU can be fully loaded — model weights resident, tensors staged, inference engine warm — and simultaneously producing zero output. The Kubernetes GPU resource model treats GPU allocation as binary: assigned or not. There's no native distinction between memory-resident and compute-active states.
The hardware is occupied. No work is being done.
Loaded ≠ Active.
A model resident in VRAM is not a GPU doing work. It's a GPU holding a reservation. Most teams treat model-loaded status as GPU-in-use status and provision accordingly. That single assumption is responsible for more mispriced AI capacity than any scheduling inefficiency or orchestration gap.
The Three GPU Utilization Idle Modes
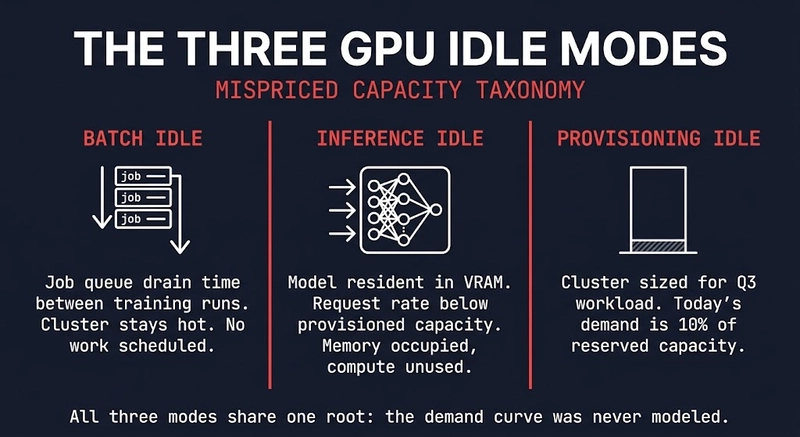
Not all idle compute is the same problem. Before you can fix the architecture, you need to name which mode you're in.
Batch Idle — The gap between training runs. The cluster stays hot between jobs because cold startup costs are high. That gap, multiplied across a training schedule, is pure idle compute priced at full cluster cost.
Inference Idle — The model is loaded. The inference engine is warm. Requests are arriving — just not at the rate the cluster was sized for. GPU utilization metrics show the GPUs as occupied. The memory utilization is real. The compute utilization is not.
Provisioning Idle — The earliest failure and the most expensive one over time. The cluster was sized for a workload that hasn't arrived yet. Peak inference demand for Q3. The large model run that's six weeks out. The hardware is live, the cost is running, and the demand it was priced against exists only in a planning document.
All three modes share one root cause: the demand curve was never modeled correctly.
This Was a Forecasting Failure
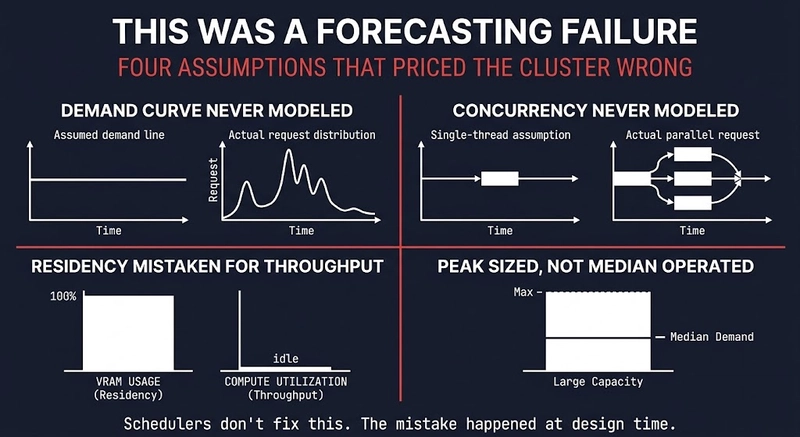
The framing that gets used for this problem is utilization. The fix must be better scheduling, better bin-packing, better autoscaling. That framing is wrong.
Low utilization is an output. The input was a provisioning decision made without adequate demand modeling.
Here's what the forecasting actually missed:
- The demand curve was never modeled. Teams provisioned for theoretical peak without modeling actual request distribution across a typical operating window. Peak is real. It is also rare.
- Concurrency was assumed, not measured. Most provisioning decisions are made against a single-request mental model — how fast can the cluster serve one request — rather than against a concurrent request distribution.
- Residency was mistaken for throughput. A GPU holding a 70B parameter model in VRAM is not a GPU running at capacity. It's a GPU with a very expensive reservation.
- Runtime limits were never set. Without execution budgets, the cluster expands to fill whatever headroom exists — and headroom was built in generously because the demand model was peak-anchored. Most teams never modeled the demand curve. They sized for theoretical peak, provisioned for future concurrency, and treated loaded memory as active work.
Did you model request concurrency before you provisioned — or did you just size for the busiest hour you could imagine?
What the Math Actually Looks Like
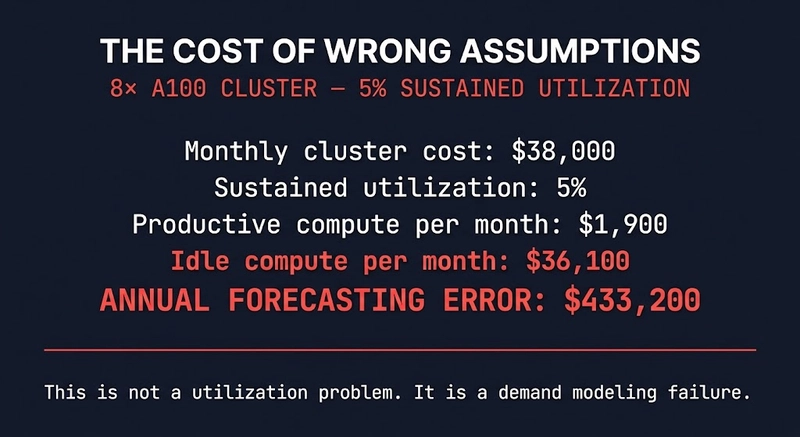
An 8× A100 cluster runs approximately $38,000/month in total cost of ownership. At 5% sustained utilization:
Monthly cluster cost:     $38,000
Sustained utilization:        5%
Productive compute/month:  $1,900
Idle compute/month:       $36,100

Annual forecasting error: $433,200
This is not a slightly inefficient cluster. It's a six-figure architecture constraint that compounds every month the provisioning assumption goes uncorrected.
This Is an Architecture Problem, Not a Scheduling Problem
The standard response to low GPU utilization is a scheduling intervention: deploy Volcano, tune KEDA, implement DCGM-based autoscaling.
These are real tools. They solve real problems. They do not fix this one.
Schedulers optimize execution of work that has been correctly provisioned for. What they cannot do is retroactively correct a demand model that was wrong at design time. If the cluster was provisioned for 10× the actual sustained request rate, a better scheduler produces a more efficiently idle cluster.
Schedulers can distribute work. They cannot fix demand you modeled incorrectly.
That fix happens before the cluster exists. It happens at design time, against a demand curve someone actually drew.
Architect's Verdict
The gpu utilization problem is not a utilization problem. It's a forecasting problem that manifests as gpu utilization data, gets diagnosed as a scheduling problem, and gets treated with tooling that addresses the symptom while the root cause compounds every billing cycle.
The central mistake is a category error: treating memory residency as compute activity. Every GPU idle mode — batch, inference, provisioning — traces back to a demand curve that was never drawn or was drawn incorrectly against theoretical maximums that rarely materialize in production.
The teams that solve this aren't running more sophisticated schedulers. They're provisioning against actual request distributions, modeling concurrency from measurement rather than assumption, and treating loaded memory as exactly what it is: an expensive placeholder.
Fix the demand model first. Everything else is optimization on top of a correctly sized foundation.
Originally published at rack2cloud.com