





Your GitHub contribution graph is flat and green. Mine is an isometric skyline.
I built Isometric Contributions — a free API that renders your GitHub activity as a 3D isometric city, ready to drop into your README or portfolio with a single <img> tag.
Project Links:
What it looks like
Sample:
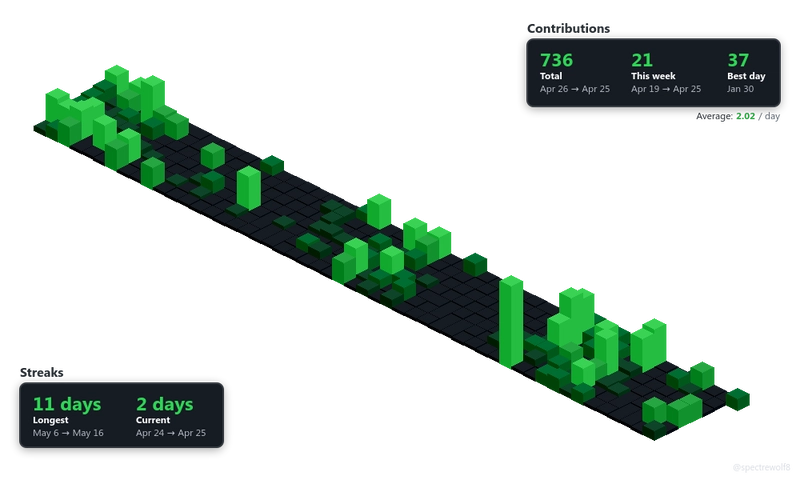
It also comes with six themes, all generated server-side as crisp PNG images:
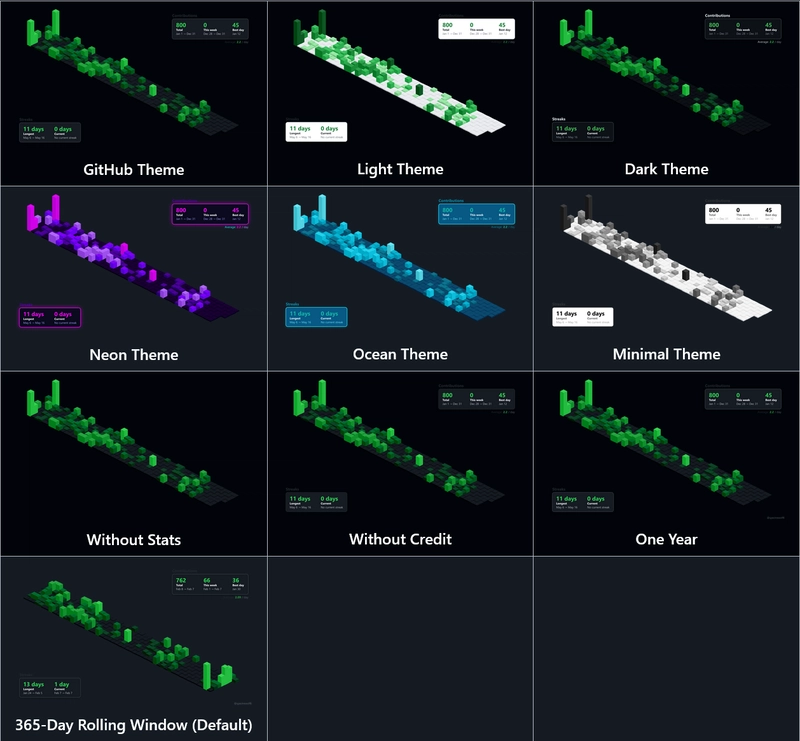
-
github- Classic green on dark -
dark- Sleek dark palette -
light- Clean white background -
neon- Cyberpunk glow -
minimal- Quiet and understated -
ocean- Deep blue tones
You can also add a stats overlay showing your total contributions, current streak, longest streak, best day, and daily average — all baked right into the image.
Using it in 30 seconds
Drop this into your GitHub profile README and you're done:

That's it. No tokens, no setup, no dependencies on your end.
All the options
GET /api/graph
| Parameter | Default | Description |
|---|---|---|
username |
required | Your GitHub username |
theme |
github |
github · dark · light · neon · minimal · ocean
|
year |
none |
Specific year like 2024, or none for the last 365 days |
stats |
false |
Set to true to include the stats overlay |
credit |
false |
Set to true to show your username watermark |
width |
1000 |
Image width in px |
height |
600 |
Image height in px |
Some examples:
# Last 365 days, neon theme, with stats
/api/graph?username=torvalds&theme=neon&stats=true

# Specific year, wide format
/api/graph?username=torvalds&year=2023&width=1400&height=700

# Minimal, no extras
/api/graph?username=torvalds&theme=minimal
How it works under the hood
The stack is intentionally small — no framework, just Node.js.
Data: GitHub's official GraphQL contributionsCollection API. Each query fetches up to 365 days of contribution data with contribution counts, levels, and dates. Requests retry automatically up to 3 times with exponential backoff.
Rendering: obelisk.js handles the isometric projection math, running inside a JSDOM environment on the server. node-canvas provides the actual pixel buffer. Each day becomes a cube whose height is proportional to that day's contribution count.
Caching: Generated images are cached in Supabase Storage keyed by date/username/params. The same image is served instantly on repeat requests throughout the day without hitting the GitHub API or re-rendering. Images with suspiciously low data (a signal the API returned partial results) are intentionally not cached, so the next request gets a fresh attempt.
Output: A raw PNG buffer streamed directly as the HTTP response with Content-Type: image/png — which is exactly what <img src="..."> expects.
Self-hosting
Want to run your own instance?
git clone https://github.com/Spectrewolf8/isometric-contributions-embeds
cd isometric-contributions
npm install
Set up your .env:
GITHUB_TOKEN=ghp_yourtoken        # PAT with no scopes needed for public data
SUPABASE_URL=https://xxx.supabase.co
SUPABASE_ANON_KEY=your_anon_key
SUPABASE_BUCKET_NAME=isometric-cache
npm run server
On startup, the server verifies your GitHub token and prints which account it's authenticated as, so you know immediately if something's wrong.
Deploy to Render, Railway, or any Docker-capable host — a Dockerfile is included.
What's next
A few things I want to add:
- SVG output so the graph can scale infinitely
- Custom color schemes via query params instead of fixed themes
- Animated version — a time-lapse that builds the city week by week
If any of those sound useful to you, or if you would like to add anything else, leave a comment — it helps me prioritize.
Built with Node.js, obelisk.js, node-canvas, and Supabase. Contributions welcome.