





For most of our users, the default usage and cost dashboards are sufficient. However, if you need more detailed data or a custom dashboard, you can use the Completions Usage API.
This notebook demonstrates how to retrieve and visualize usage data from the OpenAI Completions Usage API and Costs API. We’ll:
- Call the API to get completions usage data.
- Parse the JSON response into a pandas DataFrame.
- Visualize token usage over time using matplotlib.
- Use grouping by model to analyze token usage across different models.
- Display model distribution with a pie chart.
We also include placeholders for all possible API parameters for a comprehensive overview.
# Install required libraries (if not already installed)
!pip install requests pandas numpy matplotlib --quiet

# Import libraries
import requests
import pandas as pd
import numpy as np
import matplotlib.pyplot as plt
import matplotlib.patches as mpatches
import time
import json

# For inline plotting in Jupyter
%matplotlib inline
Set up an Admin Key - https://platform.openai.com/settings/organization/admin-keys
Replace 'PLACEHOLDER' with your actual ADMIN API key. It’s best practice to load the key from an environment variable for security.
# Reusable function for retrieving paginated data from the API
def get_data(url, params):
    # Set up the API key and headers
    OPENAI_ADMIN_KEY = 'PLACEHOLDER'

    headers = {
        "Authorization": f"Bearer {OPENAI_ADMIN_KEY}",
        "Content-Type": "application/json",
    }

    # Initialize an empty list to store all data
    all_data = []

    # Initialize pagination cursor
    page_cursor = None

    # Loop to handle pagination
    while True:
        if page_cursor:
            params["page"] = page_cursor

        response = requests.get(url, headers=headers, params=params)

        if response.status_code == 200:
            data_json = response.json()
            all_data.extend(data_json.get("data", []))

            page_cursor = data_json.get("next_page")
            if not page_cursor:
                break
        else:
            print(f"Error: {response.status_code}")
            break

    if all_data:
        print("Data retrieved successfully!")
    else:
        print("Issue: No data available to retrieve.")
    return all_data
# Define the API endpoint
url = "https://api.openai.com/v1/organization/usage/completions"
# Calculate start time: n days ago from now
days_ago = 30
start_time = int(time.time()) - (days_ago * 24 * 60 * 60)
# Define parameters with placeholders for all possible options
params = {
"start_time": start_time, # Required: Start time (Unix seconds)
# "end_time": end_time, # Optional: End time (Unix seconds)
"bucket_width": "1d", # Optional: '1m', '1h', or '1d' (default '1d')
# "project_ids": ["proj_example"], # Optional: List of project IDs
# "user_ids": ["user_example"], # Optional: List of user IDs
# "api_key_ids": ["key_example"], # Optional: List of API key IDs
# "models": ["o1-2024-12-17", "gpt-4o-2024-08-06", "gpt-4o-mini-2024-07-18"], # Optional: List of models
# "batch": False, # Optional: True for batch jobs, False for non-batch
# "group_by": ["model"], # Optional: Fields to group by
"limit": 7, # Optional: Number of buckets to return, this will chunk the data into 7 buckets
# "page": "cursor_string" # Optional: Cursor for pagination
}
usage_data = get_data(url, params)Data retrieved successfully!Let’s take a look at the raw JSON response from the API to understand its structure.
print(json.dumps(usage_data, indent=2))[
{
"object": "bucket",
"start_time": 1736616660,
"end_time": 1736640000,
"results": [
{
"object": "organization.usage.completions.result",
"input_tokens": 141201,
"output_tokens": 9756,
"num_model_requests": 470,
"project_id": null,
"user_id": null,
"api_key_id": null,
"model": null,
"batch": null,
"input_cached_tokens": 0,
"input_audio_tokens": 0,
"output_audio_tokens": 0
}
]
},
{
"object": "bucket",
"start_time": 1736640000,
"end_time": 1736726400,
"results": [
{
"object": "organization.usage.completions.result",
"input_tokens": 45949,
"output_tokens": 282,
"num_model_requests": 150,
"project_id": null,
"user_id": null,
"api_key_id": null,
"model": null,
"batch": null,
"input_cached_tokens": 0,
"input_audio_tokens": 0,
"output_audio_tokens": 0
}
]
},
{
"object": "bucket",
"start_time": 1736726400,
"end_time": 1736812800,
"results": [
{
"object": "organization.usage.completions.result",
"input_tokens": 3718360,
"output_tokens": 97756,
"num_model_requests": 3053,
"project_id": null,
"user_id": null,
"api_key_id": null,
"model": null,
"batch": null,
"input_cached_tokens": 76544,
"input_audio_tokens": 5776,
"output_audio_tokens": 3166
}
]
},
{
"object": "bucket",
"start_time": 1736812800,
"end_time": 1736899200,
"results": [
{
"object": "organization.usage.completions.result",
"input_tokens": 52786,
"output_tokens": 38204,
"num_model_requests": 157,
"project_id": null,
"user_id": null,
"api_key_id": null,
"model": null,
"batch": null,
"input_cached_tokens": 5440,
"input_audio_tokens": 4066,
"output_audio_tokens": 1097
}
]
},
{
"object": "bucket",
"start_time": 1736899200,
"end_time": 1736985600,
"results": [
{
"object": "organization.usage.completions.result",
"input_tokens": 35664,
"output_tokens": 1835,
"num_model_requests": 55,
"project_id": null,
"user_id": null,
"api_key_id": null,
"model": null,
"batch": null,
"input_cached_tokens": 192,
"input_audio_tokens": 2520,
"output_audio_tokens": 1549
}
]
},
{
"object": "bucket",
"start_time": 1736985600,
"end_time": 1737072000,
"results": [
{
"object": "organization.usage.completions.result",
"input_tokens": 5464,
"output_tokens": 2667,
"num_model_requests": 8,
"project_id": null,
"user_id": null,
"api_key_id": null,
"model": null,
"batch": null,
"input_cached_tokens": 0,
"input_audio_tokens": 0,
"output_audio_tokens": 0
}
]
},
{
"object": "bucket",
"start_time": 1737072000,
"end_time": 1737158400,
"results": [
{
"object": "organization.usage.completions.result",
"input_tokens": 3390547,
"output_tokens": 38604,
"num_model_requests": 2687,
"project_id": null,
"user_id": null,
"api_key_id": null,
"model": null,
"batch": null,
"input_cached_tokens": 25344,
"input_audio_tokens": 0,
"output_audio_tokens": 0
}
]
},
{
"object": "bucket",
"start_time": 1737158400,
"end_time": 1737244800,
"results": [
{
"object": "organization.usage.completions.result",
"input_tokens": 8117824,
"output_tokens": 105662,
"num_model_requests": 6335,
"project_id": null,
"user_id": null,
"api_key_id": null,
"model": null,
"batch": null,
"input_cached_tokens": 46464,
"input_audio_tokens": 0,
"output_audio_tokens": 0
}
]
},
{
"object": "bucket",
"start_time": 1737244800,
"end_time": 1737331200,
"results": [
{
"object": "organization.usage.completions.result",
"input_tokens": 13542,
"output_tokens": 85,
"num_model_requests": 46,
"project_id": null,
"user_id": null,
"api_key_id": null,
"model": null,
"batch": null,
"input_cached_tokens": 0,
"input_audio_tokens": 0,
"output_audio_tokens": 0
}
]
},
{
"object": "bucket",
"start_time": 1737331200,
"end_time": 1737417600,
"results": []
},
{
"object": "bucket",
"start_time": 1737417600,
"end_time": 1737504000,
"results": [
{
"object": "organization.usage.completions.result",
"input_tokens": 29806,
"output_tokens": 57604,
"num_model_requests": 98,
"project_id": null,
"user_id": null,
"api_key_id": null,
"model": null,
"batch": null,
"input_cached_tokens": 0,
"input_audio_tokens": 0,
"output_audio_tokens": 0
}
]
},
{
"object": "bucket",
"start_time": 1737504000,
"end_time": 1737590400,
"results": [
{
"object": "organization.usage.completions.result",
"input_tokens": 1823,
"output_tokens": 1467,
"num_model_requests": 7,
"project_id": null,
"user_id": null,
"api_key_id": null,
"model": null,
"batch": null,
"input_cached_tokens": 0,
"input_audio_tokens": 0,
"output_audio_tokens": 0
}
]
},
{
"object": "bucket",
"start_time": 1737590400,
"end_time": 1737676800,
"results": [
{
"object": "organization.usage.completions.result",
"input_tokens": 7126,
"output_tokens": 1896,
"num_model_requests": 19,
"project_id": null,
"user_id": null,
"api_key_id": null,
"model": null,
"batch": null,
"input_cached_tokens": 0,
"input_audio_tokens": 0,
"output_audio_tokens": 0
}
]
},
{
"object": "bucket",
"start_time": 1737676800,
"end_time": 1737763200,
"results": [
{
"object": "organization.usage.completions.result",
"input_tokens": 22187,
"output_tokens": 822,
"num_model_requests": 75,
"project_id": null,
"user_id": null,
"api_key_id": null,
"model": null,
"batch": null,
"input_cached_tokens": 640,
"input_audio_tokens": 2557,
"output_audio_tokens": 3103
}
]
},
{
"object": "bucket",
"start_time": 1737763200,
"end_time": 1737849600,
"results": [
{
"object": "organization.usage.completions.result",
"input_tokens": 30204,
"output_tokens": 65673,
"num_model_requests": 99,
"project_id": null,
"user_id": null,
"api_key_id": null,
"model": null,
"batch": null,
"input_cached_tokens": 0,
"input_audio_tokens": 0,
"output_audio_tokens": 0
}
]
},
{
"object": "bucket",
"start_time": 1737849600,
"end_time": 1737936000,
"results": []
},
{
"object": "bucket",
"start_time": 1737936000,
"end_time": 1738022400,
"results": []
},
{
"object": "bucket",
"start_time": 1738022400,
"end_time": 1738108800,
"results": [
{
"object": "organization.usage.completions.result",
"input_tokens": 2541,
"output_tokens": 1604,
"num_model_requests": 14,
"project_id": null,
"user_id": null,
"api_key_id": null,
"model": null,
"batch": null,
"input_cached_tokens": 0,
"input_audio_tokens": 0,
"output_audio_tokens": 0
}
]
},
{
"object": "bucket",
"start_time": 1738108800,
"end_time": 1738195200,
"results": [
{
"object": "organization.usage.completions.result",
"input_tokens": 68339,
"output_tokens": 49525,
"num_model_requests": 217,
"project_id": null,
"user_id": null,
"api_key_id": null,
"model": null,
"batch": null,
"input_cached_tokens": 7296,
"input_audio_tokens": 20033,
"output_audio_tokens": 3168
}
]
},
{
"object": "bucket",
"start_time": 1738195200,
"end_time": 1738281600,
"results": [
{
"object": "organization.usage.completions.result",
"input_tokens": 18481,
"output_tokens": 17500,
"num_model_requests": 84,
"project_id": null,
"user_id": null,
"api_key_id": null,
"model": null,
"batch": null,
"input_cached_tokens": 2944,
"input_audio_tokens": 10076,
"output_audio_tokens": 4966
}
]
},
{
"object": "bucket",
"start_time": 1738281600,
"end_time": 1738368000,
"results": [
{
"object": "organization.usage.completions.result",
"input_tokens": 1187894,
"output_tokens": 139134,
"num_model_requests": 5528,
"project_id": null,
"user_id": null,
"api_key_id": null,
"model": null,
"batch": null,
"input_cached_tokens": 2112,
"input_audio_tokens": 4935,
"output_audio_tokens": 993
}
]
},
{
"object": "bucket",
"start_time": 1738368000,
"end_time": 1738454400,
"results": []
},
{
"object": "bucket",
"start_time": 1738454400,
"end_time": 1738540800,
"results": [
{
"object": "organization.usage.completions.result",
"input_tokens": 7268,
"output_tokens": 30563,
"num_model_requests": 24,
"project_id": null,
"user_id": null,
"api_key_id": null,
"model": null,
"batch": null,
"input_cached_tokens": 0,
"input_audio_tokens": 0,
"output_audio_tokens": 0
}
]
},
{
"object": "bucket",
"start_time": 1738540800,
"end_time": 1738627200,
"results": [
{
"object": "organization.usage.completions.result",
"input_tokens": 15121,
"output_tokens": 22866,
"num_model_requests": 48,
"project_id": null,
"user_id": null,
"api_key_id": null,
"model": null,
"batch": null,
"input_cached_tokens": 0,
"input_audio_tokens": 0,
"output_audio_tokens": 0
}
]
},
{
"object": "bucket",
"start_time": 1738627200,
"end_time": 1738713600,
"results": [
{
"object": "organization.usage.completions.result",
"input_tokens": 16735,
"output_tokens": 16177,
"num_model_requests": 50,
"project_id": null,
"user_id": null,
"api_key_id": null,
"model": null,
"batch": null,
"input_cached_tokens": 1152,
"input_audio_tokens": 0,
"output_audio_tokens": 0
}
]
},
{
"object": "bucket",
"start_time": 1738713600,
"end_time": 1738800000,
"results": [
{
"object": "organization.usage.completions.result",
"input_tokens": 6573,
"output_tokens": 4238,
"num_model_requests": 43,
"project_id": null,
"user_id": null,
"api_key_id": null,
"model": null,
"batch": null,
"input_cached_tokens": 0,
"input_audio_tokens": 0,
"output_audio_tokens": 0
}
]
},
{
"object": "bucket",
"start_time": 1738800000,
"end_time": 1738886400,
"results": [
{
"object": "organization.usage.completions.result",
"input_tokens": 1402,
"output_tokens": 2042,
"num_model_requests": 18,
"project_id": null,
"user_id": null,
"api_key_id": null,
"model": null,
"batch": null,
"input_cached_tokens": 0,
"input_audio_tokens": 0,
"output_audio_tokens": 0
}
]
},
{
"object": "bucket",
"start_time": 1738886400,
"end_time": 1738972800,
"results": [
{
"object": "organization.usage.completions.result",
"input_tokens": 11847,
"output_tokens": 21938,
"num_model_requests": 47,
"project_id": null,
"user_id": null,
"api_key_id": null,
"model": null,
"batch": null,
"input_cached_tokens": 0,
"input_audio_tokens": 0,
"output_audio_tokens": 0
}
]
},
{
"object": "bucket",
"start_time": 1738972800,
"end_time": 1739059200,
"results": [
{
"object": "organization.usage.completions.result",
"input_tokens": 1993,
"output_tokens": 12,
"num_model_requests": 7,
"project_id": null,
"user_id": null,
"api_key_id": null,
"model": null,
"batch": null,
"input_cached_tokens": 0,
"input_audio_tokens": 0,
"output_audio_tokens": 0
}
]
},
{
"object": "bucket",
"start_time": 1739059200,
"end_time": 1739145600,
"results": []
},
{
"object": "bucket",
"start_time": 1739145600,
"end_time": 1739208663,
"results": [
{
"object": "organization.usage.completions.result",
"input_tokens": 332,
"output_tokens": 1509,
"num_model_requests": 8,
"project_id": null,
"user_id": null,
"api_key_id": null,
"model": null,
"batch": null,
"input_cached_tokens": 0,
"input_audio_tokens": 0,
"output_audio_tokens": 0
}
]
}
]Now we will parse the JSON data, extract relevant fields, and create a pandas DataFrame for easier manipulation and analysis.
# Initialize a list to hold parsed records
records = []

# Iterate through the data to extract bucketed data
for bucket in usage_data:
    start_time = bucket.get("start_time")
    end_time = bucket.get("end_time")
    for result in bucket.get("results", []):
        records.append(
            {
                "start_time": start_time,
                "end_time": end_time,
                "input_tokens": result.get("input_tokens", 0),
                "output_tokens": result.get("output_tokens", 0),
                "input_cached_tokens": result.get("input_cached_tokens", 0),
                "input_audio_tokens": result.get("input_audio_tokens", 0),
                "output_audio_tokens": result.get("output_audio_tokens", 0),
                "num_model_requests": result.get("num_model_requests", 0),
                "project_id": result.get("project_id"),
                "user_id": result.get("user_id"),
                "api_key_id": result.get("api_key_id"),
                "model": result.get("model"),
                "batch": result.get("batch"),
            }
        )

# Create a DataFrame from the records
df = pd.DataFrame(records)

# Convert Unix timestamps to datetime for readability
df["start_datetime"] = pd.to_datetime(df["start_time"], unit="s")
df["end_datetime"] = pd.to_datetime(df["end_time"], unit="s")

# Reorder columns for better readability
df = df[
    [
        "start_datetime",
        "end_datetime",
        "start_time",
        "end_time",
        "input_tokens",
        "output_tokens",
        "input_cached_tokens",
        "input_audio_tokens",
        "output_audio_tokens",
        "num_model_requests",
        "project_id",
        "user_id",
        "api_key_id",
        "model",
        "batch",
    ]
]

# Display the DataFrame
df.head()| start_datetime | end_datetime | start_time | end_time | input_tokens | output_tokens | input_cached_tokens | input_audio_tokens | output_audio_tokens | num_model_requests | project_id | user_id | api_key_id | model | batch | |
|---|---|---|---|---|---|---|---|---|---|---|---|---|---|---|---|
| 0 | 2025-01-11 17:31:00 | 2025-01-12 | 1736616660 | 1736640000 | 141201 | 9756 | 0 | 0 | 0 | 470 | None | None | None | None | None |
| 1 | 2025-01-12 00:00:00 | 2025-01-13 | 1736640000 | 1736726400 | 45949 | 282 | 0 | 0 | 0 | 150 | None | None | None | None | None |
| 2 | 2025-01-13 00:00:00 | 2025-01-14 | 1736726400 | 1736812800 | 3718360 | 97756 | 76544 | 5776 | 3166 | 3053 | None | None | None | None | None |
| 3 | 2025-01-14 00:00:00 | 2025-01-15 | 1736812800 | 1736899200 | 52786 | 38204 | 5440 | 4066 | 1097 | 157 | None | None | None | None | None |
| 4 | 2025-01-15 00:00:00 | 2025-01-16 | 1736899200 | 1736985600 | 35664 | 1835 | 192 | 2520 | 1549 | 55 | None | None | None | None | None |
We’ll create a bar chart to visualize input and output token usage for each time bucket.
if not df.empty:
    plt.figure(figsize=(12, 6))

    # Create bar charts for input and output tokens
    width = 0.35  # width of the bars
    indices = range(len(df))

    plt.bar(indices, df["input_tokens"], width=width, label="Input Tokens", alpha=0.7)
    plt.bar(
        [i + width for i in indices],
        df["output_tokens"],
        width=width,
        label="Output Tokens",
        alpha=0.7,
    )

    # Set labels and ticks
    plt.xlabel("Time Bucket")
    plt.ylabel("Number of Tokens")
    plt.title("Daily Input vs Output Token Usage Last 30 Days")
    plt.xticks(
        [i + width / 2 for i in indices],
        [dt.strftime("%Y-%m-%d") for dt in df["start_datetime"]],
        rotation=45,
    )
    plt.legend()
    plt.tight_layout()
    plt.show()
else:
    print("No data available to plot.")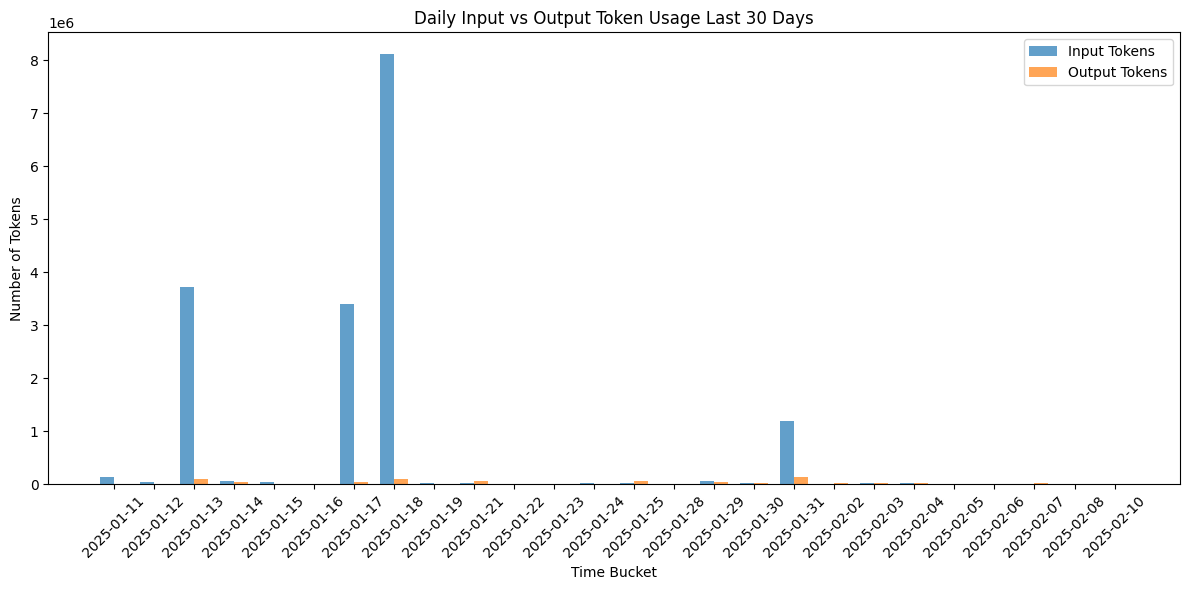
In this section, we retrieve and visualize usage data grouped by model and project_id. This can help you see the total tokens used by each model over the specified period.
Note on Grouping Parameter
-
If you do not specify a
group_byparameter, fields such asproject_id,model, and others will return asnull. Although thegroup_byparameter is optional, it is recommended to include it in most cases to retrieve meaningful data. -
You can specify multiple group fields by separating them with commas. For example:
group_by=["model", "project_id"].
# Calculate start time: n days ago from now
days_ago = 30
start_time = int(time.time()) - (days_ago * 24 * 60 * 60)

# Define parameters with grouping by model and project_id
params = {
    "start_time": start_time,  # Required: Start time (Unix seconds)
    "bucket_width": "1d",  # Optional: '1m', '1h', or '1d' (default '1d')
    "group_by": ["model", "project_id"],  # Group data by model and project_id
    "limit": 7,  # Optional: Number of buckets to return
}

# Initialize an empty list to store all data
all_group_data = get_data(url, params)

# Initialize a list to hold parsed records
records = []

# Iterate through the data to extract bucketed data
for bucket in all_group_data:
    start_time = bucket.get("start_time")
    end_time = bucket.get("end_time")
    for result in bucket.get("results", []):
        records.append(
            {
                "start_time": start_time,
                "end_time": end_time,
                "input_tokens": result.get("input_tokens", 0),
                "output_tokens": result.get("output_tokens", 0),
                "input_cached_tokens": result.get("input_cached_tokens", 0),
                "input_audio_tokens": result.get("input_audio_tokens", 0),
                "output_audio_tokens": result.get("output_audio_tokens", 0),
                "num_model_requests": result.get("num_model_requests", 0),
                "project_id": result.get("project_id", "N/A"),
                "user_id": result.get("user_id", "N/A"),
                "api_key_id": result.get("api_key_id", "N/A"),
                "model": result.get("model", "N/A"),
                "batch": result.get("batch", "N/A"),
            }
        )

# Create a DataFrame from the records
df = pd.DataFrame(records)

# Convert Unix timestamps to datetime for readability
df["start_datetime"] = pd.to_datetime(df["start_time"], unit="s", errors="coerce")
df["end_datetime"] = pd.to_datetime(df["end_time"], unit="s", errors="coerce")

# Reorder columns for better readability
df = df[
    [
        "start_datetime",
        "end_datetime",
        "start_time",
        "end_time",
        "input_tokens",
        "output_tokens",
        "input_cached_tokens",
        "input_audio_tokens",
        "output_audio_tokens",
        "num_model_requests",
        "project_id",
        "user_id",
        "api_key_id",
        "model",
        "batch",
    ]
]

# Display the DataFrame
df.head()
Data retrieved successfully!| start_datetime | end_datetime | start_time | end_time | input_tokens | output_tokens | input_cached_tokens | input_audio_tokens | output_audio_tokens | num_model_requests | project_id | user_id | api_key_id | model | batch | |
|---|---|---|---|---|---|---|---|---|---|---|---|---|---|---|---|
| 0 | 2025-01-11 17:31:39 | 2025-01-12 | 1736616699 | 1736640000 | 6897 | 97 | 0 | 0 | 0 | 97 | proj_hNhhQzyYu7HxySZWs7cA3Ugu | None | None | gpt-4o-mini-2024-07-18 | None |
| 1 | 2025-01-11 17:31:39 | 2025-01-12 | 1736616699 | 1736640000 | 33984 | 206 | 0 | 0 | 0 | 95 | proj_hNhhQzyYu7HxySZWs7cA3Ugu | None | None | ft:gpt-4o-2024-08-06:distillation-test:wordle2... | None |
| 2 | 2025-01-11 17:31:39 | 2025-01-12 | 1736616699 | 1736640000 | 2846 | 8874 | 0 | 0 | 0 | 8 | proj_hNhhQzyYu7HxySZWs7cA3Ugu | None | None | o1-mini-2024-09-12 | None |
| 3 | 2025-01-11 17:31:39 | 2025-01-12 | 1736616699 | 1736640000 | 97474 | 579 | 0 | 0 | 0 | 270 | proj_hNhhQzyYu7HxySZWs7cA3Ugu | None | None | gpt-4o-2024-08-06 | None |
| 4 | 2025-01-12 00:00:00 | 2025-01-13 | 1736640000 | 1736726400 | 1989 | 28 | 0 | 0 | 0 | 28 | proj_hNhhQzyYu7HxySZWs7cA3Ugu | None | None | gpt-4o-mini-2024-07-18 | None |
Now we will parse the JSON data, extract relevant fields, and create a pandas DataFrame for easier manipulation and analysis.
# Group data by model and project_id and aggregate model request counts
grouped_by_model_project = (
    df.groupby(["model", "project_id"])
    .agg(
        {
            "num_model_requests": "sum",
        }
    )
    .reset_index()
)

# Determine unique models and project IDs for plotting and color mapping
models = sorted(grouped_by_model_project["model"].unique())
project_ids = sorted(grouped_by_model_project["project_id"].unique())
distinct_colors = [
    "#1f77b4",
    "#ff7f0e",
    "#2ca02c",
    "#d62728",
    "#9467bd",
    "#8c564b",
    "#e377c2",
    "#7f7f7f",
    "#bcbd22",
    "#17becf",
]
project_color_mapping = {
    pid: distinct_colors[i % len(distinct_colors)] for i, pid in enumerate(project_ids)
}

# Calculate total number of requests per project_id for legend
project_totals = (
    grouped_by_model_project.groupby("project_id")["num_model_requests"]
    .sum()
    .sort_values(ascending=False)  # Sort by highest total first
)

# Set up bar positions
n_models = len(models)
bar_width = 0.6
x = np.arange(n_models)

plt.figure(figsize=(12, 6))

# Plot stacked bars for each model
for model_idx, model in enumerate(models):
    # Filter data for the current model
    model_data = grouped_by_model_project[grouped_by_model_project["model"] == model]

    bottom = 0
    # Stack segments for each project ID within the bars
    for _, row in model_data.iterrows():
        color = project_color_mapping[row["project_id"]]
        plt.bar(
            x[model_idx],
            row["num_model_requests"],
            width=bar_width,
            bottom=bottom,
            color=color,
        )
        bottom += row["num_model_requests"]

# Labeling and styling
plt.xlabel("Model")
plt.ylabel("Number of Model Requests")
plt.title("Total Model Requests by Model and Project ID Last 30 Days")
plt.xticks(x, models, rotation=45, ha="right")

# Create a sorted legend with totals
handles = [
    mpatches.Patch(color=project_color_mapping[pid], label=f"{pid} (Total: {total})")
    for pid, total in project_totals.items()
]
plt.legend(handles=handles, bbox_to_anchor=(1.05, 1), loc="upper left")

plt.tight_layout()
plt.show()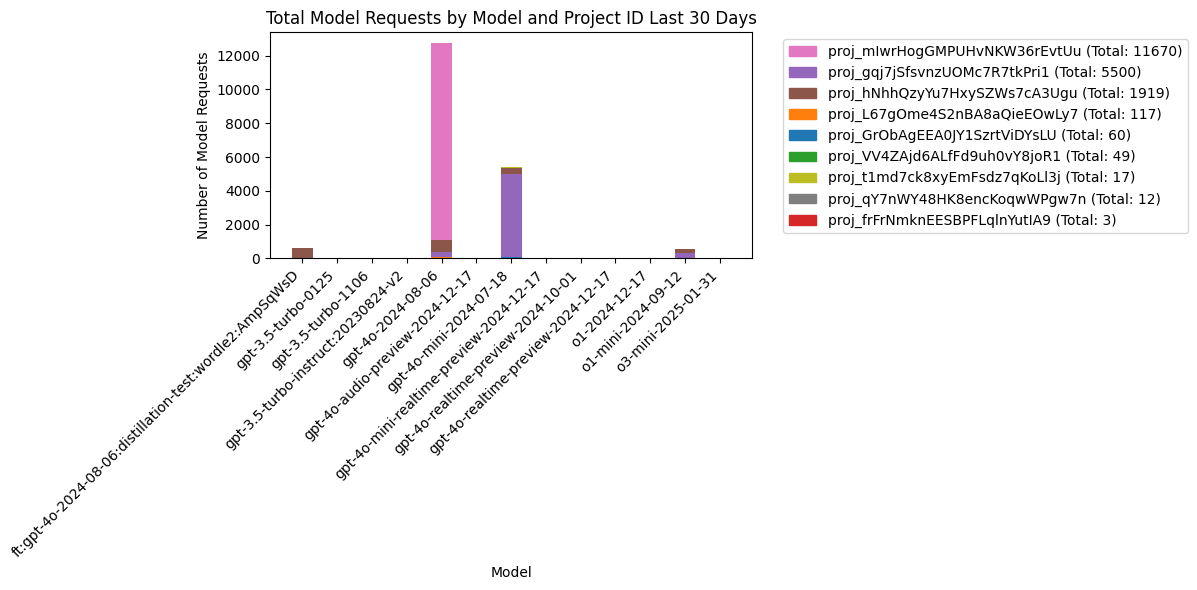
This section visualizes the distribution of token usage across different models using a pie chart.
records = []
for bucket in all_group_data:
    for result in bucket.get("results", []):
        records.append(
            {
                "project_id": result.get("project_id", "N/A"),
                "num_model_requests": result.get("num_model_requests", 0),
            }
        )

# Create a DataFrame
df = pd.DataFrame(records)

# Aggregate data by project_id
grouped_by_project = (
    df.groupby("project_id").agg({"num_model_requests": "sum"}).reset_index()
)

# Visualize Pie Chart
if not grouped_by_project.empty:
    # Filter out rows where num_model_requests == 0
    filtered_grouped_by_project = grouped_by_project[
        grouped_by_project["num_model_requests"] > 0
    ]

    # Calculate the total model requests after filtering
    total_requests = filtered_grouped_by_project["num_model_requests"].sum()

    if total_requests > 0:
        # Calculate percentage of total for each project
        filtered_grouped_by_project["percentage"] = (
            filtered_grouped_by_project["num_model_requests"] / total_requests
        ) * 100

        # Separate "Other" projects (below 5%)
        other_projects = filtered_grouped_by_project[
            filtered_grouped_by_project["percentage"] < 5
        ]
        main_projects = filtered_grouped_by_project[
            filtered_grouped_by_project["percentage"] >= 5
        ]

        # Sum up "Other" projects
        if not other_projects.empty:
            other_row = pd.DataFrame(
                {
                    "project_id": ["Other"],
                    "num_model_requests": [other_projects["num_model_requests"].sum()],
                    "percentage": [other_projects["percentage"].sum()],
                }
            )
            filtered_grouped_by_project = pd.concat(
                [main_projects, other_row], ignore_index=True
            )

        # Sort by number of requests for better legend organization
        filtered_grouped_by_project = filtered_grouped_by_project.sort_values(
            by="num_model_requests", ascending=False
        )

        # Main pie chart for distribution of model requests by project_id
        plt.figure(figsize=(10, 8))
        plt.pie(
            filtered_grouped_by_project["num_model_requests"],
            labels=filtered_grouped_by_project["project_id"],
            autopct=lambda p: f"{p:.1f}%\n({int(p * total_requests / 100):,})",
            startangle=140,
            textprops={"fontsize": 10},
        )
        plt.title("Distribution of Model Requests by Project ID", fontsize=14)
        plt.axis("equal")  # Equal aspect ratio ensures pie chart is circular.
        plt.tight_layout()
        plt.show()

        # If there are "Other" projects, generate a second pie chart for breakdown
        if not other_projects.empty:
            other_total_requests = other_projects["num_model_requests"].sum()

            plt.figure(figsize=(10, 8))
            plt.pie(
                other_projects["num_model_requests"],
                labels=other_projects["project_id"],
                autopct=lambda p: f"{p:.1f}%\n({int(p * other_total_requests / 100):,})",
                startangle=140,
                textprops={"fontsize": 10},
            )
            plt.title('Breakdown of "Other" Projects by Model Requests', fontsize=14)
            plt.axis("equal")  # Equal aspect ratio ensures pie chart is circular.
            plt.tight_layout()
            plt.show()
    else:
        print("Total model requests is zero. Pie chart will not be rendered.")
else:
    print("No grouped data available for pie chart.")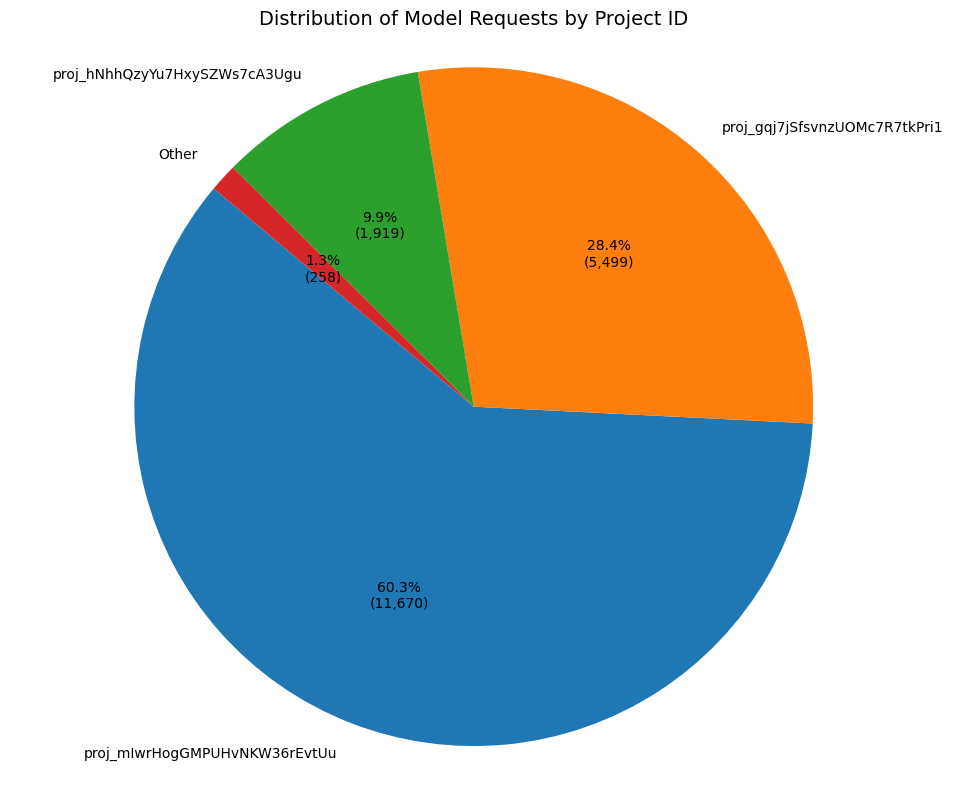
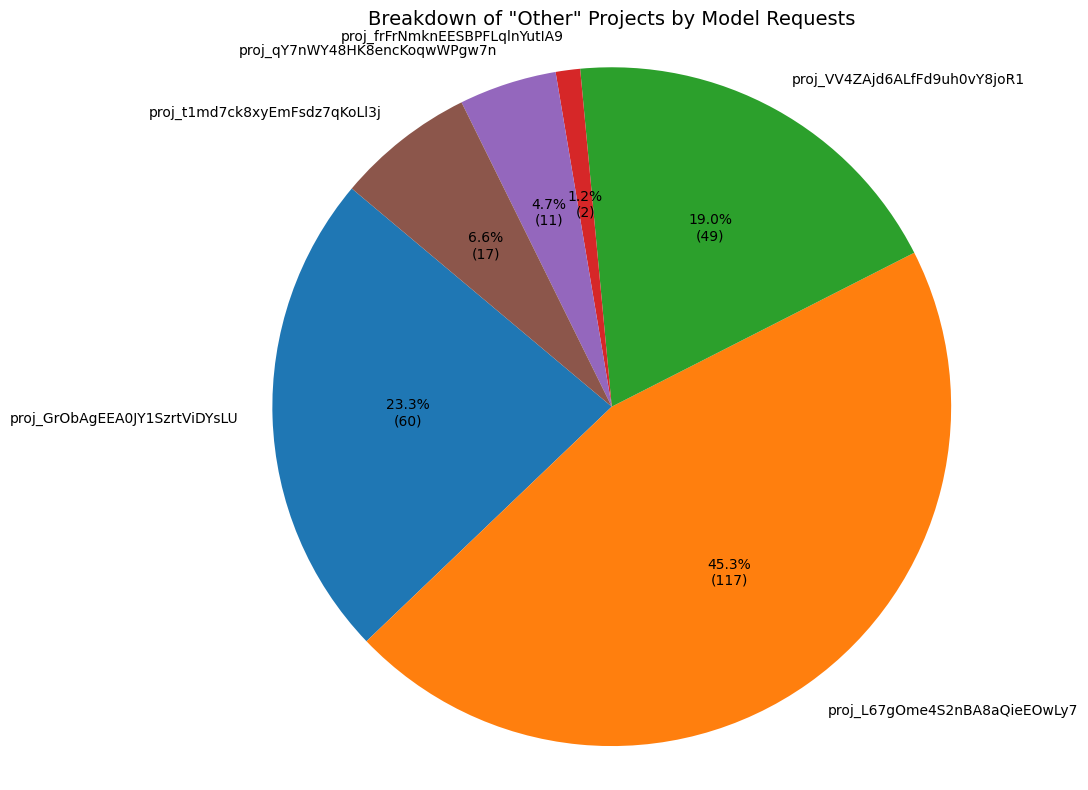
In this section, we’ll work with the OpenAI Costs API to retrieve and visualize cost data. Similar to the completions data, we’ll:
- Call the Costs API to get aggregated cost data.
- Parse the JSON response into a pandas DataFrame.
- Visualize costs grouped by line item using a bar chart.
# Calculate start time: n days ago from now
days_ago = 30
start_time = int(time.time()) - (days_ago * 24 * 60 * 60)

# Define the Costs API endpoint
costs_url = "https://api.openai.com/v1/organization/costs"

costs_params = {
    "start_time": start_time,  # Required: Start time (Unix seconds)
    "bucket_width": "1d",  # Optional: Currently only '1d' is supported
    "limit": 30,  # Optional: Number of buckets to return
}

# Initialize an empty list to store all data
all_costs_data = get_data(costs_url, costs_params)
Data retrieved successfully!print(json.dumps(all_costs_data, indent=2))[
{
"object": "bucket",
"start_time": 1736553600,
"end_time": 1736640000,
"results": [
{
"object": "organization.costs.result",
"amount": {
"value": 0.13080438340307526,
"currency": "usd"
},
"line_item": null,
"project_id": null,
"organization_id": "org-GLHrIv00VVN9dEQC2b4wsBkf"
}
]
},
{
"object": "bucket",
"start_time": 1736640000,
"end_time": 1736726400,
"results": [
{
"object": "organization.costs.result",
"amount": {
"value": 0.12270423340307525,
"currency": "usd"
},
"line_item": null,
"project_id": null,
"organization_id": "org-GLHrIv00VVN9dEQC2b4wsBkf"
}
]
},
{
"object": "bucket",
"start_time": 1736726400,
"end_time": 1736812800,
"results": [
{
"object": "organization.costs.result",
"amount": {
"value": 9.888144383403077,
"currency": "usd"
},
"line_item": null,
"project_id": null,
"organization_id": "org-GLHrIv00VVN9dEQC2b4wsBkf"
}
]
},
{
"object": "bucket",
"start_time": 1736812800,
"end_time": 1736899200,
"results": [
{
"object": "organization.costs.result",
"amount": {
"value": 0.3507639334030752,
"currency": "usd"
},
"line_item": null,
"project_id": null,
"organization_id": "org-GLHrIv00VVN9dEQC2b4wsBkf"
}
]
},
{
"object": "bucket",
"start_time": 1736899200,
"end_time": 1736985600,
"results": [
{
"object": "organization.costs.result",
"amount": {
"value": 0.2977481185324674,
"currency": "usd"
},
"line_item": null,
"project_id": null,
"organization_id": "org-GLHrIv00VVN9dEQC2b4wsBkf"
}
]
},
{
"object": "bucket",
"start_time": 1736985600,
"end_time": 1737072000,
"results": [
{
"object": "organization.costs.result",
"amount": {
"value": 0.00925485477848094,
"currency": "usd"
},
"line_item": null,
"project_id": null,
"organization_id": "org-GLHrIv00VVN9dEQC2b4wsBkf"
}
]
},
{
"object": "bucket",
"start_time": 1737072000,
"end_time": 1737158400,
"results": [
{
"object": "organization.costs.result",
"amount": {
"value": 8.889884136532304,
"currency": "usd"
},
"line_item": null,
"project_id": null,
"organization_id": "org-GLHrIv00VVN9dEQC2b4wsBkf"
}
]
},
{
"object": "bucket",
"start_time": 1737158400,
"end_time": 1737244800,
"results": [
{
"object": "organization.costs.result",
"amount": {
"value": 21.167310118127915,
"currency": "usd"
},
"line_item": null,
"project_id": null,
"organization_id": "org-GLHrIv00VVN9dEQC2b4wsBkf"
}
]
},
{
"object": "bucket",
"start_time": 1737244800,
"end_time": 1737331200,
"results": [
{
"object": "organization.costs.result",
"amount": {
"value": 0.04955636812791847,
"currency": "usd"
},
"line_item": null,
"project_id": null,
"organization_id": "org-GLHrIv00VVN9dEQC2b4wsBkf"
}
]
},
{
"object": "bucket",
"start_time": 1737331200,
"end_time": 1737417600,
"results": [
{
"object": "organization.costs.result",
"amount": {
"value": 0.0003226181279184669,
"currency": "usd"
},
"line_item": null,
"project_id": null,
"organization_id": "org-GLHrIv00VVN9dEQC2b4wsBkf"
}
]
},
{
"object": "bucket",
"start_time": 1737417600,
"end_time": 1737504000,
"results": [
{
"object": "organization.costs.result",
"amount": {
"value": 0.6320363681279185,
"currency": "usd"
},
"line_item": null,
"project_id": null,
"organization_id": "org-GLHrIv00VVN9dEQC2b4wsBkf"
}
]
},
{
"object": "bucket",
"start_time": 1737504000,
"end_time": 1737590400,
"results": [
{
"object": "organization.costs.result",
"amount": {
"value": 52.41558761812793,
"currency": "usd"
},
"line_item": null,
"project_id": null,
"organization_id": "org-GLHrIv00VVN9dEQC2b4wsBkf"
}
]
},
{
"object": "bucket",
"start_time": 1737590400,
"end_time": 1737676800,
"results": [
{
"object": "organization.costs.result",
"amount": {
"value": 104.88761235323427,
"currency": "usd"
},
"line_item": null,
"project_id": null,
"organization_id": "org-GLHrIv00VVN9dEQC2b4wsBkf"
}
]
},
{
"object": "bucket",
"start_time": 1737676800,
"end_time": 1737763200,
"results": [
{
"object": "organization.costs.result",
"amount": {
"value": 0.3376030385950106,
"currency": "usd"
},
"line_item": null,
"project_id": null,
"organization_id": "org-GLHrIv00VVN9dEQC2b4wsBkf"
}
]
},
{
"object": "bucket",
"start_time": 1737763200,
"end_time": 1737849600,
"results": [
{
"object": "organization.costs.result",
"amount": {
"value": 0.062551042553524,
"currency": "usd"
},
"line_item": null,
"project_id": null,
"organization_id": "org-GLHrIv00VVN9dEQC2b4wsBkf"
}
]
},
{
"object": "bucket",
"start_time": 1737849600,
"end_time": 1737936000,
"results": [
{
"object": "organization.costs.result",
"amount": {
"value": 0.00032195744715549047,
"currency": "usd"
},
"line_item": null,
"project_id": null,
"organization_id": "org-GLHrIv00VVN9dEQC2b4wsBkf"
}
]
},
{
"object": "bucket",
"start_time": 1737936000,
"end_time": 1738022400,
"results": [
{
"object": "organization.costs.result",
"amount": {
"value": 0.0003084210662774742,
"currency": "usd"
},
"line_item": null,
"project_id": null,
"organization_id": "org-GLHrIv00VVN9dEQC2b4wsBkf"
}
]
},
{
"object": "bucket",
"start_time": 1738022400,
"end_time": 1738108800,
"results": [
{
"object": "organization.costs.result",
"amount": {
"value": 0.00032195744715549047,
"currency": "usd"
},
"line_item": null,
"project_id": null,
"organization_id": "org-GLHrIv00VVN9dEQC2b4wsBkf"
}
]
},
{
"object": "bucket",
"start_time": 1738108800,
"end_time": 1738195200,
"results": [
{
"object": "organization.costs.result",
"amount": {
"value": 0.5142559074471554,
"currency": "usd"
},
"line_item": null,
"project_id": null,
"organization_id": "org-GLHrIv00VVN9dEQC2b4wsBkf"
}
]
},
{
"object": "bucket",
"start_time": 1738195200,
"end_time": 1738281600,
"results": [
{
"object": "organization.costs.result",
"amount": {
"value": 0.21870350744715547,
"currency": "usd"
},
"line_item": null,
"project_id": null,
"organization_id": "org-GLHrIv00VVN9dEQC2b4wsBkf"
}
]
},
{
"object": "bucket",
"start_time": 1738281600,
"end_time": 1738368000,
"results": [
{
"object": "organization.costs.result",
"amount": {
"value": 1.4528752074471551,
"currency": "usd"
},
"line_item": null,
"project_id": null,
"organization_id": "org-GLHrIv00VVN9dEQC2b4wsBkf"
}
]
},
{
"object": "bucket",
"start_time": 1738368000,
"end_time": 1738454400,
"results": [
{
"object": "organization.costs.result",
"amount": {
"value": 0.00042714787262957543,
"currency": "usd"
},
"line_item": null,
"project_id": null,
"organization_id": "org-GLHrIv00VVN9dEQC2b4wsBkf"
}
]
},
{
"object": "bucket",
"start_time": 1738454400,
"end_time": 1738540800,
"results": [
{
"object": "organization.costs.result",
"amount": {
"value": 0.00032195744715549047,
"currency": "usd"
},
"line_item": null,
"project_id": null,
"organization_id": "org-GLHrIv00VVN9dEQC2b4wsBkf"
}
]
},
{
"object": "bucket",
"start_time": 1738540800,
"end_time": 1738627200,
"results": [
{
"object": "organization.costs.result",
"amount": {
"value": 0.0031147346857709622,
"currency": "usd"
},
"line_item": null,
"project_id": null,
"organization_id": "org-GLHrIv00VVN9dEQC2b4wsBkf"
}
]
},
{
"object": "bucket",
"start_time": 1738627200,
"end_time": 1738713600,
"results": [
{
"object": "organization.costs.result",
"amount": {
"value": 68.30023964957941,
"currency": "usd"
},
"line_item": null,
"project_id": null,
"organization_id": "org-GLHrIv00VVN9dEQC2b4wsBkf"
}
]
},
{
"object": "bucket",
"start_time": 1738713600,
"end_time": 1738800000,
"results": [
{
"object": "organization.costs.result",
"amount": {
"value": 14.858330207447157,
"currency": "usd"
},
"line_item": null,
"project_id": null,
"organization_id": "org-GLHrIv00VVN9dEQC2b4wsBkf"
}
]
},
{
"object": "bucket",
"start_time": 1738800000,
"end_time": 1738886400,
"results": [
{
"object": "organization.costs.result",
"amount": {
"value": 0.3137180574471555,
"currency": "usd"
},
"line_item": null,
"project_id": null,
"organization_id": "org-GLHrIv00VVN9dEQC2b4wsBkf"
}
]
},
{
"object": "bucket",
"start_time": 1738886400,
"end_time": 1738972800,
"results": [
{
"object": "organization.costs.result",
"amount": {
"value": 0.02677460744715549,
"currency": "usd"
},
"line_item": null,
"project_id": null,
"organization_id": "org-GLHrIv00VVN9dEQC2b4wsBkf"
}
]
},
{
"object": "bucket",
"start_time": 1738972800,
"end_time": 1739059200,
"results": [
{
"object": "organization.costs.result",
"amount": {
"value": 0.007399792553524012,
"currency": "usd"
},
"line_item": null,
"project_id": null,
"organization_id": "org-GLHrIv00VVN9dEQC2b4wsBkf"
}
]
},
{
"object": "bucket",
"start_time": 1739059200,
"end_time": 1739145600,
"results": [
{
"object": "organization.costs.result",
"amount": {
"value": 0.00032195744715549047,
"currency": "usd"
},
"line_item": null,
"project_id": null,
"organization_id": "org-GLHrIv00VVN9dEQC2b4wsBkf"
}
]
},
{
"object": "bucket",
"start_time": 1739145600,
"end_time": 1739232000,
"results": [
{
"object": "organization.costs.result",
"amount": {
"value": 0.00012073404268330895,
"currency": "usd"
},
"line_item": null,
"project_id": null,
"organization_id": "org-GLHrIv00VVN9dEQC2b4wsBkf"
}
]
}
]We will now parse the JSON data from the Costs API, extract relevant fields, and create a pandas DataFrame for further analysis.
# Initialize a list to hold parsed cost records
cost_records = []

# Extract bucketed cost data from all_costs_data
for bucket in all_costs_data:
    start_time = bucket.get("start_time")
    end_time = bucket.get("end_time")
    for result in bucket.get("results", []):
        cost_records.append(
            {
                "start_time": start_time,
                "end_time": end_time,
                "amount_value": result.get("amount", {}).get("value", 0),
                "currency": result.get("amount", {}).get("currency", "usd"),
                "line_item": result.get("line_item"),
                "project_id": result.get("project_id"),
            }
        )

# Create a DataFrame from the cost records
cost_df = pd.DataFrame(cost_records)

# Convert Unix timestamps to datetime for readability
cost_df["start_datetime"] = pd.to_datetime(cost_df["start_time"], unit="s")
cost_df["end_datetime"] = pd.to_datetime(cost_df["end_time"], unit="s")

# Display the first few rows of the DataFrame
cost_df.head()| start_time | end_time | amount_value | currency | line_item | project_id | start_datetime | end_datetime | |
|---|---|---|---|---|---|---|---|---|
| 0 | 1736553600 | 1736640000 | 0.130804 | usd | None | None | 2025-01-11 | 2025-01-12 |
| 1 | 1736640000 | 1736726400 | 0.122704 | usd | None | None | 2025-01-12 | 2025-01-13 |
| 2 | 1736726400 | 1736812800 | 9.888144 | usd | None | None | 2025-01-13 | 2025-01-14 |
| 3 | 1736812800 | 1736899200 | 0.350764 | usd | None | None | 2025-01-14 | 2025-01-15 |
| 4 | 1736899200 | 1736985600 | 0.297748 | usd | None | None | 2025-01-15 | 2025-01-16 |
We’ll create a bar chart to visualize the total costs aggregated by day. This helps give a high level perspective on organizational spend.
if not cost_df.empty:
    # Ensure datetime conversion for 'start_datetime' column
    if (
        "start_datetime" not in cost_df.columns
        or not pd.api.types.is_datetime64_any_dtype(cost_df["start_datetime"])
    ):
        cost_df["start_datetime"] = pd.to_datetime(
            cost_df["start_time"], unit="s", errors="coerce"
        )

    # Create a new column for just the date part of 'start_datetime'
    cost_df["date"] = cost_df["start_datetime"].dt.date

    # Group by date and sum the amounts
    cost_per_day = cost_df.groupby("date")["amount_value"].sum().reset_index()

    # Plot the data
    plt.figure(figsize=(12, 6))
    plt.bar(
        cost_per_day["date"],
        cost_per_day["amount_value"],
        width=0.6,
        color="skyblue",
        alpha=0.8,
    )
    plt.xlabel("Date")
    plt.ylabel("Total Cost (USD)")
    plt.title("Total Cost per Day (Last 30 Days)")
    plt.xticks(rotation=45, ha="right")
    plt.tight_layout()
    plt.show()
else:
    print("No cost data available to plot.")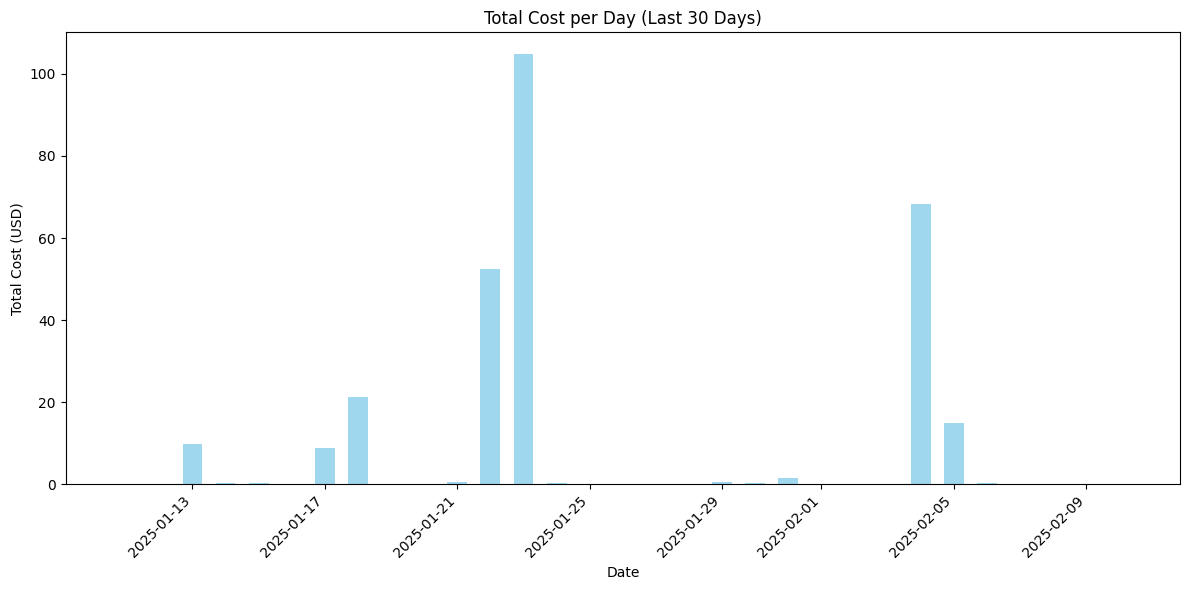
We’ll create a bar chart to visualize the total costs aggregated by line item. This helps identify which categories (e.g., models or other services) contribute most to the expenses.
days_ago = 30
start_time = int(time.time()) - (days_ago * 24 * 60 * 60)

costs_params = {
    "start_time": start_time,  # Required: Start time (Unix seconds)
    "bucket_width": "1d",  # Optional: Currently only '1d' is supported
    "limit": 30,  # Optional: Number of buckets to return
    "group_by": ["line_item"],
}

line_item_cost_data = get_data(costs_url, costs_params)

# Initialize a list to hold parsed cost records
cost_records = []

# Extract bucketed cost data from all_costs_data
for bucket in line_item_cost_data:
    start_time = bucket.get("start_time")
    end_time = bucket.get("end_time")
    for result in bucket.get("results", []):
        cost_records.append(
            {
                "start_time": start_time,
                "end_time": end_time,
                "amount_value": result.get("amount", {}).get("value", 0),
                "currency": result.get("amount", {}).get("currency", "usd"),
                "line_item": result.get("line_item"),
                "project_id": result.get("project_id"),
            }
        )

# Create a DataFrame from the cost records
cost_df = pd.DataFrame(cost_records)

# Convert Unix timestamps to datetime for readability
cost_df["start_datetime"] = pd.to_datetime(cost_df["start_time"], unit="s")
cost_df["end_datetime"] = pd.to_datetime(cost_df["end_time"], unit="s")

# Display the first few rows of the DataFrame
cost_df.head()
Data retrieved successfully!| start_time | end_time | amount_value | currency | line_item | project_id | start_datetime | end_datetime | |
|---|---|---|---|---|---|---|---|---|
| 0 | 1736553600 | 1736640000 | 0.127440 | usd | ft-gpt-4o-2024-08-06, input | proj_hNhhQzyYu7HxySZWs7cA3Ugu | 2025-01-11 | 2025-01-12 |
| 1 | 1736553600 | 1736640000 | 0.003090 | usd | ft-gpt-4o-2024-08-06, output | proj_hNhhQzyYu7HxySZWs7cA3Ugu | 2025-01-11 | 2025-01-12 |
| 2 | 1736553600 | 1736640000 | 0.000271 | usd | assistants api | file search | proj_L67gOme4S2nBA8aQieEOwLy7 | 2025-01-11 | 2025-01-12 |
| 3 | 1736553600 | 1736640000 | 0.000003 | usd | assistants api | file search | proj_VV4ZAjd6ALfFd9uh0vY8joR1 | 2025-01-11 | 2025-01-12 |
| 4 | 1736640000 | 1736726400 | 0.028607 | usd | evals | gpt-4o-mini-2024-07-18, input | proj_L67gOme4S2nBA8aQieEOwLy7 | 2025-01-12 | 2025-01-13 |
if not cost_df.empty:
    # Ensure datetime conversion for 'start_datetime' column
    if "start_datetime" not in cost_df.columns or not pd.api.types.is_datetime64_any_dtype(cost_df["start_datetime"]):
        cost_df["start_datetime"] = pd.to_datetime(cost_df["start_time"], unit="s", errors="coerce")

    # Create a new column for just the date part of 'start_datetime'
    cost_df["date"] = cost_df["start_datetime"].dt.date

    # Group by date and line_item and sum the amounts
    cost_per_day = cost_df.groupby(["date", "line_item"])["amount_value"].sum().reset_index()

    # Pivot the DataFrame so each date has one bar with line_item stacks
    cost_pivot = cost_per_day.pivot(index="date", columns="line_item", values="amount_value").fillna(0)
    cost_pivot = cost_pivot.sort_index()

    # Plot a stacked bar chart with one bar for each grouped day
    plt.figure(figsize=(12, 6))
    ax = cost_pivot.plot(kind="bar", stacked=True, ax=plt.gca(), width=0.8)
    plt.xlabel("Date")
    plt.ylabel("Total Cost (USD)")
    plt.title("Total Cost by Line Item")
    plt.xticks(rotation=45, ha="right")
    # Update legend so it doesn't overlay the graph by placing it outside the plot area
    plt.legend(bbox_to_anchor=(1.05, 1), loc="upper left", borderaxespad=0.)
    plt.tight_layout()
    plt.show()
else:
    print("No cost data available to plot.")
/var/folders/r_/g8r2dz8s2qd104th5p5yxljr0000gp/T/ipykernel_49468/2813361465.py:25: UserWarning: Tight layout not applied. The bottom and top margins cannot be made large enough to accommodate all Axes decorations.
plt.tight_layout()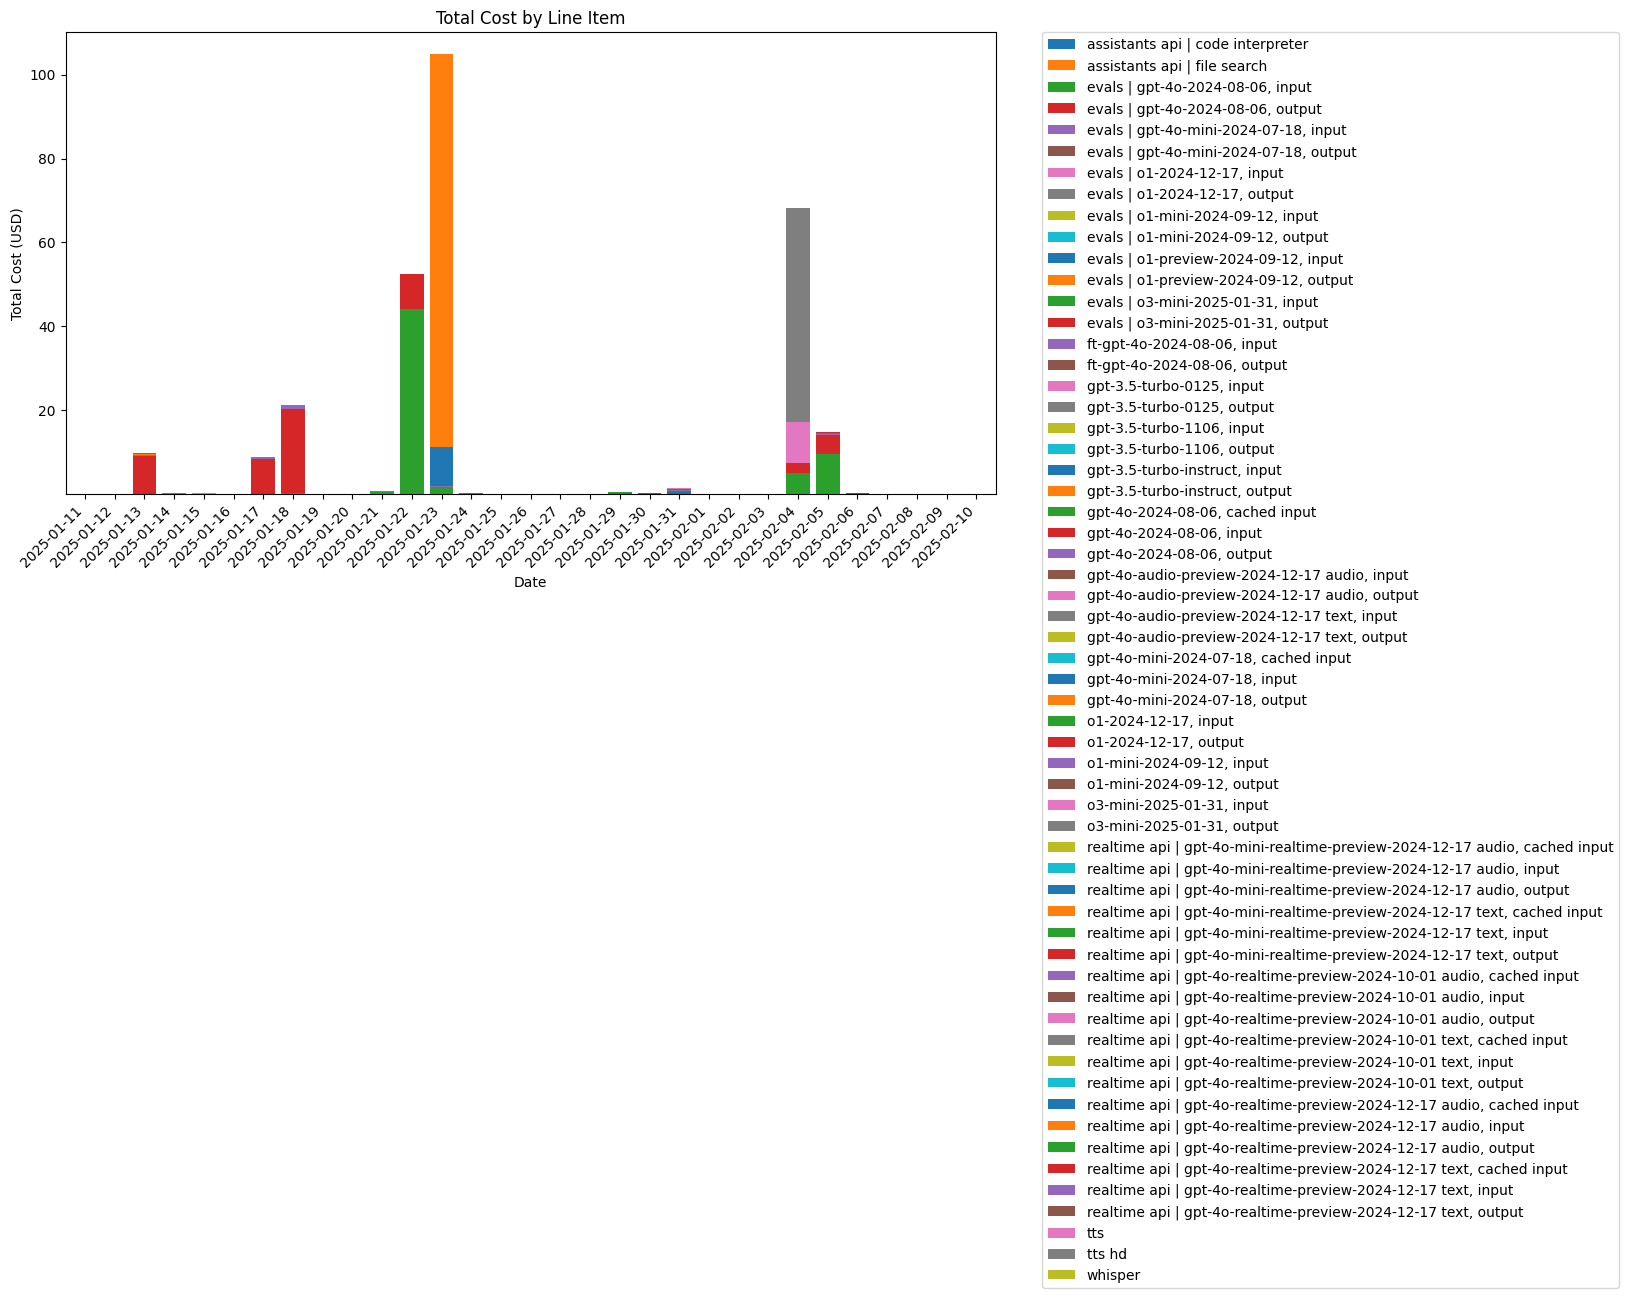
You can extend this notebook with more visualizations for both the Completions and Costs APIs. For example:
Completions API:
- Group by user, project, or model to see which ones consume the most tokens.
- Create line plots for time series analysis of token usage over days or hours.
- Use pie charts to visualize distribution of tokens across models, users, or projects.
- Experiment with different
group_byparameters (e.g.,["model", "user_id"]) to gain deeper insights.
Costs API:
- Group by project or line item to identify spending patterns.
- Create line or bar charts to visualize daily cost trends.
- Use pie charts to show how costs are distributed across projects, services, or line items.
- Try various
group_byoptions (e.g.,["project_id"],["line_item"]) for granular analysis.
Experiment with different parameters and visualization techniques using pandas and matplotlib (or libraries like Plotly/Bokeh) to gain deeper insights, and consider integrating these visualizations into interactive dashboards for real-time monitoring.
To bring OpenAI usage and cost data into external dashboarding tools like Tableau, Power BI, or custom platforms (e.g., Plotly Dash, Bokeh), follow these steps:
-
Data Collection & Preparation:
- Use Python scripts to regularly fetch data from the Completions and Costs APIs.
- Process and aggregate the data with pandas, then store it in a database, data warehouse, or export it as CSV/JSON files.
-
Connecting to a Dashboard:
- BI Tools (Tableau, Power BI):
- Connect directly to the prepared data source (SQL database, CSV files, or web APIs).
- Use built-in connectors to schedule data refreshes, ensuring dashboards always display current information.
- Custom Dashboards (Plotly Dash, Bokeh):
- Embed API calls and data processing into the dashboard code.
- Build interactive visual components that automatically update as new data is fetched.
- BI Tools (Tableau, Power BI):
-
Real-Time & Automated Updates:
- Schedule scripts using cron jobs, task schedulers, or workflow tools (e.g., Apache Airflow) to refresh data periodically.
- Implement webhooks or streaming APIs (if available) for near real-time data updates.
By integrating API data into third-party platforms, you can create interactive, real-time dashboards that combine OpenAI metrics with other business data, offering comprehensive insights and automated monitoring.