


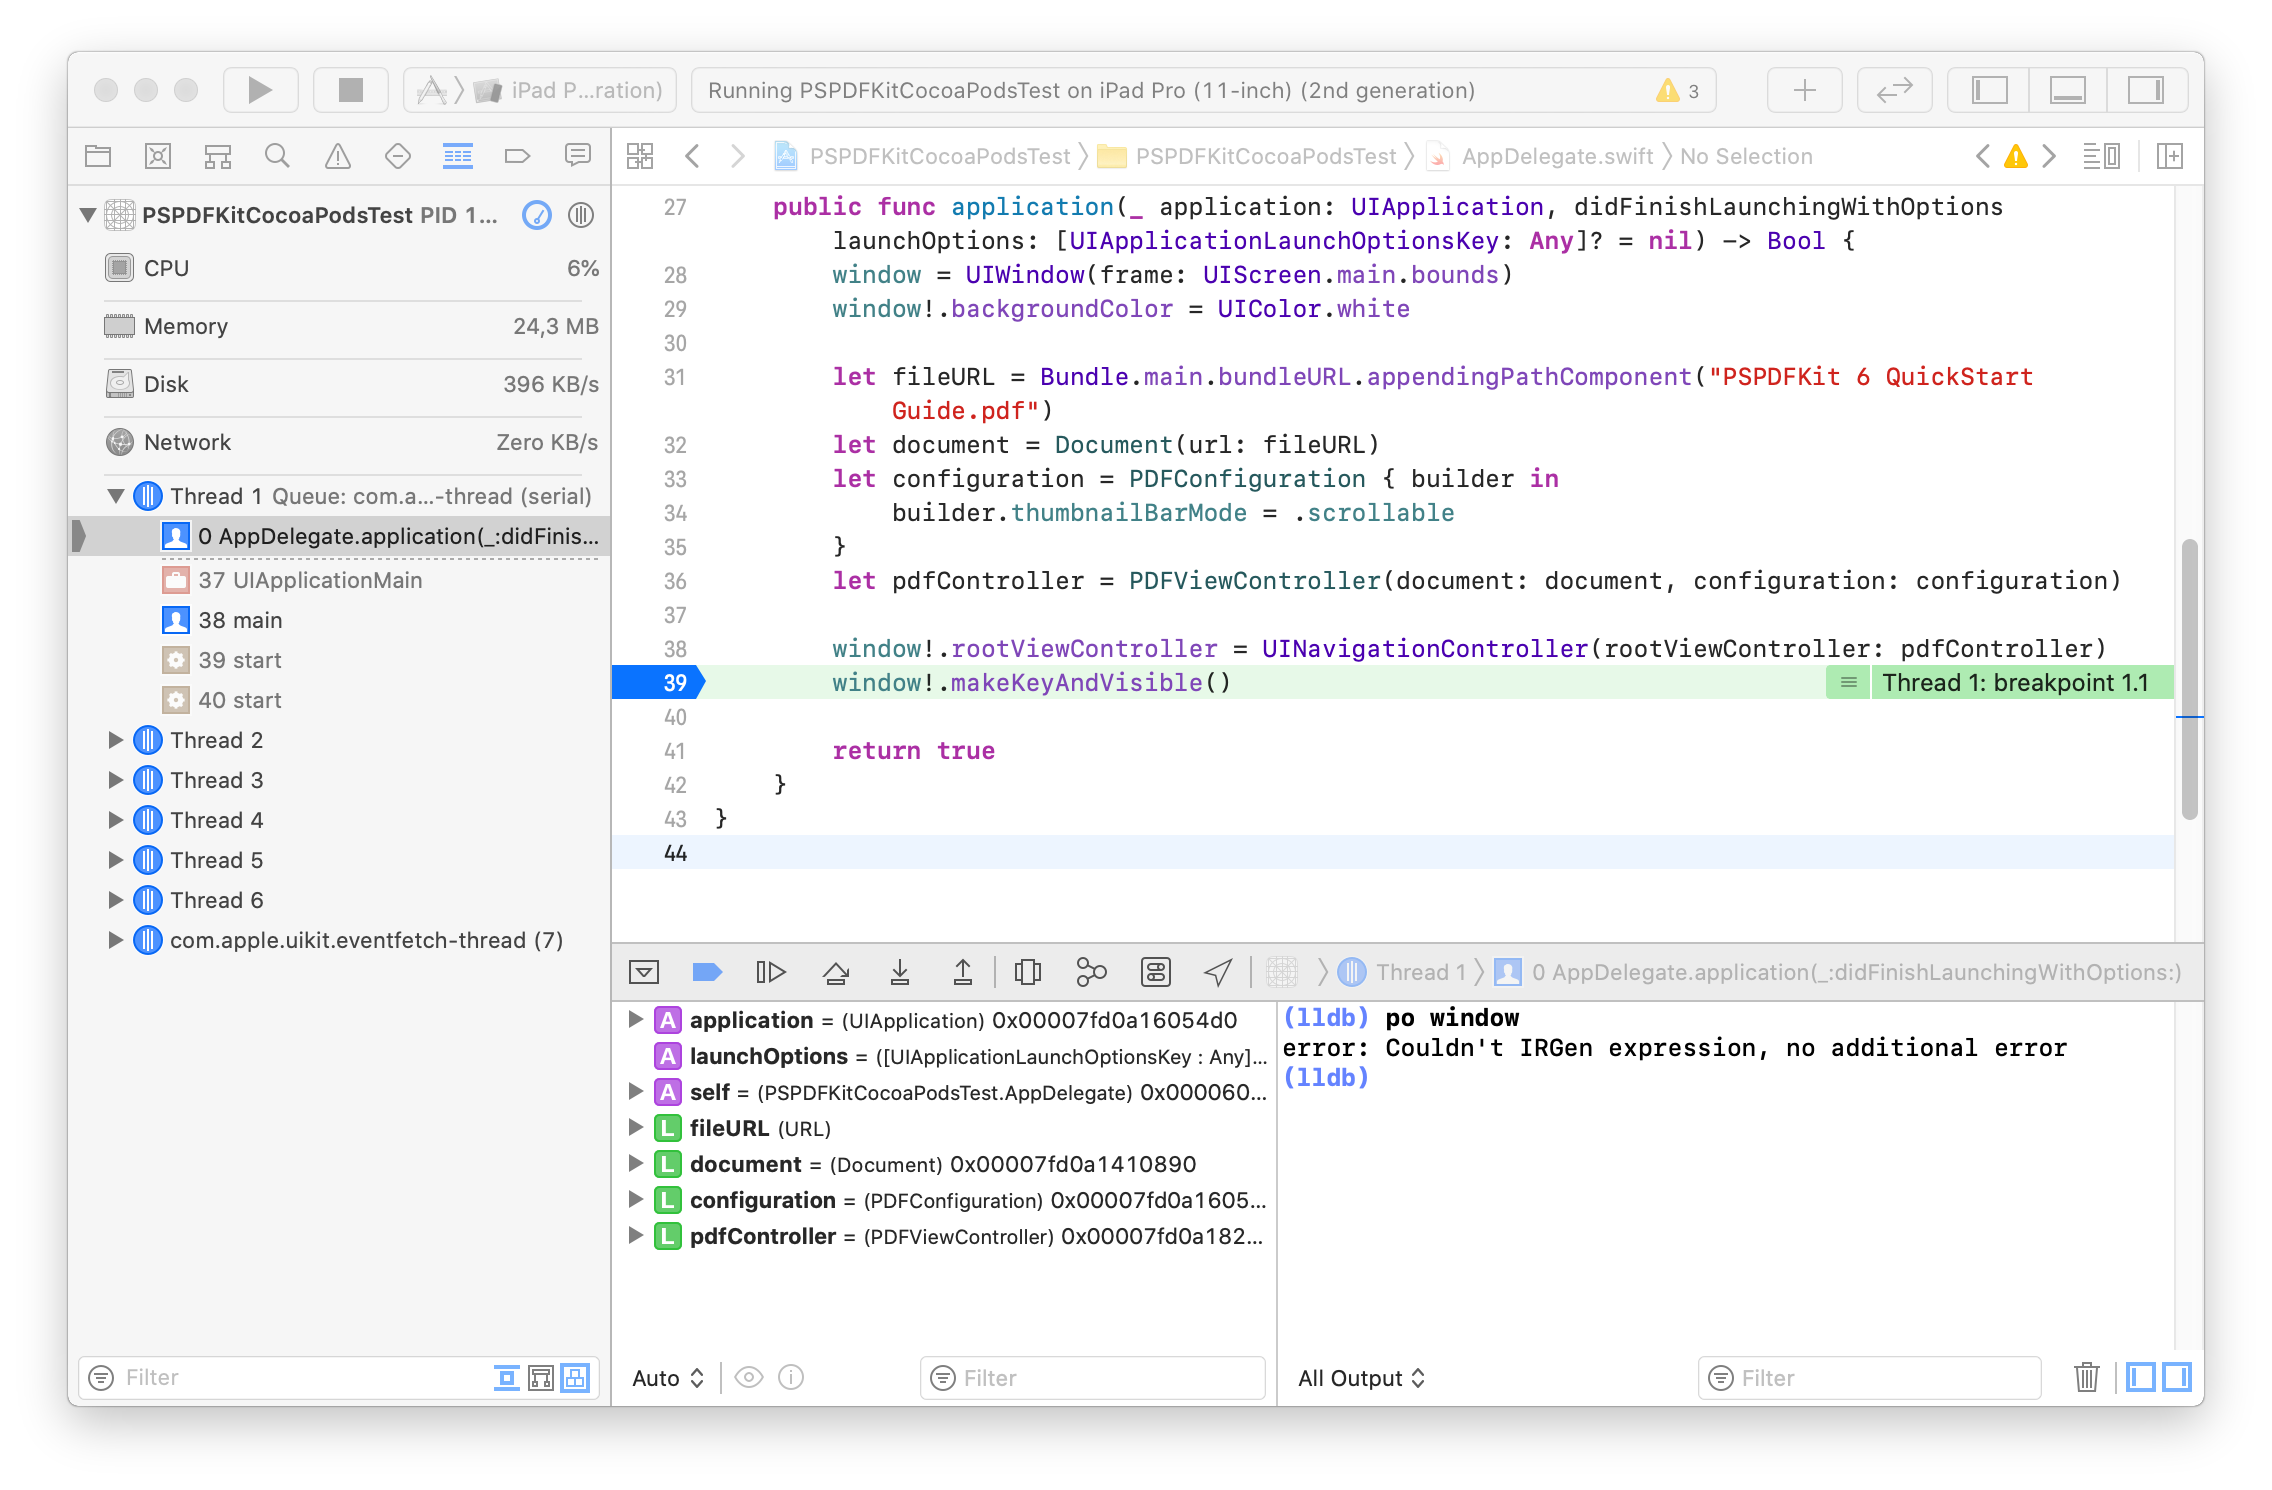
A few weeks ago, we started receiving support tickets with reports that people can’t use the lldb debugger anymore after integrating PSPDFKit. Instead of printing an object, they get Couldn't IRGen expression, no additional error. That’s obviously not great, and trying to understand what’s wrong here led me down a rabbit hole worth sharing.
Analysis
The debugger from Xcode 11.5 (11E608c) fails to print information about variables using the po, p, or e commands.
Example command: po window
Result: error: Couldn't IRGen expression, no additional error
Why didn’t we see this before? All our examples work, as they use the new xcframework format — and for some reason, everything works when using XCframeworks.1 We also only recently started to use Swift in our SDK, after Swift’s ABI became stable.
Let’s see what works and what doesn’t:
- ✅ Creating an example with
xcframework(this is the format we distribute). - ✅ Mixed Obj-C/Swift example via
framework,xcframework, CocoaPods, or Carthage. - ❌ Creating a custom example with
framework. - ❌ Swift-only example via CocoaPods or Carthage.
- ❌ Swift-only example via CocoaPods using
xcframework.
⚠️ Testing here is extremely tricky; Apple saves absolute paths in the binary, so if you happen to have the same username on the build machine and your test machine, it might work, but it fails somewhere else. It also seems that LLDB uses the shared module cache, so you need to delete DerivedData on every run. And (see later in this article), where you store the example and which other files you store also play into this — dare I say, this was extremely confusing and frustrating to debug.
I ended up creating a fresh virtual machine with a generic username with snapshots to ensure correct reproducibility. We also enabled BUILD_LIBRARY_FOR_DISTRIBUTION between the current release (9.3.3) and the upcoming version (9.4), which was another variable factor, but seems not to contribute to these test results.
In mixed-mode projects, debugging works, but LLDB complains:
(lldb) po window
warning: Swift error in fallback scratch context: error: failed to load module 'PSPDFSimple'


note: This error message is displayed only once. If the error displayed above is due to conflicting search paths to Clang modules in different images of the debugged executable, this can slow down debugging of Swift code significantly, since a fresh Swift context has to be created every time a conflict is encountered.

<UIWindow: 0x7fbd5d59a160; frame = (0 0; 375 667); hidden = YES; gestureRecognizers = <NSArray: 0x600001ad5dd0>; layer = <UIWindowLayer: 0x600001565ac0>>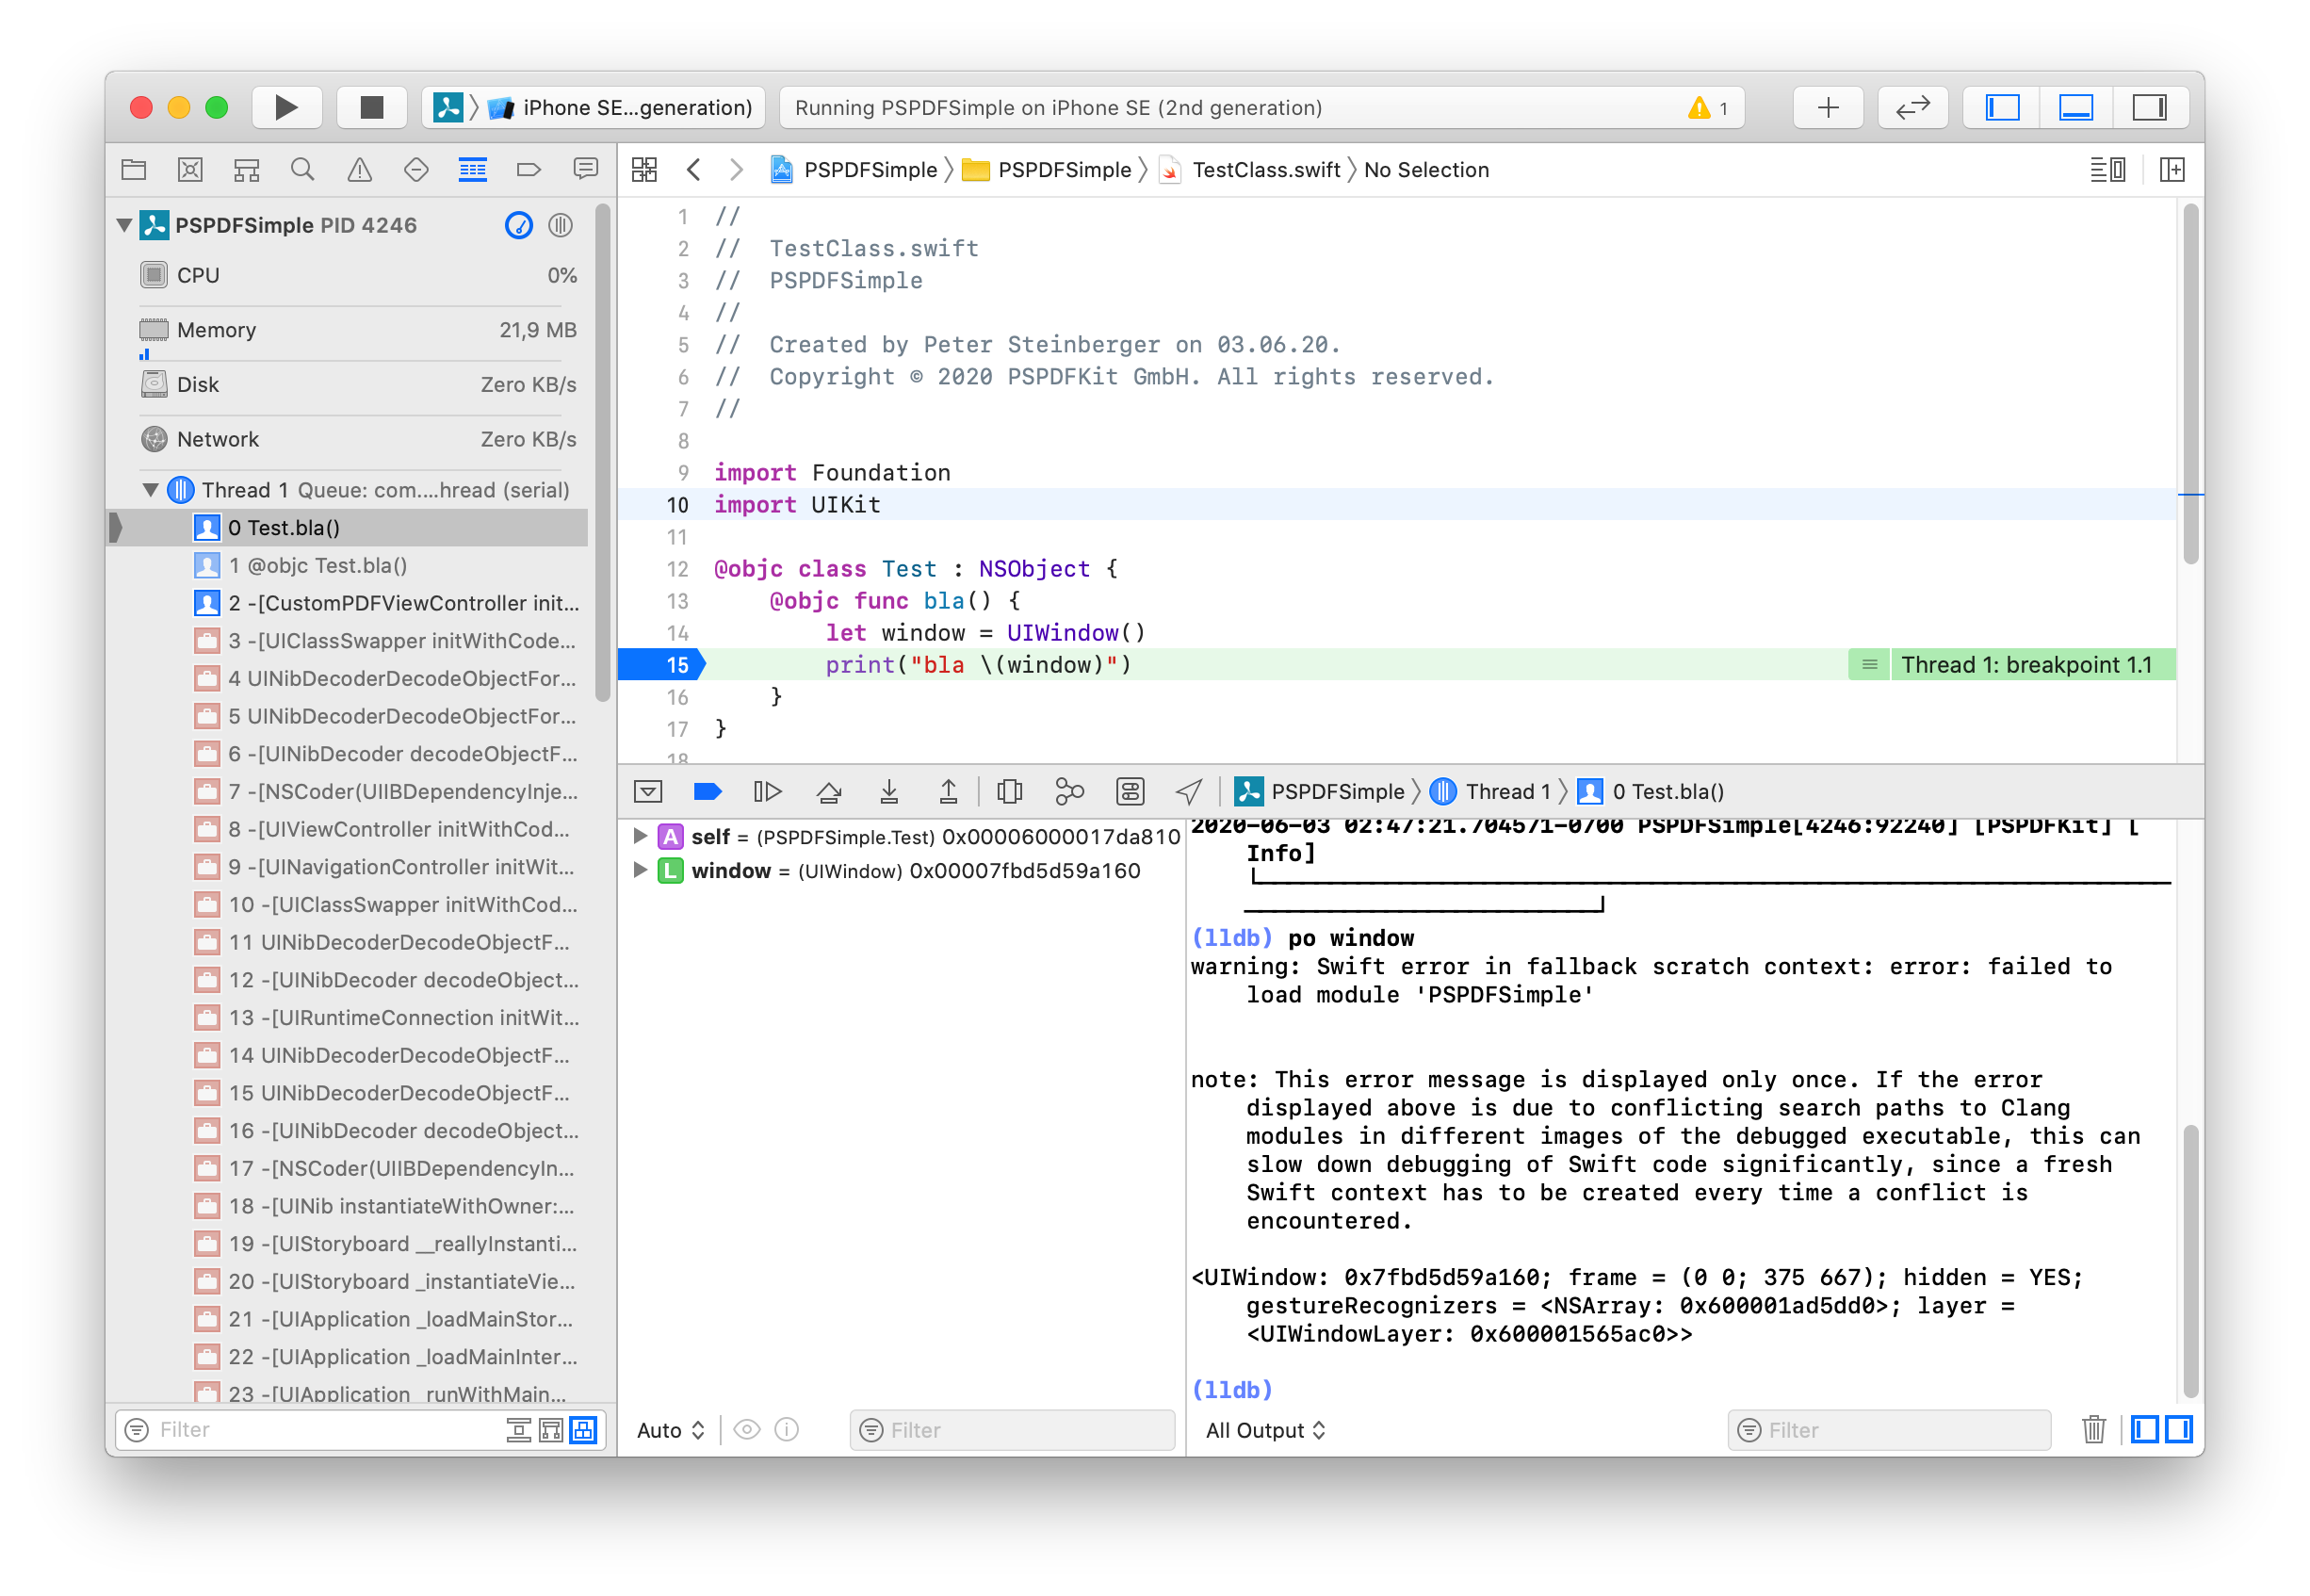
We found a workaround on Stack Overflow that adds one Objective-C class and a bridging header to your project. (See this KB article on PSPDFKit.com.)
We reported this bug as FB7718242 to Apple.
Understanding the Issue
The workaround is acceptable, but we wanted to better understand what the issue here is, as well as be prepared in case this workaround stops working. Debugging is essential, so this is worth understanding properly.
On the linked Stack Overflow workaround, there’s an interesting comment:
There is currently a hard requirement that the version of the swift compiler you use to build your source and the version of lldb you use to debug it must come from the same toolchain. Currently the swift debug information for types is just a serialization of internal swift compiler data structures. It also depends on local path information, which makes it hard to move around. There is a longer term effort to change that design, but for now you have to rebuild all your binaries every time you update your tools, and you can’t use pre-built binaries. — Jim Ingham, Apple Engineer
We found SR-12783, which explains the problem and is also marked as resolved. The OP used the binary Instabug SDK, which is partially written in Swift: a situation very similar to ours.
The binary Swift module encode a hardcoded path to a yaml file that only exists on the original developer’s machine. You should let them know that they need to compile their binary framework with
-no-serialize-debugging-optionsif they are planning to distribute them to another machine. — Artur Grigor
LLDB has an embedded Swift compiler that will attempt to load the
.swiftmodulefor each Swift module in your program. The binary.swiftmoduleis embedded in the .dSYM bundle for LLDB to find. When-serialize-debugging-optionsis enabled the Swift compiler will serialize all Clang options (such as the-ivfsoverlayoption added by Xcode’s build system to findall-product-headers.yaml). This works really nice on the machine that the swift module was built on, but obviously isn’t portable. We are working on lifting this dependency in LLDB, but that is still in progress.
The
-no-serialize-debugging-optionsoption will omit those clang flags. The price for this is that you may need to pass one or two missing Clang options to LLDB manually via settings set target.swift-extra-clang-flags when you are debugging the framework itself now, but you may also get lucky and LLDB can piece together the necessary Clang flags from the main program. — Adrian Prantl, Apple Compiler Engineer
Trying Swift Trunk Snapshot
Adrian subsequently landed a patch in LLDB that modifies SwiftExpressionParser.cpp to print the root cause of this failure. I went ahead and tried this with the Swift Trunk Snapshot. With the one from May 26, the error now looks different:
warning: Swift error in fallback scratch context: error: module 'Swift' was created for incompatible target x86_64-apple-ios13.0-simulator: /Users/steipete/Library/Developer/Xcode/DerivedData/ModuleCache.noindex/Swift-3K8REJ00QGV2U.swiftmodule

note: This error message is displayed only once. If the error displayed above is due to conflicting search paths to Clang modules in different images of the debugged executable, this can slow down debugging of Swift code significantly, since a fresh Swift context has to be created every time a conflict is encountered.

Can't construct shared Swift state for this process after repeated attempts.
Giving up.  Fatal errors:
error: module 'Swift' was created for incompatible target x86_64-apple-ios13.0-simulator: /Users/steipete/Library/Developer/Xcode/DerivedData/ModuleCache.noindex/Swift-3K8REJ00QGV2U.swiftmodule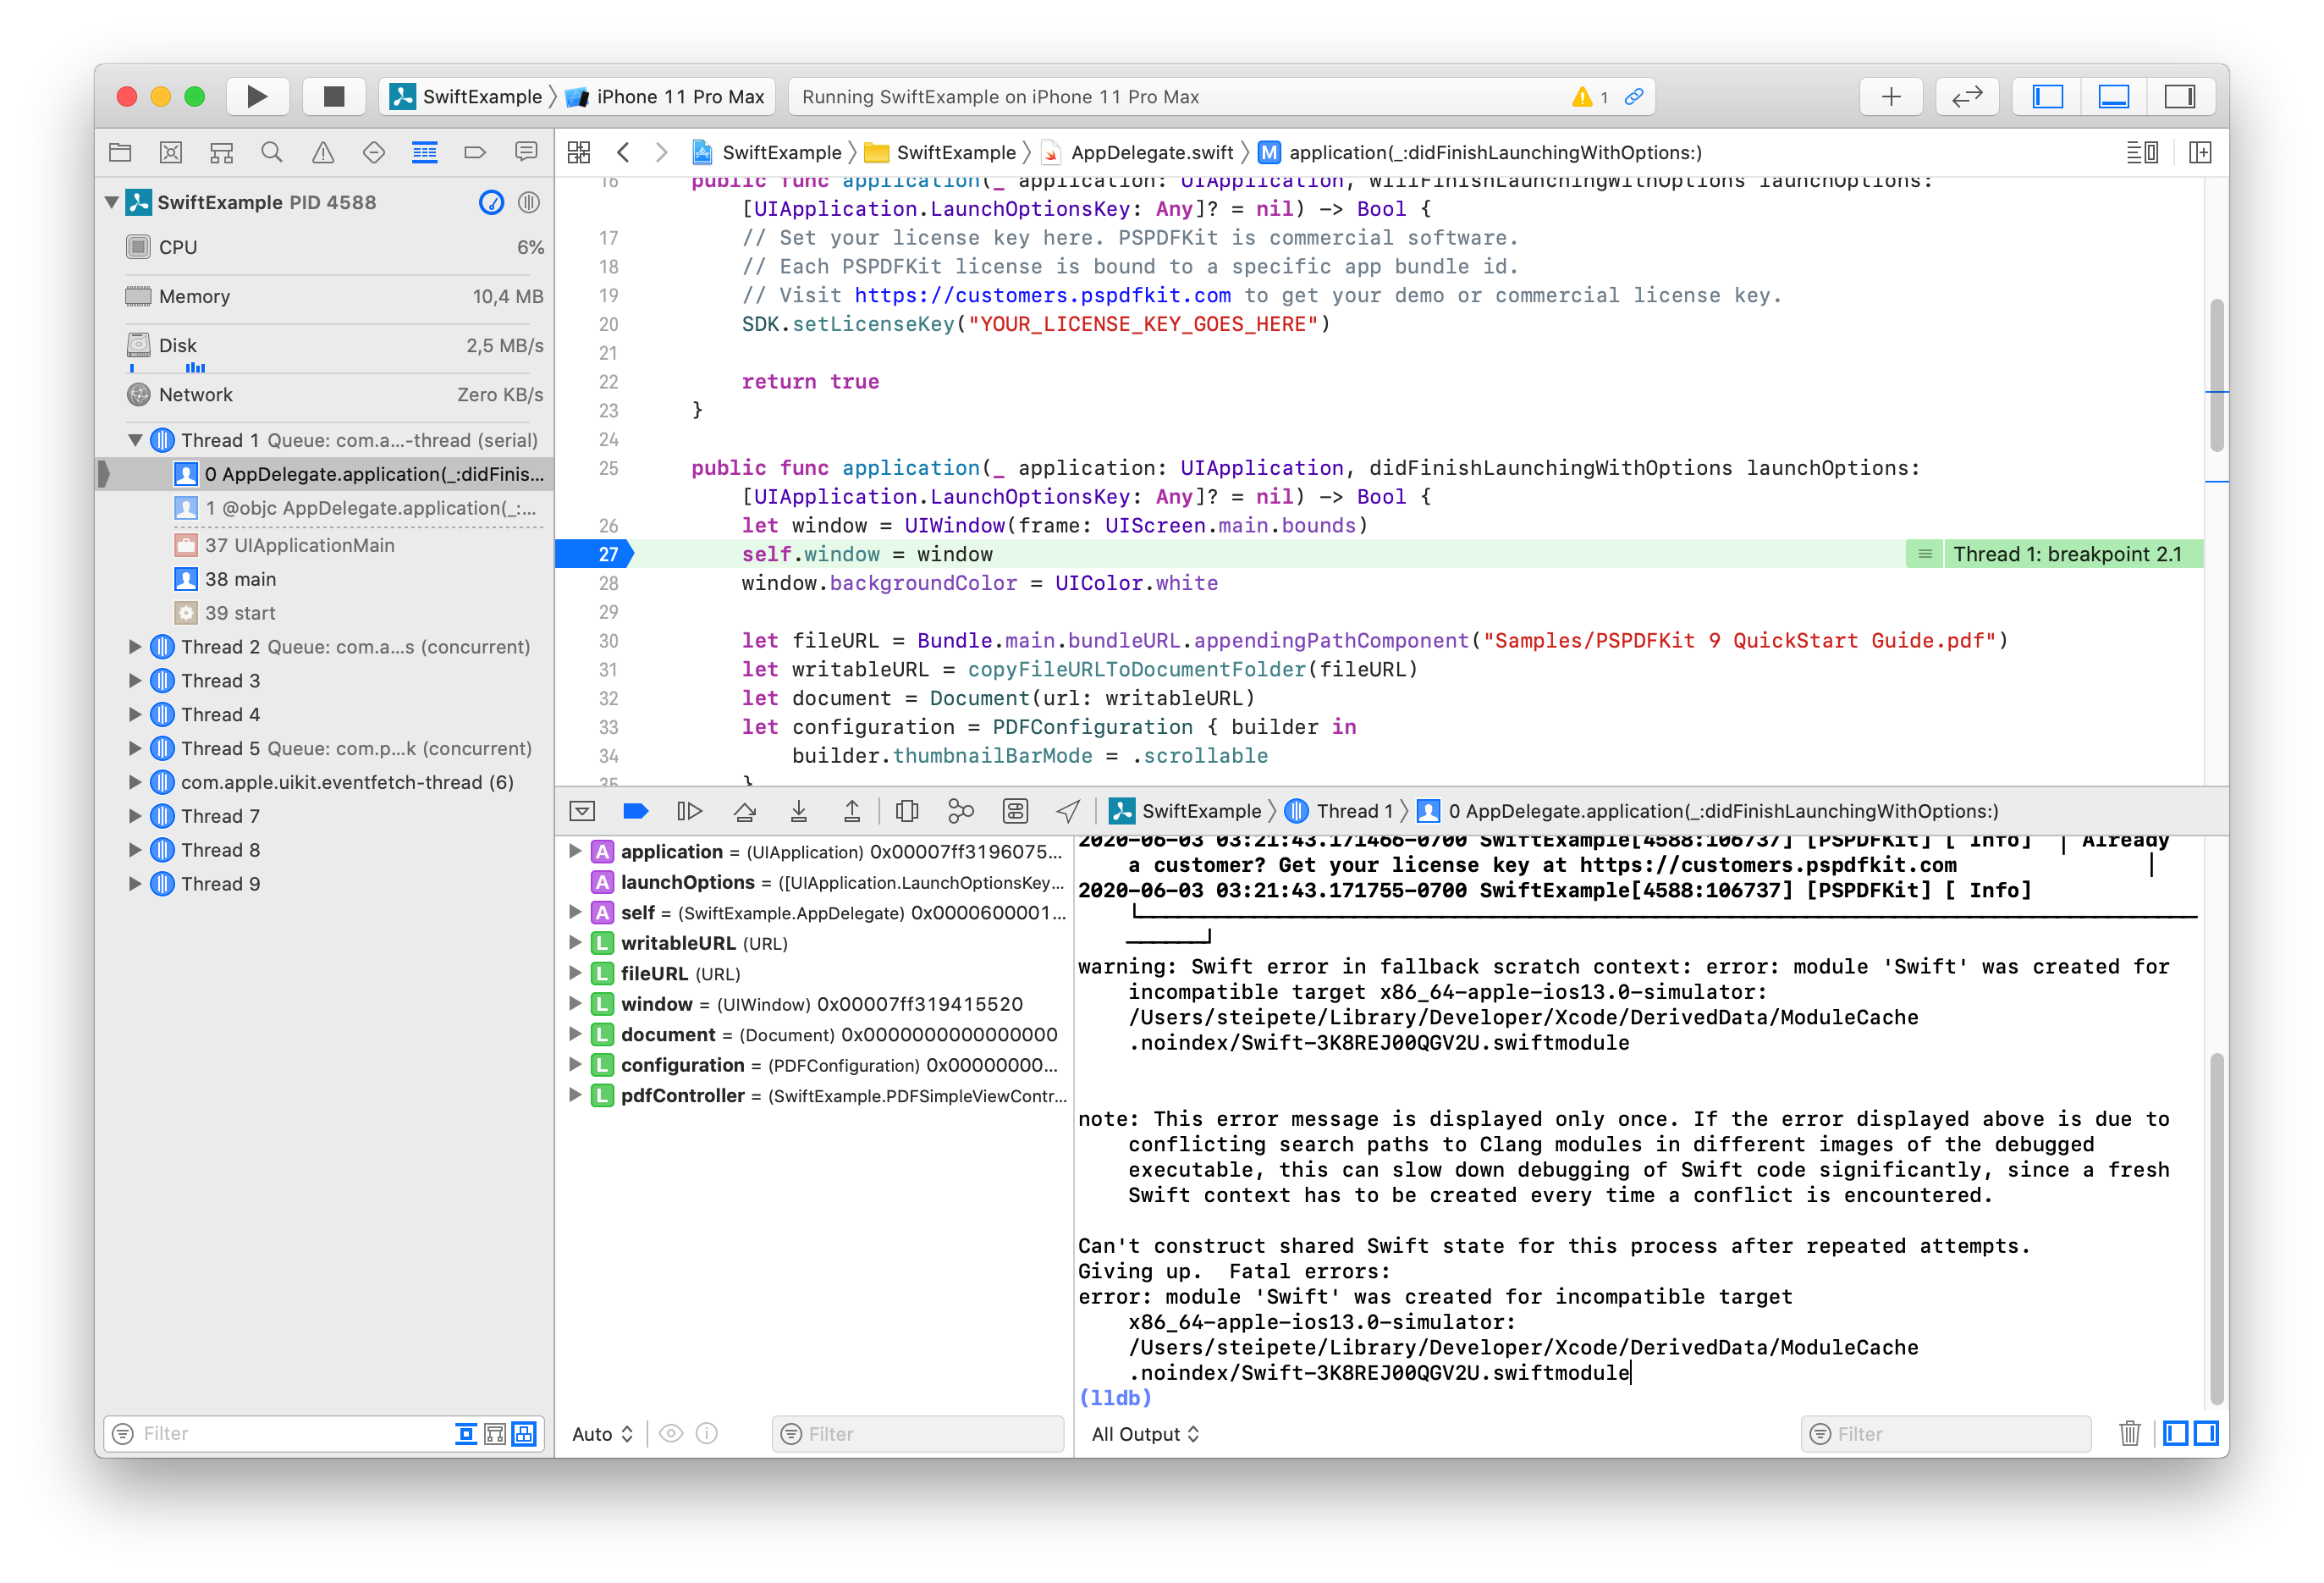
This is interesting, since we compile our SDK with BUILD_LIBRARY_FOR_DISTRIBUTION = YES, so with library evolution enabled. The incompatible target issue seems to be a different problem.
Enabling LLDB Logging
There’s another trick in LLDB that enables a great deal of logging: put log enable lldb types into ~/.lldbinit and you’ll see extremely helpful logs of how LLDB builds the debug context.
When we use this in our original failing setup, we get more information — more specifically, the all-product-headers.yaml that was also mentioned in SR-12783 is listed:
SwiftASTContext("PSPDFKitUI")::GetASTContext() -- failed to initialize ClangImporter:
error: virtual filesystem overlay file '/Users/steipete/Projects/lldb-debug-test/PSPDFKit/iOS/build/PSPDFKitUI/production/Build/Intermediates.noindex/ArchiveIntermediates/PSPDFKitUI.framework/IntermediateBuildFilesPath/PSPDFKitUI.build/Release-iphonesimulator/
PSPDFKitUI.framework.build/all-product-headers.yaml' not found
Comparing Binary Files
I was curious what -no-serialize-debugging-options changes in the binary, so I tried using Araxis Merge to track the changes. (Hex Fiend and MachO-Explorer are also useful.)
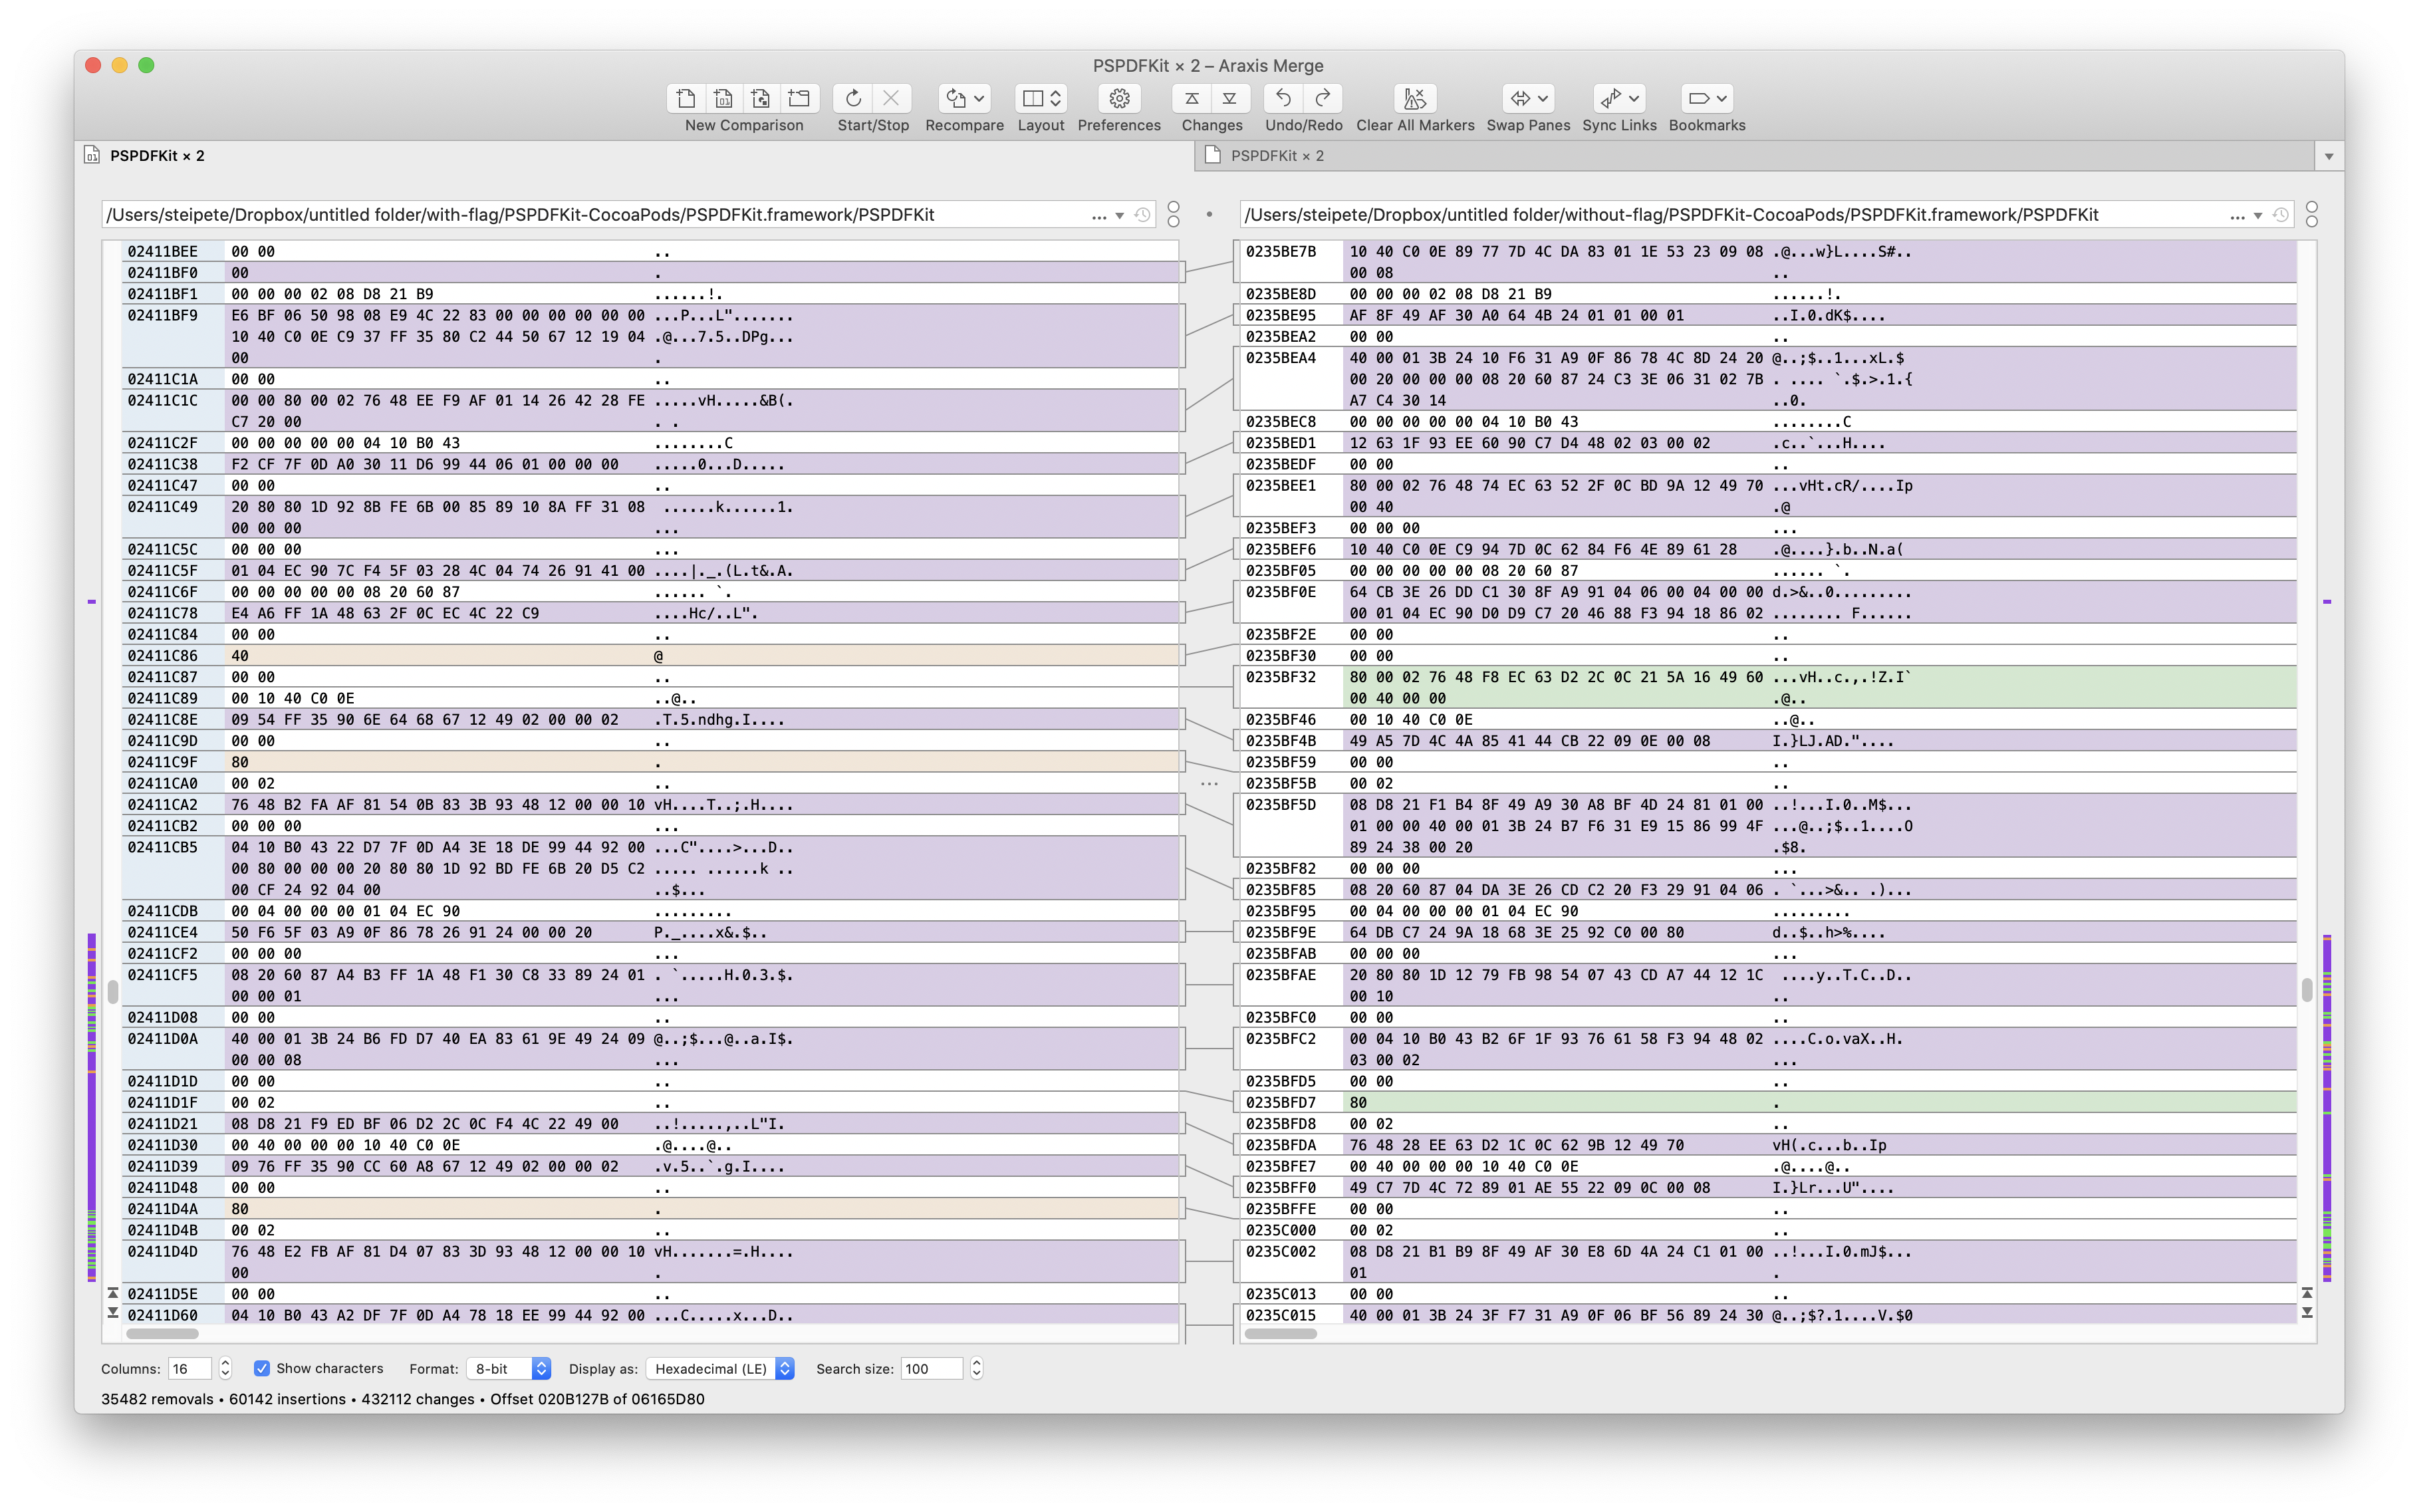
That turned out to be another rabbit hole, since Xcode doesn’t produce deterministic builds. Other build systems, like Buck, use various workarounds to achieve this, and there’s an effort to enable deterministic builds with Clang and LLD, but we’re not yet there.
We can compare the sizes of the Mach-O sections in the binary:
otool -l /bin/ls | grep -e ' cmd' -e datasize | sed 's/^ *//g'
Surprisingly, the size of the sections is exactly the same, no matter if this flag is set or not.
SWIFT_SERIALIZE_DEBUGGING_OPTIONS
I wondered: Is the flag even passed on? Am I using the right key? There’s very little on the internet that even documents SWIFT_SERIALIZE_DEBUGGING_OPTIONS, but it seems to be the same as OTHER_SWIFT_FLAGS = -Xfrontend -no-serialize-debugging-options. Changing the flag to include a type also breaks compilation, so the .xcconfig process definitely works.
The problem is that setting the flag doesn’t change anything for us. Here are the LLDB logs for different scenarios:
- ✅ mixed-mode debug with lldb and -no-serialize-debugging-options
- ❌ Swift-only debug with lldb and -no-serialize-debugging-options
- ❌ Swift-only debug with lldb and -no-serialize-debugging-options, latest toolchain for app
Luckily Swift is open source, so we can look up the commit introducing -no-serialize-debugging-options. This seems like the flag only controls what is written in a .swiftmodule file — which is saved in the dSYM.
(If you read my blog then you might be screaming: “Obviously! Adrian Prantl wrote that in SR-12783!” Yes. Sometimes I need some time to realize how things work. This includes the bit on how Swift modules are stored in the dSYM…)
SR-12932 and the dSYM Conspiracy
I filed SR-12932 - Custom toolchain picks up wrong target based on iOS deployment target and noticed that this can be worked around by raising the iOS Deployment Target to iOS 13.
Interestingly, it seems that the master branch of LLDB can reconstruct enough context to be able to make basic debugging work, where the version of Xcode 11.5 just gives up with the Couldn't IRGen expression error.
After rubber ducking this problem with a friend, he tried to reproduce the problem but it magically worked on his machine — debugging was fast and worked with Xcode 11.5. The difference? We downloaded a ZIP and unpacked it in /tmp where I use my home directory. First I tried a different username; I created a separate user in the VM and took the same steps, and I got the same IRGen error.
Then we looked where the strings containing steipete/Projects/lldb-debug-test (part of the folder where I compiled the binary) actually are. The -no-serialize-debugging-options flag promised these strings are not stored in the binary, and indeed, a PSPDFKit | strings check didn’t find anything.
Then it came to me: the dSYMs! I deleted the dSYM bundles that are simply stored in the same folder as the framework, did a clean rebuild (including deleting DerivedData) and voila — no more Couldn't IRGen expression! LLDB also initialized noticeably faster, and there was no trace of the build path in the log.
Which led me to the obvious next question: How are these dSYMs found? I know Apple uses Spotlight in its crash symbolication scripts to find dSYMs based on an UUID, and that /tmp is unlikely part of the Spotlight index, but this theory didn’t work out; even when I add the whole user folder to Spotlight’s excluded list, it still finds the dSYM. But if I move it just one folder up, then LLDB doesn’t see it anymore. (Unclear if LLDB finds this or some earlier process in Xcode finds it.)
Epilogue
I wrote everything up in SR-12933: lldb: Couldn’t IRGen expression; with -no-serialize-debugging-options, and hopefully somebody smarter than me picks this up and answers all the questions I have right now.
Adrian already answered the ticket and found a bug in dsymutil that would misdirect LLDB to the .swiftmodule files on disk (the ones on the machine the .dSYM was built with), and disregard the ones included in the .dSYM itself.
He also solved the LLDB lookup mystery. LLDB looks:
- next to the executable/dylib
- through any custom .dSYM location mechanism
- through Spotlight, using the UUID of the executable/dylib. Note that Spotlight doesn’t index
/tmp.
If you like stories like this, follow me on Twitter and read them as they happen.
-
Unless you also copy out the dSYM files, in which case LLDB fails. ↩