


A tale as old as time: a founding team ships their MVP, installs Google Analytics, watches pageview numbers go up, and feels good about themselves.
Three months later they realize they have no idea why users churn, what "activated" means, or which features actually matter, so they start duct-taping together a bunch of different tools to try to figure it out.
If you're early stage, that's months of valuable context you just missed by not setting yourself up with the right solution from the start – context that could've gotten you to product market fit faster.
Don't make the same mistake. This guide compares the best product analytics tools for startups, taking into consideration what actually matters at each stage of growth.
Before getting started, let's brush up on the basics:
Product analytics is event-based tracking that measures how users interact with your product, not just whether they visit your website. Every button click, feature used, form submitted, and page navigated becomes a data point you can query, filter, and act on.
Google Analytics tells you "10,000 people visited your site this week, 40% bounced, average session was 3 minutes." Useful for marketing, less useful for product decisions.
Product analytics tells you "User 4521 signed up Tuesday, completed onboarding in 3 minutes, used the core feature twice, then never came back."
What to look in product analytics tools at as a startup:
For a deeper dive, check out our AARRR pirate metrics framework guide.
Building a mobile app? See our comparison of the best mobile app analytics tools. If open source matters to you, we've also rounded up the best open source analytics tools.
Product-market fit means you've built something people actually want – and keep coming back to. It's the point where retention curves flatten instead of declining to zero, users start recommending your product without being asked, and growth feels like it's pulling you forward rather than being pushed.
The problem is that PMF isn't binary – it's a spectrum. Most startups think they have it before they actually do.
For a deeper framework on how to think about this, read our founder's take on the product-market fit game – it breaks PMF into five levels you need to clear, from finding a real problem to onboarding your first reference customers.
We also have a full guide on how to measure product-market fit using a combination of surveys, retention data, and word-of-mouth signals.
Your situation: You have an MVP with a few hundred users. You don't know if they're getting value. Retention is a mystery. The product might look completely different in six weeks.
The metrics that matter: focus on building a key metrics dashboard and finding your activation metrics, aka the actions correlated with long-term retention. Correlated is key – you're not guessing, you're testing which actions predict whether someone comes back.
You should also be looking at onboarding completion rate (funnel from signup → first meaningful action).
Pair your analytics tool with:
Not sure which tools to use?
We've compared the best session replay tools, best open source session replay tools, and best in-app survey tools for developers and startups.
Your situation: Users are returning. Revenue is growing. You have a small team. The question shifts from "does this work?" to "how do we grow efficiently?"
The metrics that matter:
Pair your analytics tool with:
Not sure which tools to use?
We've compared the best feature flag tools, open source A/B testing tools, error tracking tools, and open source LLM observability tools for developers and startups.
Your situation: You have a larger organization, perhaps including a data team. Reliability matters as much as growth. Enterprise customers ask about SLAs and data residency.
The metrics that matter:
Pair your analytics tool with:
You don't need one to get started. A lot of product analytics tools are designed so a single engineer or technical founder can set up tracking, build funnels, and run experiments without dedicated data infrastructure.
Most modern analytics platforms also feature AI-powered tools that let anyone on the team ask questions in plain language instead of writing queries from scratch.
For example, PostHog AI can generate SQL queries, build funnels and retention charts, create insights and dashboards, summarize session replays, draft surveys, and help debug why a metric looks off – all from a natural language prompt. It won't replace a data team at scale, but it means you're not blocked while you're still small.
Now that you have a rough idea of what to measure, here's what to measure it with:
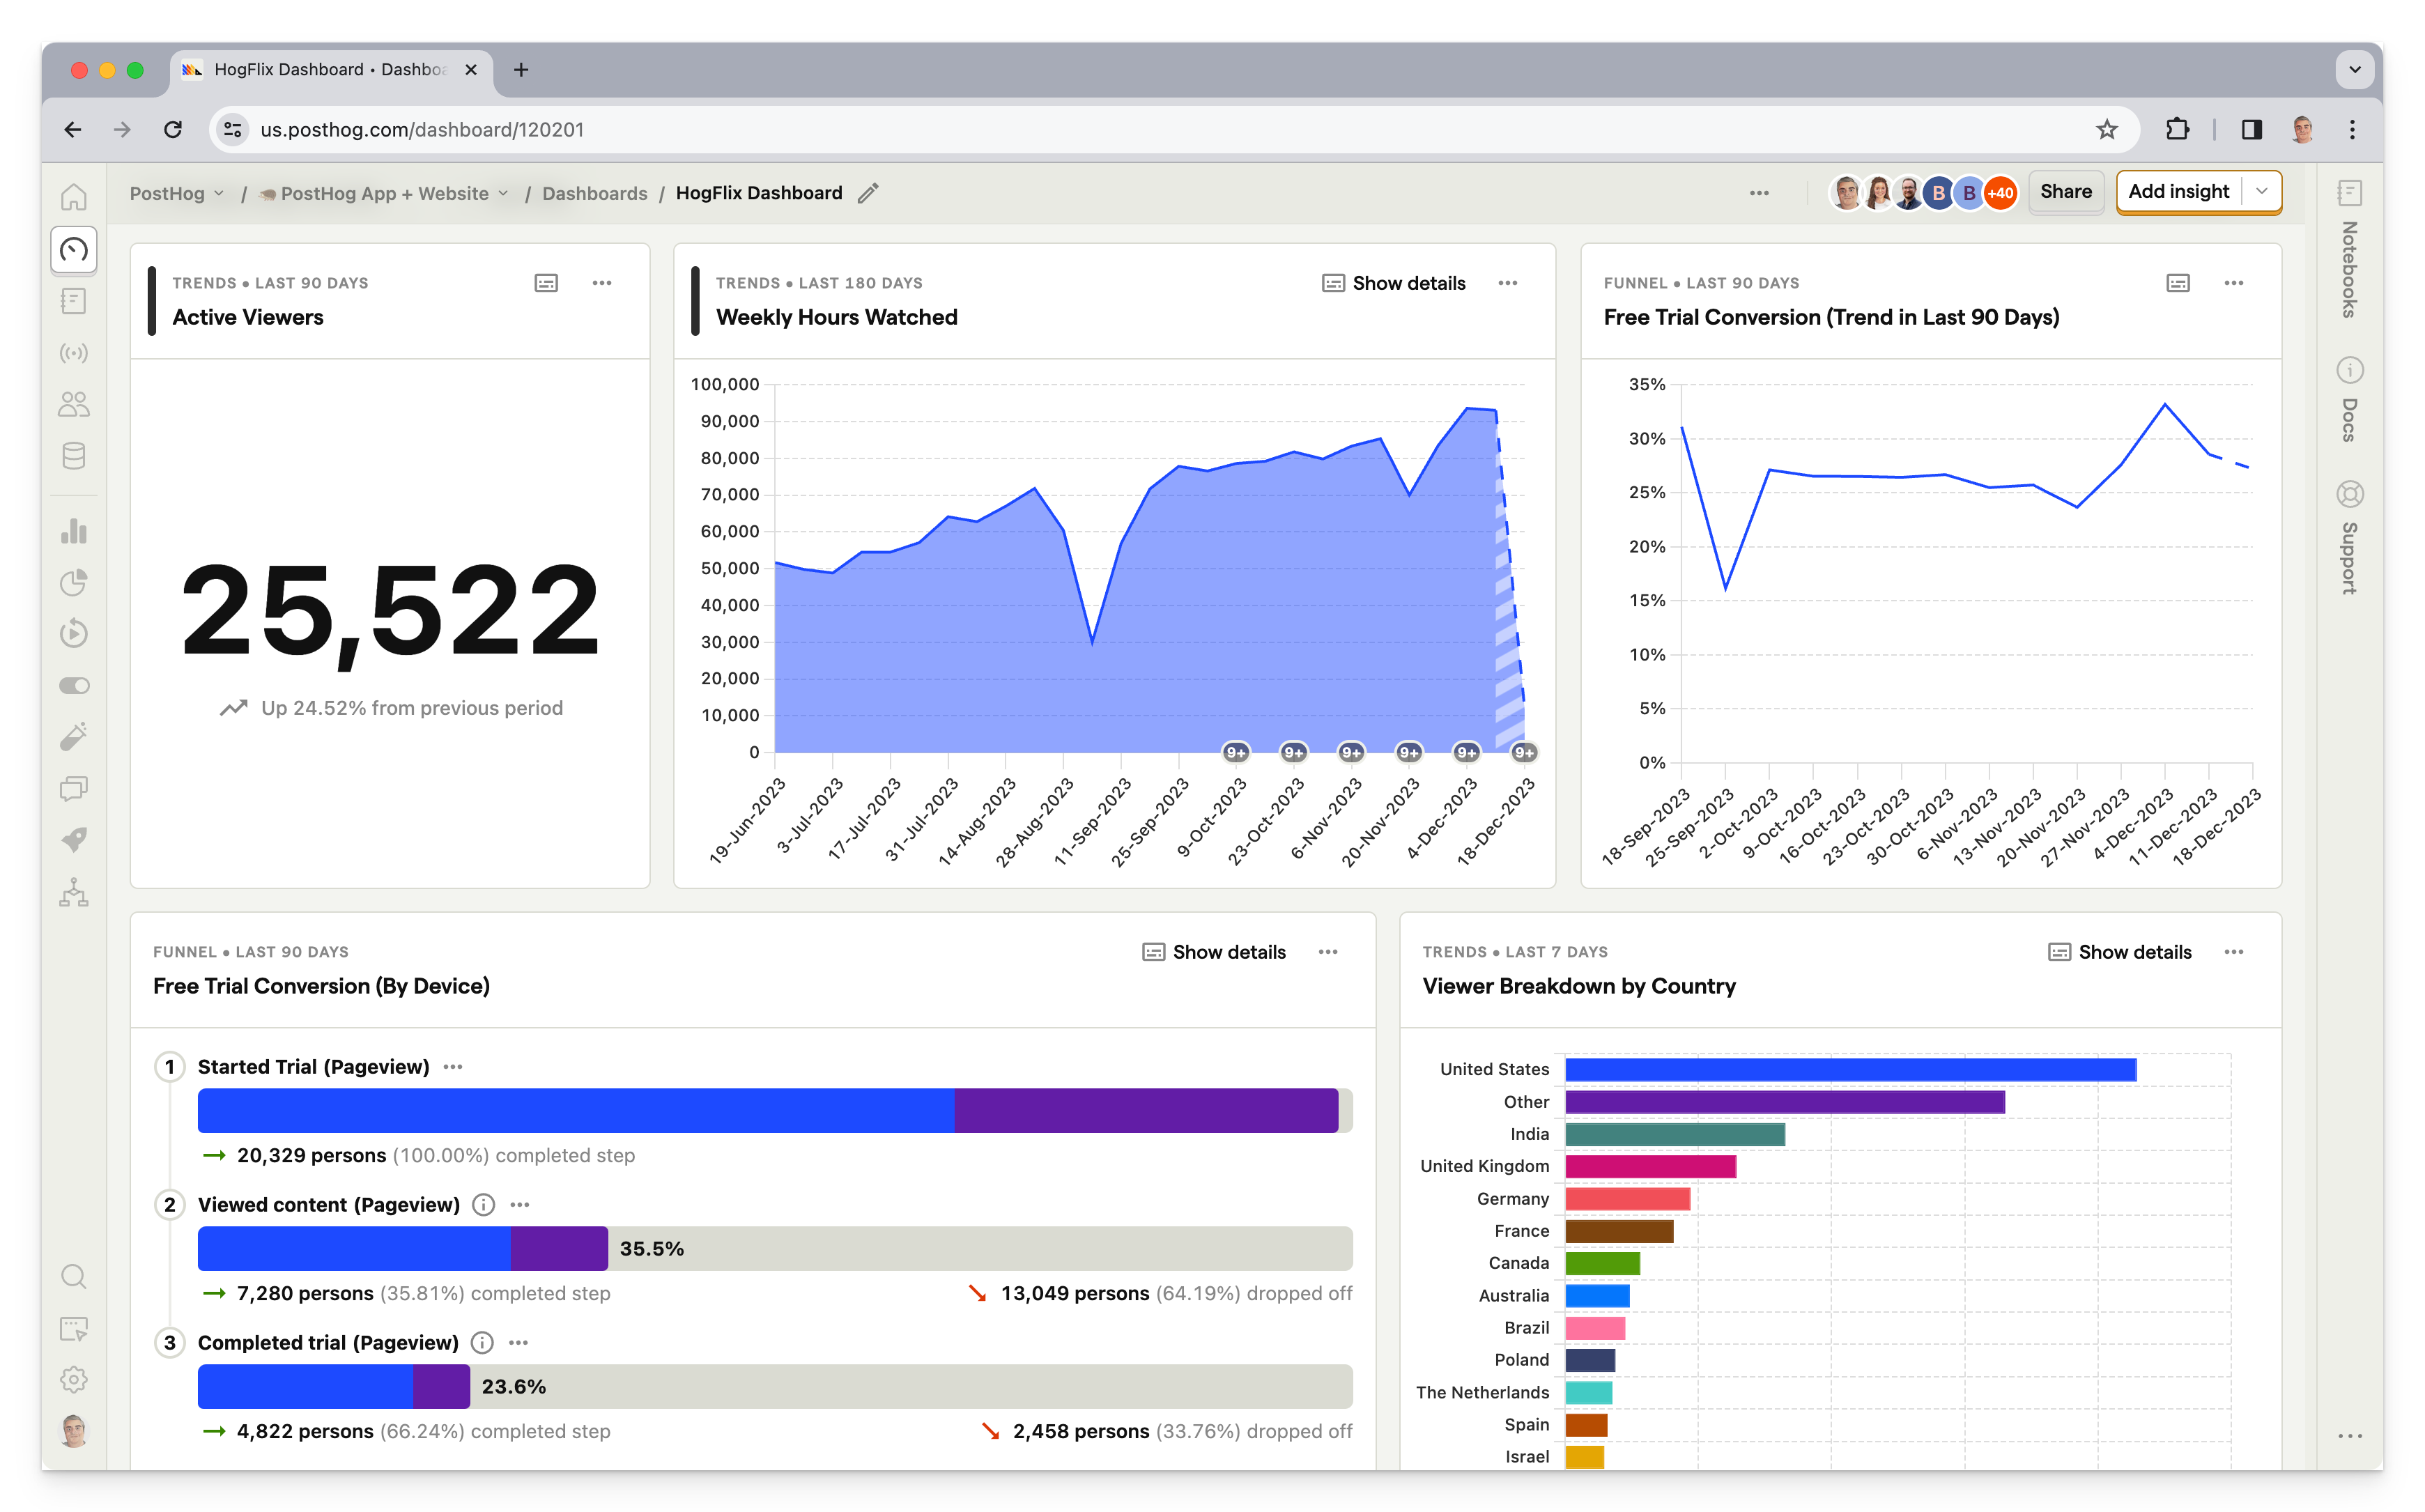
PostHog is an all-in-one developer platform that bundles product analytics with web analytics, session replay, feature flags, A/B testing, surveys, error tracking, logs, LLM observability, workflows, and more. It's open source at its core, with cloud hosting in both the US and EU.
PostHog ships fast, so the platform keeps getting better; check the changelog to see what's new.
Every product has its own generous free tier, so you pay nothing until you have real traction. Over 90% of companies on PostHog pay $0! If you're an early-stage startup (less than 2 years old, under $5M raised), you may also qualify for the PostHog for Startups program – $50,000 in credits for a year, plus partner benefits and merch.
Billing limits per product mean no surprise bills, and you don't need a credit card to get started. Features that other tools gate normally behind enterprise pricing, like reverse proxy, can be accessed in the free tier.
There is no need to jump on a "quick sales call" or to request a demo (unless you want to talk to a human), PostHog is fully self-serve.
Create a free account at posthog.com, pick US or EU hosting, and you're in. No credit card needed.
Getting started takes minutes; our docs walk you through instrumentation step by step, or you can just paste a snippet in your <head> tag and autocapture starts collecting data immediately.
Want to skip the manual setup entirely? You can try out the PostHog wizard, which detects your framework, installs the right SDK, and configures everything for you.
| Product | Free tier (monthly) | After free tier |
|---|---|---|
| Product analytics + web analytics | 1M events | $0.00005/event |
| Session replay | 5K recordings | ~$0.005/recording |
| Feature flags + experiments | 1M requests | $0.0001/request |
| Surveys | 1,500 responses | $0.10/response |
| Error tracking | 100K exceptions | $0.00037/exception |
| Data warehouse | 1M synced rows | $0.000015/row |
| LLM observability | 100K events | $0.00006/event |
| Logs | 50GB ingested | $0.25/GB |
| Workflows | 10K messages/channel | $0.003000/email |
| PostHog AI | 2,000 credits | $0.01/credit |
Every product is billed independently – you only pay for what you use beyond the free tier, and there are bulk discounts for higher usage. No per-seat fees, you get unlimited team members on every plan.
Use the pricing calculator to estimate costs based on your actual volume.
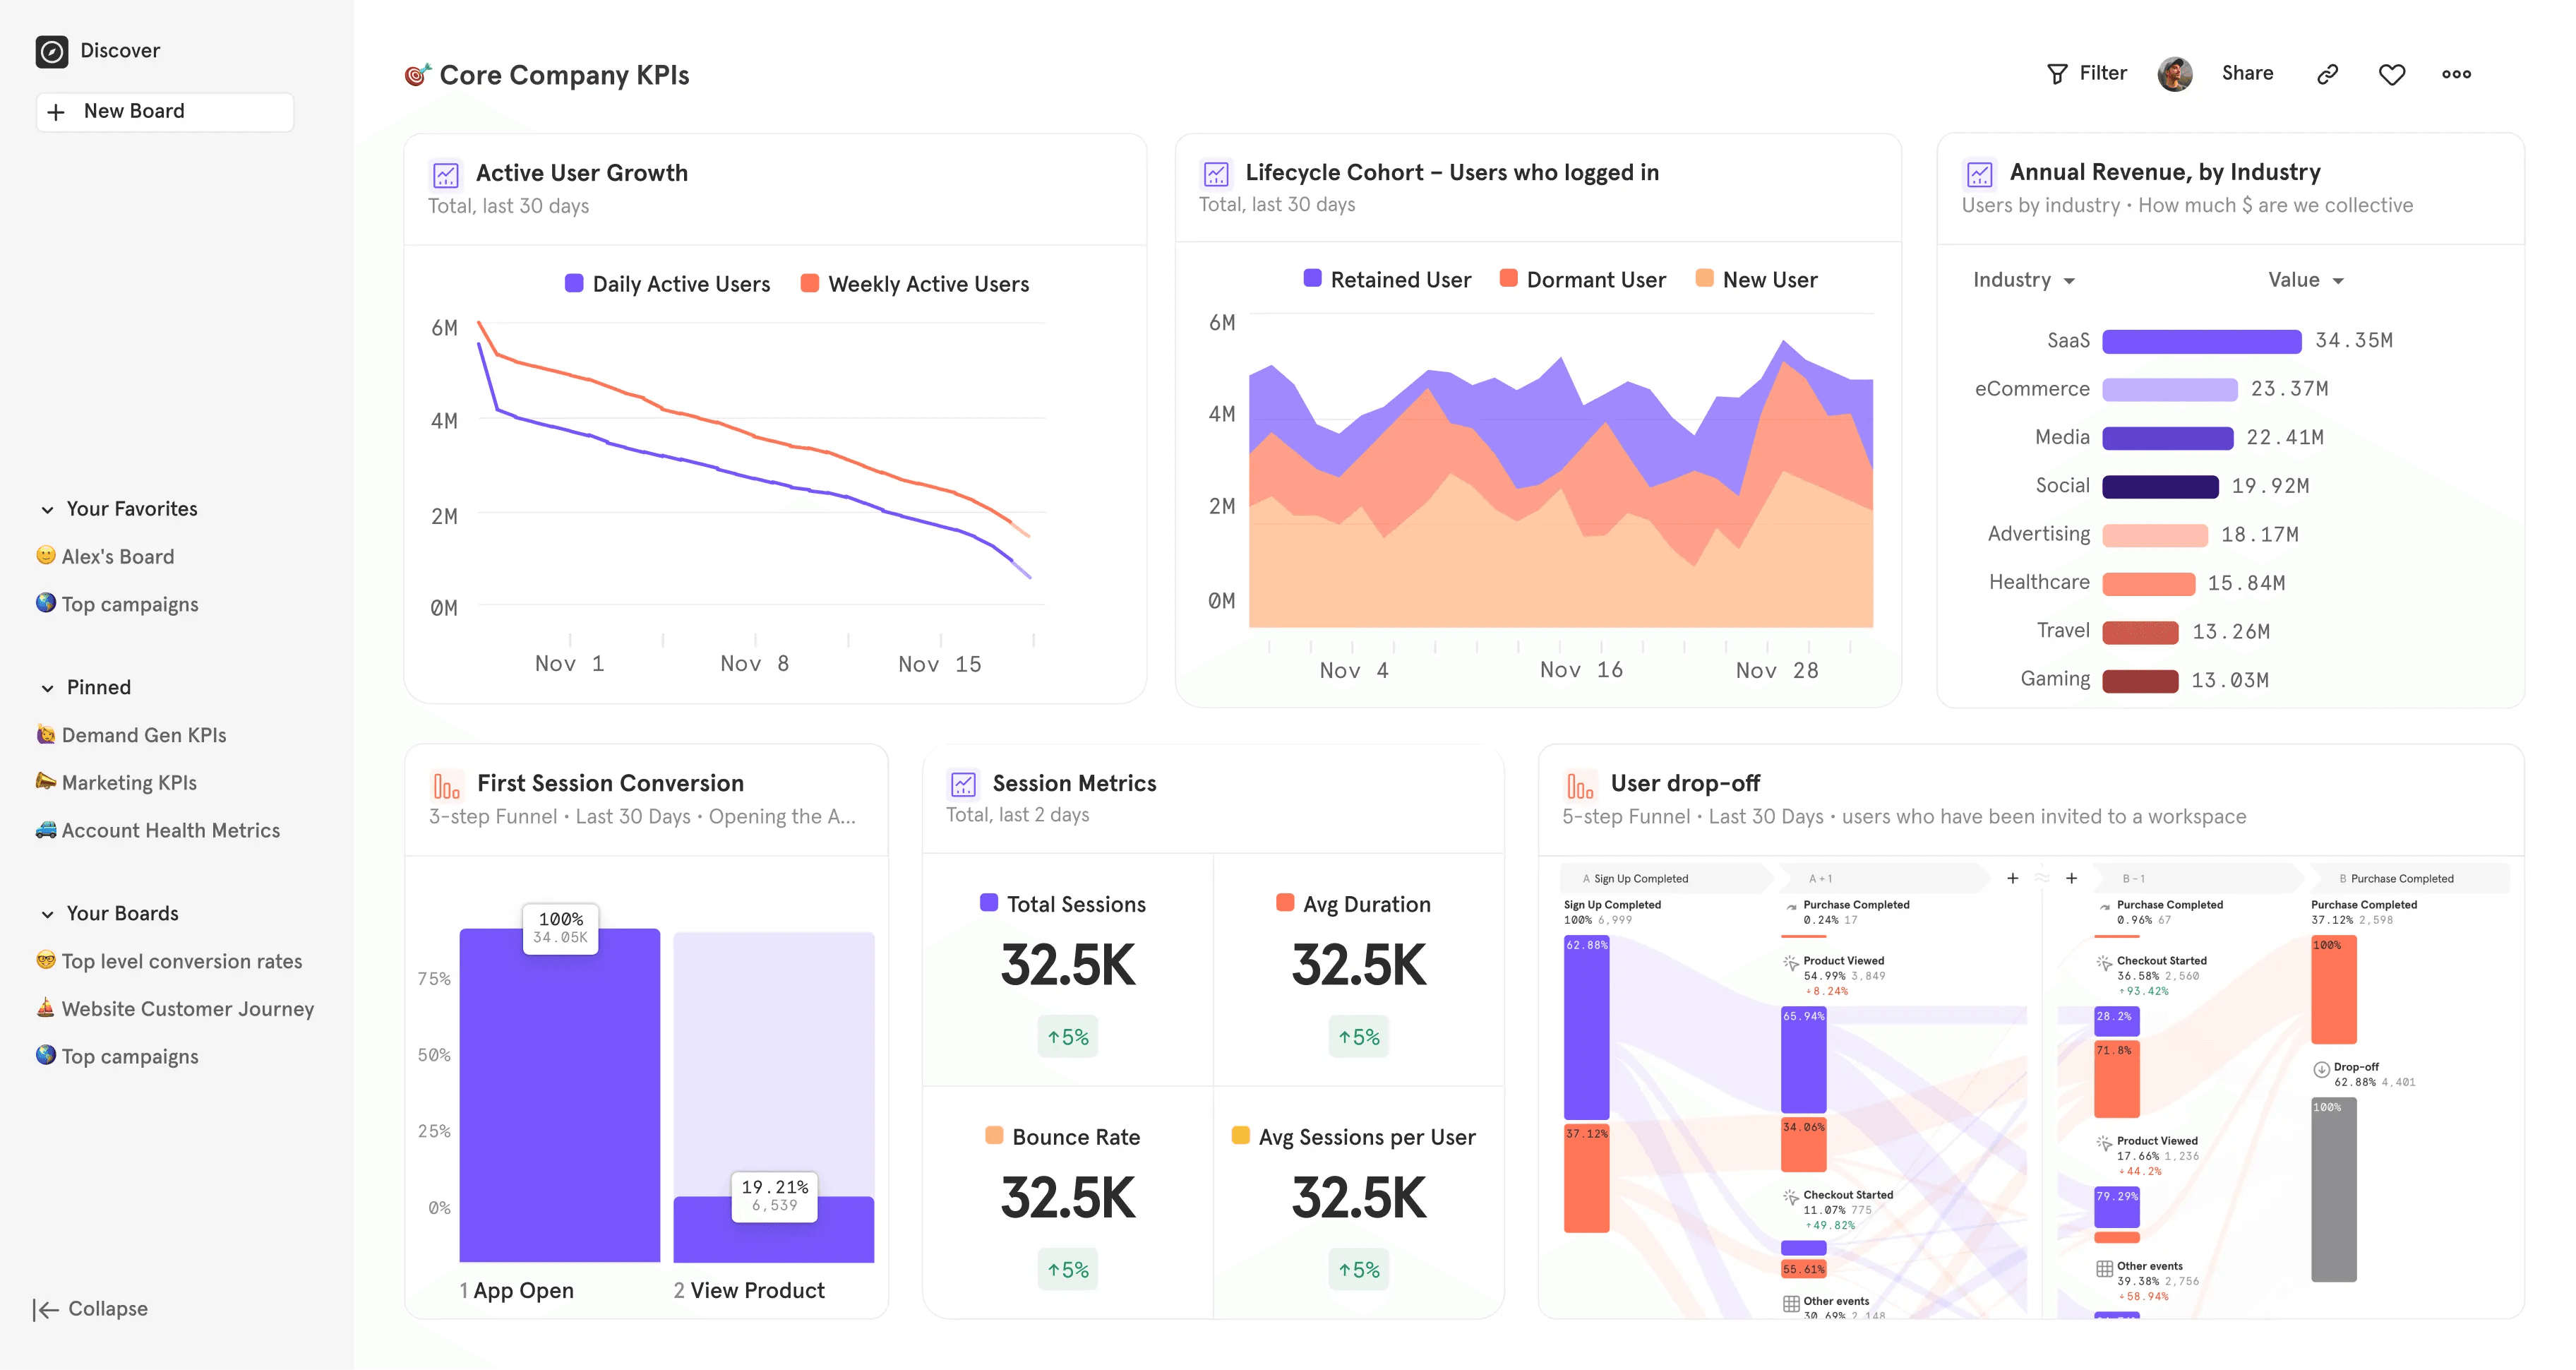
Mixpanel is a product analytics platform focused on funnels, retention, and cohort analysis – with session replay, feature flags, and A/B testing now built in. If analytics depth is your primary requirement, Mixpanel's query interface is fast and polished. The Spark AI builder helps non-technical team members explore data without learning the event model.
Mixpanel's experiments and feature flags launched in late 2025, so the platform is moving toward a more integrated workflow – though it still doesn't cover surveys or error tracking. Session replay is also relatively new, so it's less mature than dedicated replay tools.
The startup program is the headline for eligible teams: companies under 5 years old with ≤$8M raised get the first year free – up to 1B events, 500K replays, and advanced features.
Self-serve signup – no credit card required. Paste a JavaScript snippet before your closing </head> tag, or install an SDK. You can also connect an existing data source via Segment, RudderStack, or warehouse connectors.
Autocapture is available for web. For mobile and server-side, you'll need to instrument events manually.
The startup program requires an application – eligibility is verified, and data must be flowing within 90 days of acceptance or you lose access.
| Plan | Price | Includes |
|---|---|---|
| Free | $0 forever | 1M events/mo, 10K replays, 5 saved reports |
| Startup | Free first year | Up to 1B annual events, 500K replays (if eligible) |
| Growth | From $0 | $0.28/1K events after 1M free |
| Enterprise | Contact sales | Unlimited events, governance |
The free plan covers core analytics but excludes several features startups often need as they grow: behavioral cohorts, custom properties, formulas, and saved metrics are limited.
Account-level analytics, experiment reporting, and feature flags are paid add-ons. Monitoring is capped at 5 alerts per project, and there's no anomaly detection, root cause analysis, or Metric Trees.
If you're pre-PMF and just need funnels and retention, the free tier works. Once you're running experiments or tracking B2B accounts, you'll hit the upgrade wall quickly.
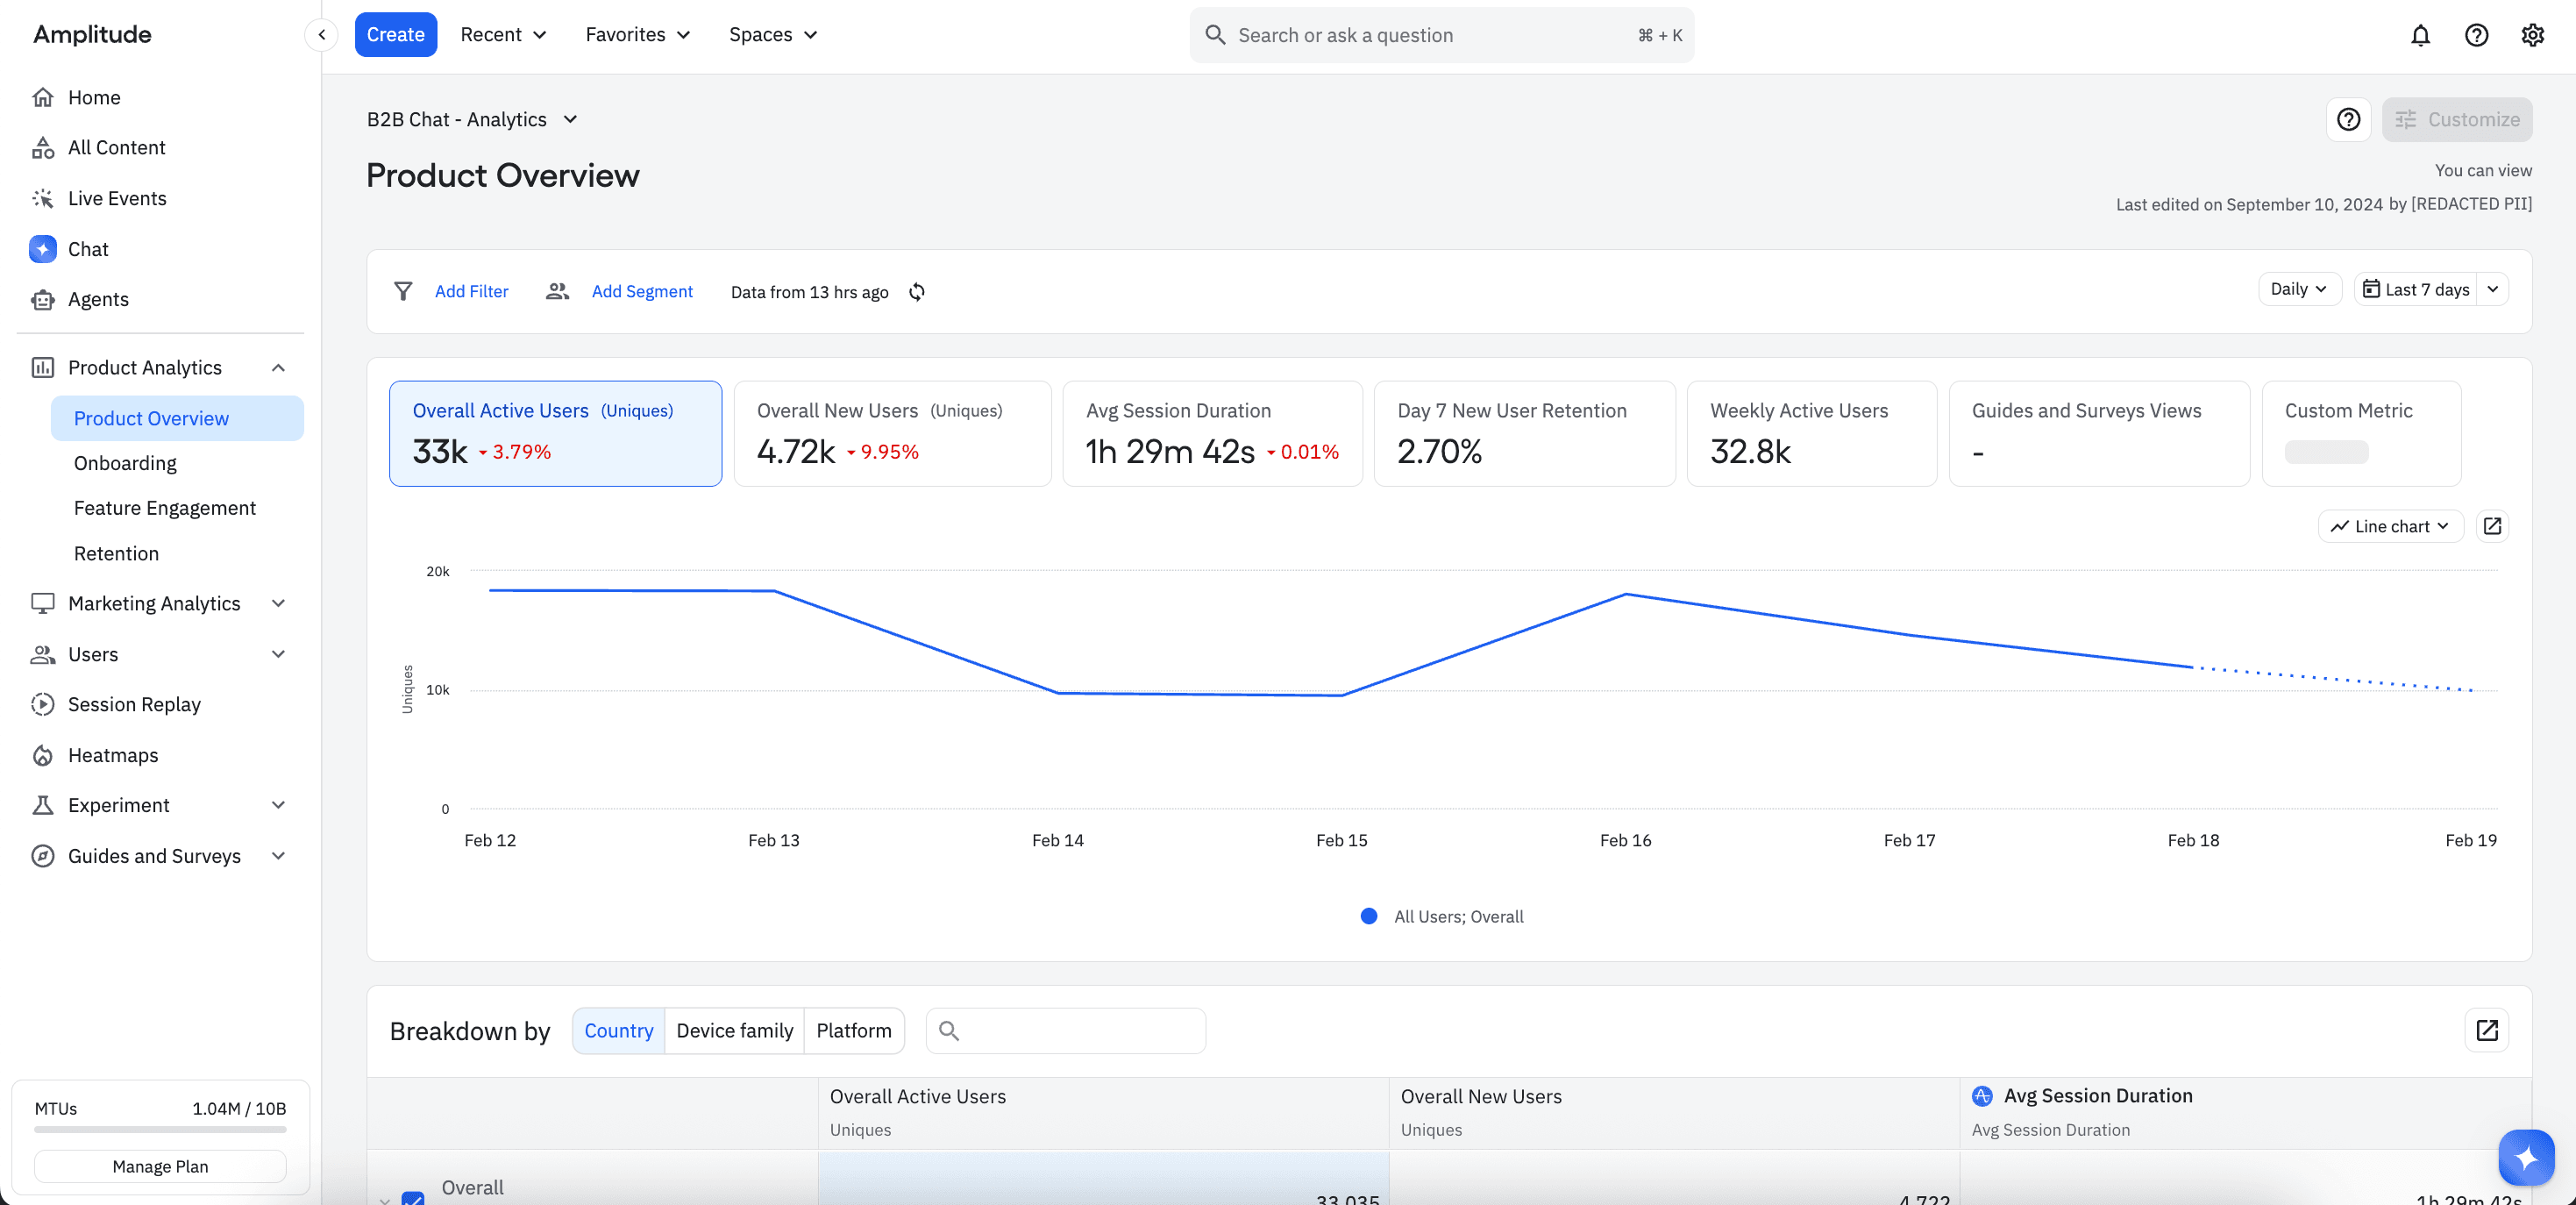
Amplitude is a retention-focused analytics platform known for the deepest cohort math in the category – N-day, unbounded, and bracket retention with cohort comparison overlays. If understanding why users come back (or don't) is your primary workflow, Amplitude's retention tooling is best-in-class.
The platform has expanded well beyond analytics. It now includes session replay, feature flags, A/B testing (Amplitude Experiment), and Guides & Surveys. A Unified Browser SDK lets you initialize analytics, replay, experiments, and guides in a single call.
Amplitude uses a monthly tracked user (MTU) billing model. One user who triggers 500 events costs the same as one who triggers 5 – attractive for products with high per-user engagement. However, anonymous users count as MTUs until merged, which can inflate costs for products with lots of anonymous traffic.
Self-serve signup for the Starter (free) and Plus plans. Install an SDK or use the Unified Browser SDK to initialize analytics, replay, experiments, and guides in one call. You can also paste a <script> snippet in your <head> tag for a no-build setup.
For data already in a warehouse, connect Snowflake, BigQuery, or Redshift directly.
| Plan | Price | Includes |
|---|---|---|
| Starter | Free | 50K MTUs, 10M events, unlimited flags, session replay, AI chat |
| Plus | From $49/mo (annual) | 300K MTUs or 25M events, behavioral cohorts, saved charts, web experiments |
| Growth | Contact sales | Custom MTUs, causal insights, predictive audiences, feature experimentation |
| Enterprise | Contact sales | Cross-product analytics, multi-armed bandits, warehouse-native, EU residency |
Guides & Surveys, extra session replay volume, and additional automated syncs are available as add-ons on Plus plans.
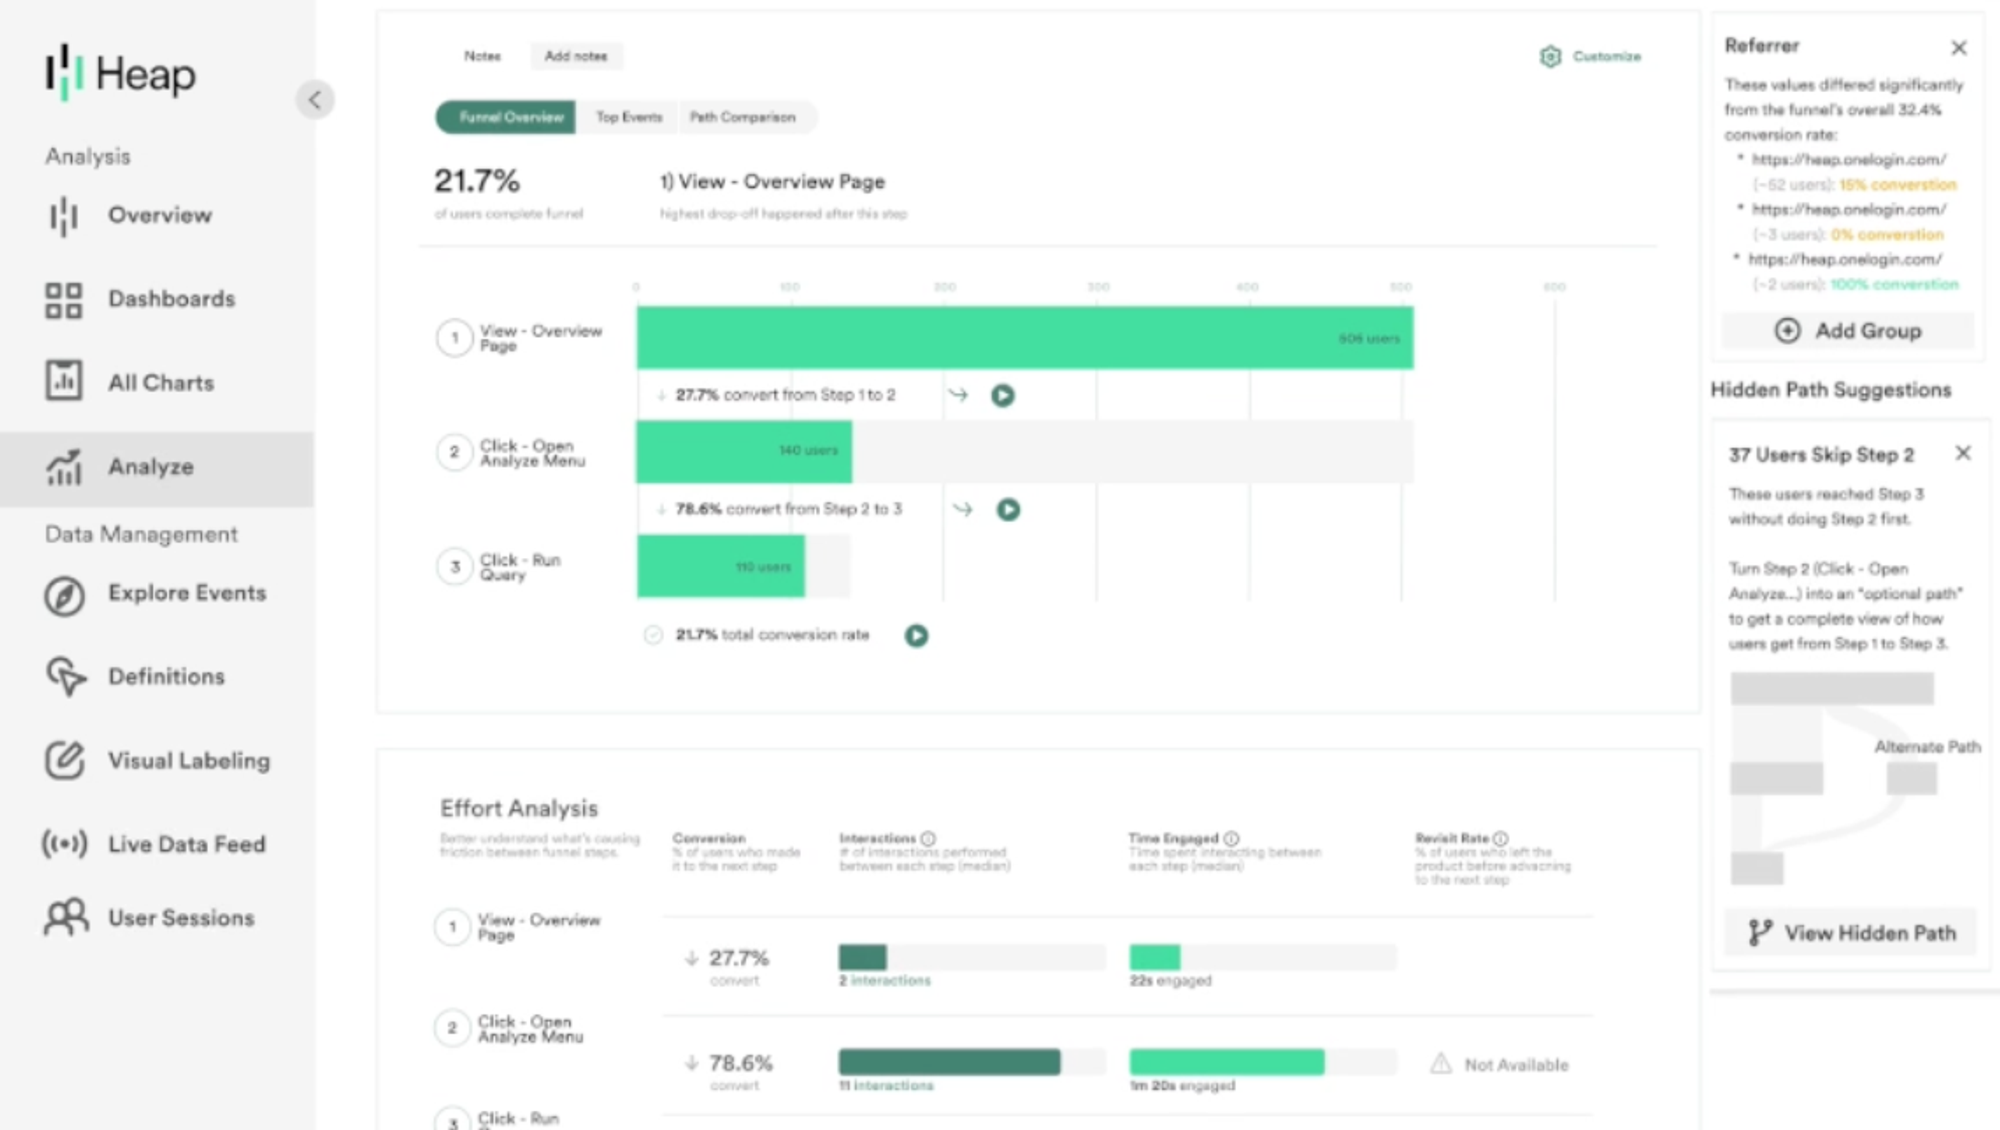
Heap is an analytics platform that records every user interaction automatically, then lets you define events retroactively using a visual point-and-click editor in a Chrome extension.
Famous for their autocapture capabilities, Heap is particularly appealing for non-technical founders and early-stage teams who don't want to commit to a tracking plan before they understand what matters. The free plan includes 10K sessions/mo, 6 months of data history, and SSO.
Worth noting: Heap was acquired by Contentsquare, and the tools are merging into one platform. For feature flags, surveys, and error tracking, you'll need separate tools.
Paste the Heap snippet on your site and autocapture starts recording every interaction immediately.
Use the Chrome extension for visual labeling to define named events on top of the autocaptured data – point and click on any UI element to create a named event retroactively. For mobile, install the iOS or Android SDK, though autocapture is web-only and mobile requires manual event instrumentation.
If you already have data flowing through Segment or a warehouse, Heap supports those as import sources too.
| Plan | Price | Includes |
|---|---|---|
| Free | $0 | 10K sessions/mo, core charts, 6 month data retention |
| Growth | Install snippet for estimate | Session-based pricing |
| Pro/Enterprise | Contact sales | Advanced features, longer retention |
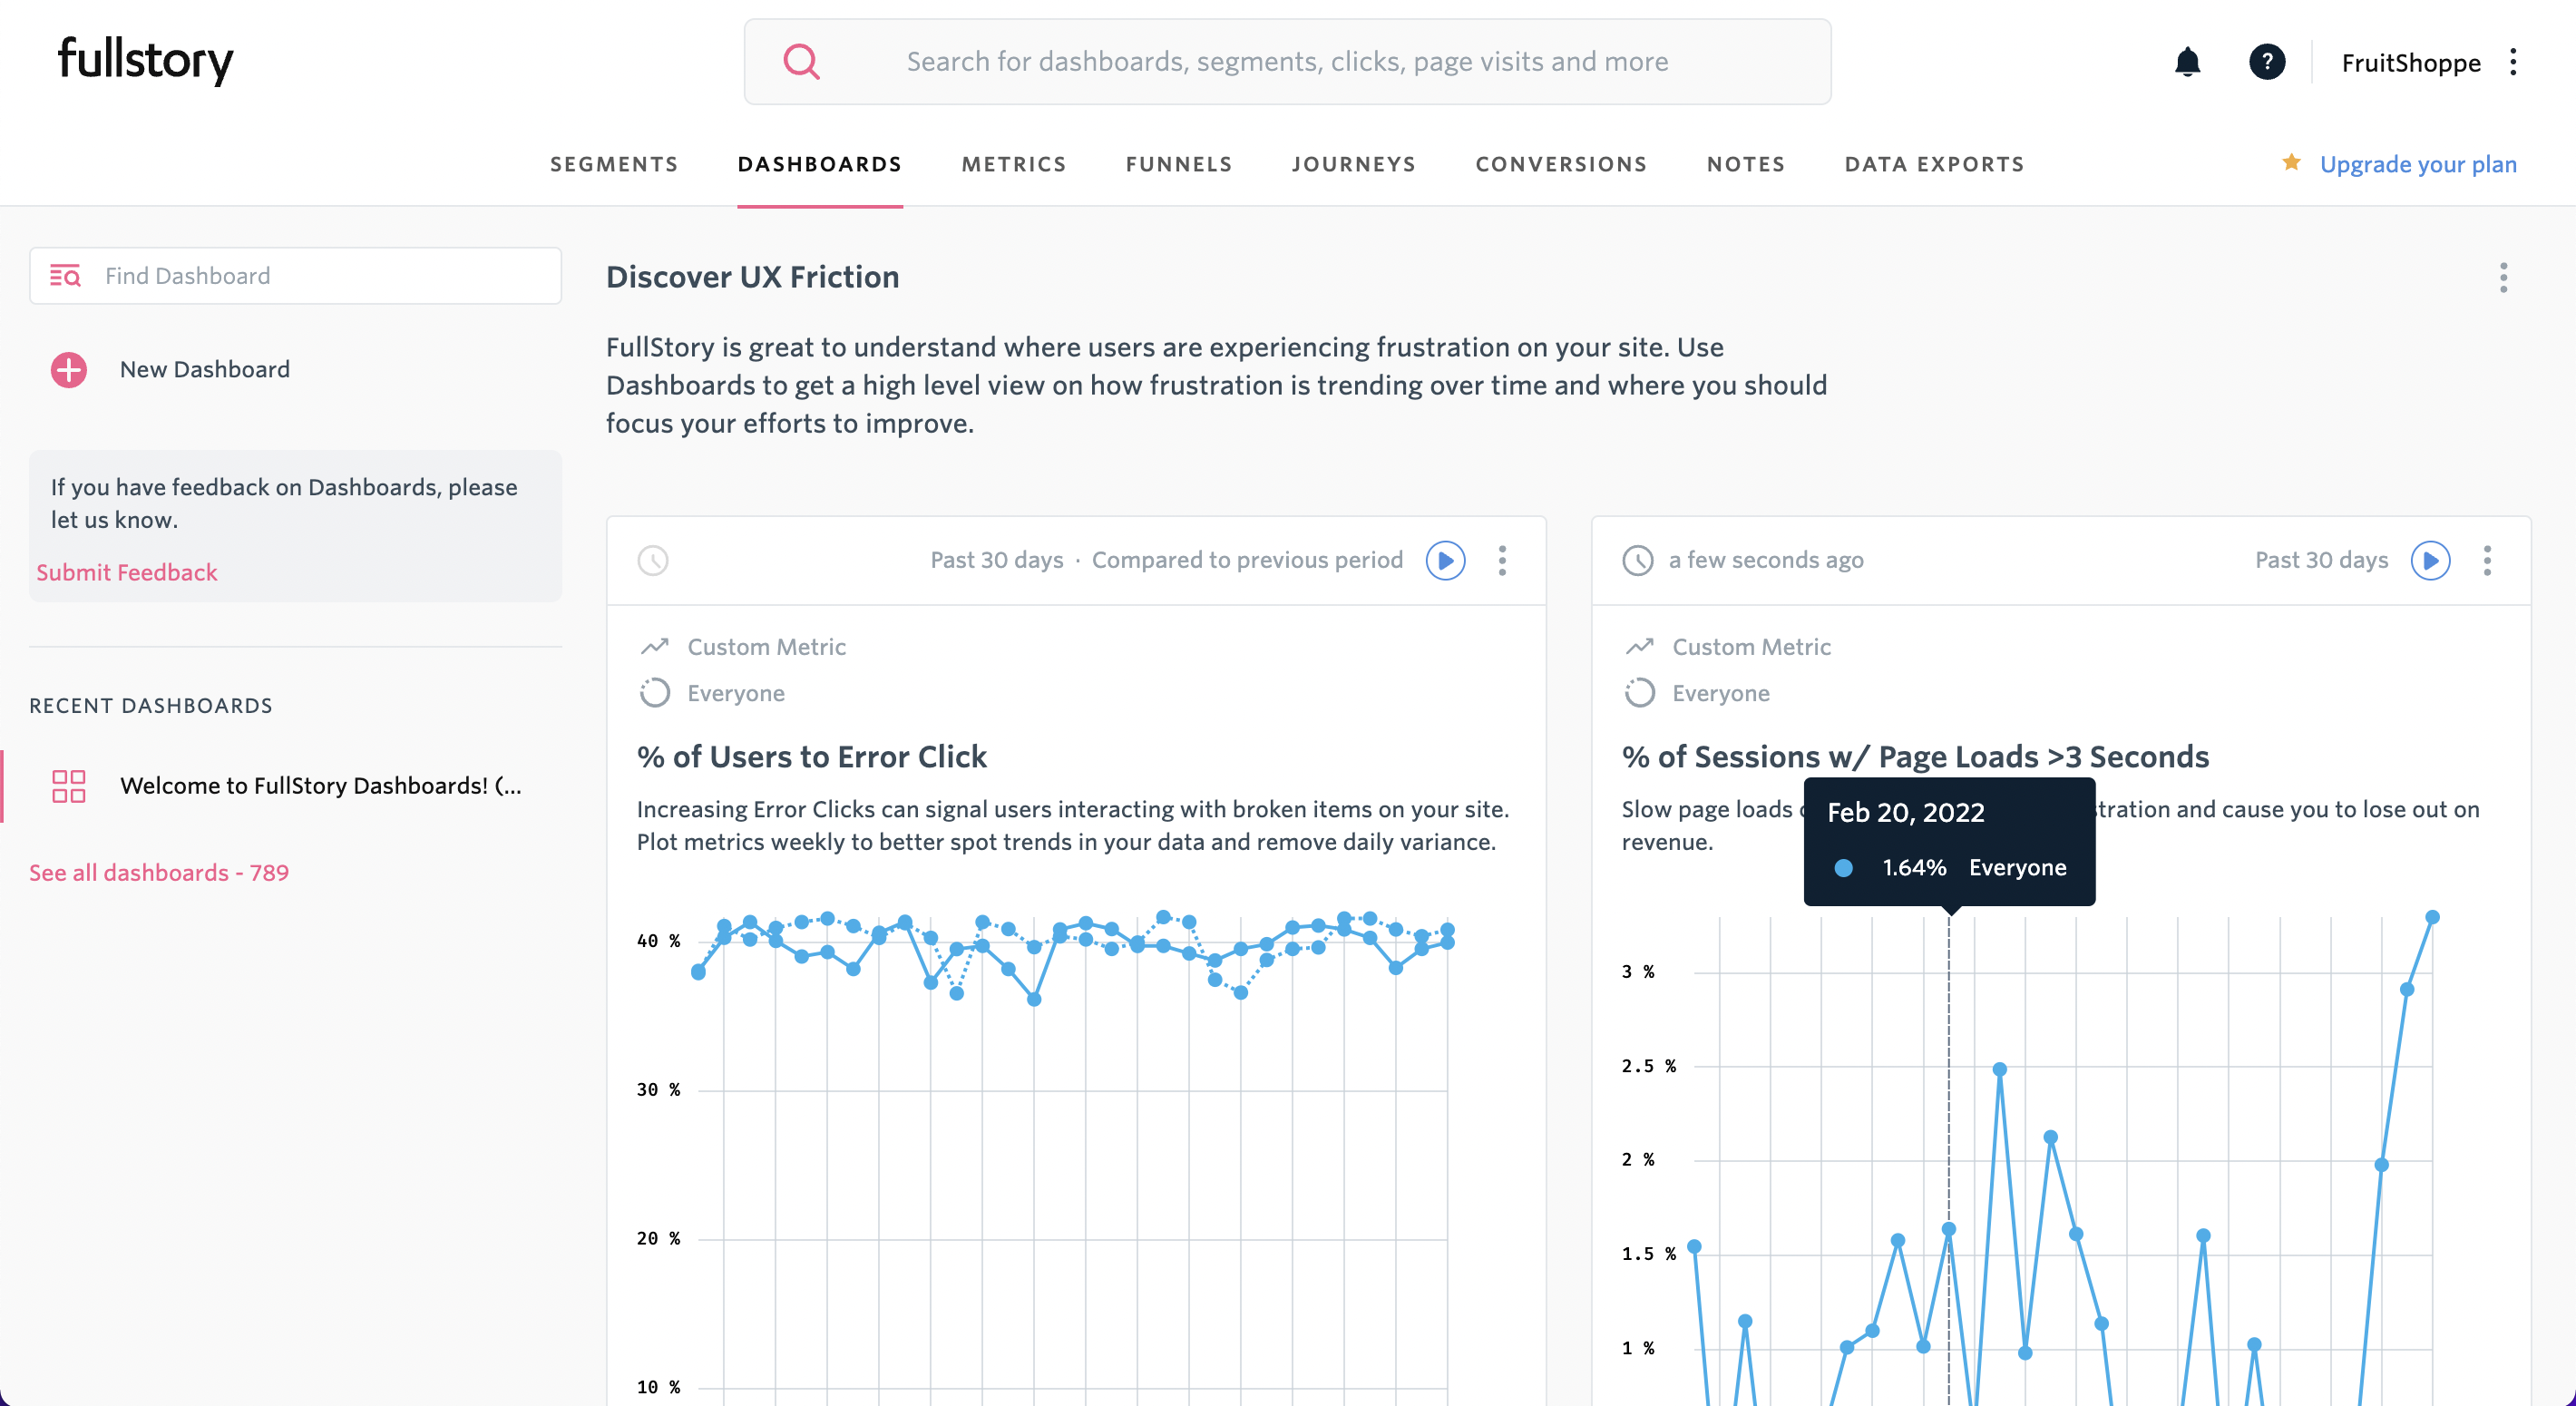
Fullstory is a session replay-first platform with product analytics layered on top. It flips the typical analytics workflow: instead of starting with dashboards and drilling into data, you start with session replays and layer quantitative analytics on top.
The "tagless" autocapture engine records user interactions without manual instrumentation, and AI-generated session summaries cut review time (you can read a summary instead of watching a 15-minute session).
The trade-off is depth: Fullstory's funnels and retention are lighter than its competitors, and all pricing tiers require contacting sales. Mobile analytics is a separate paid add-on. For feature flags, surveys, and error tracking, you'll need separate vendors.
Contact sales for all tiers. No public self-serve signup for full functionality.
All tiers (Business, Advanced, Enterprise) require contacting sales. Mobile analytics is a separate add-on. No public pricing available.
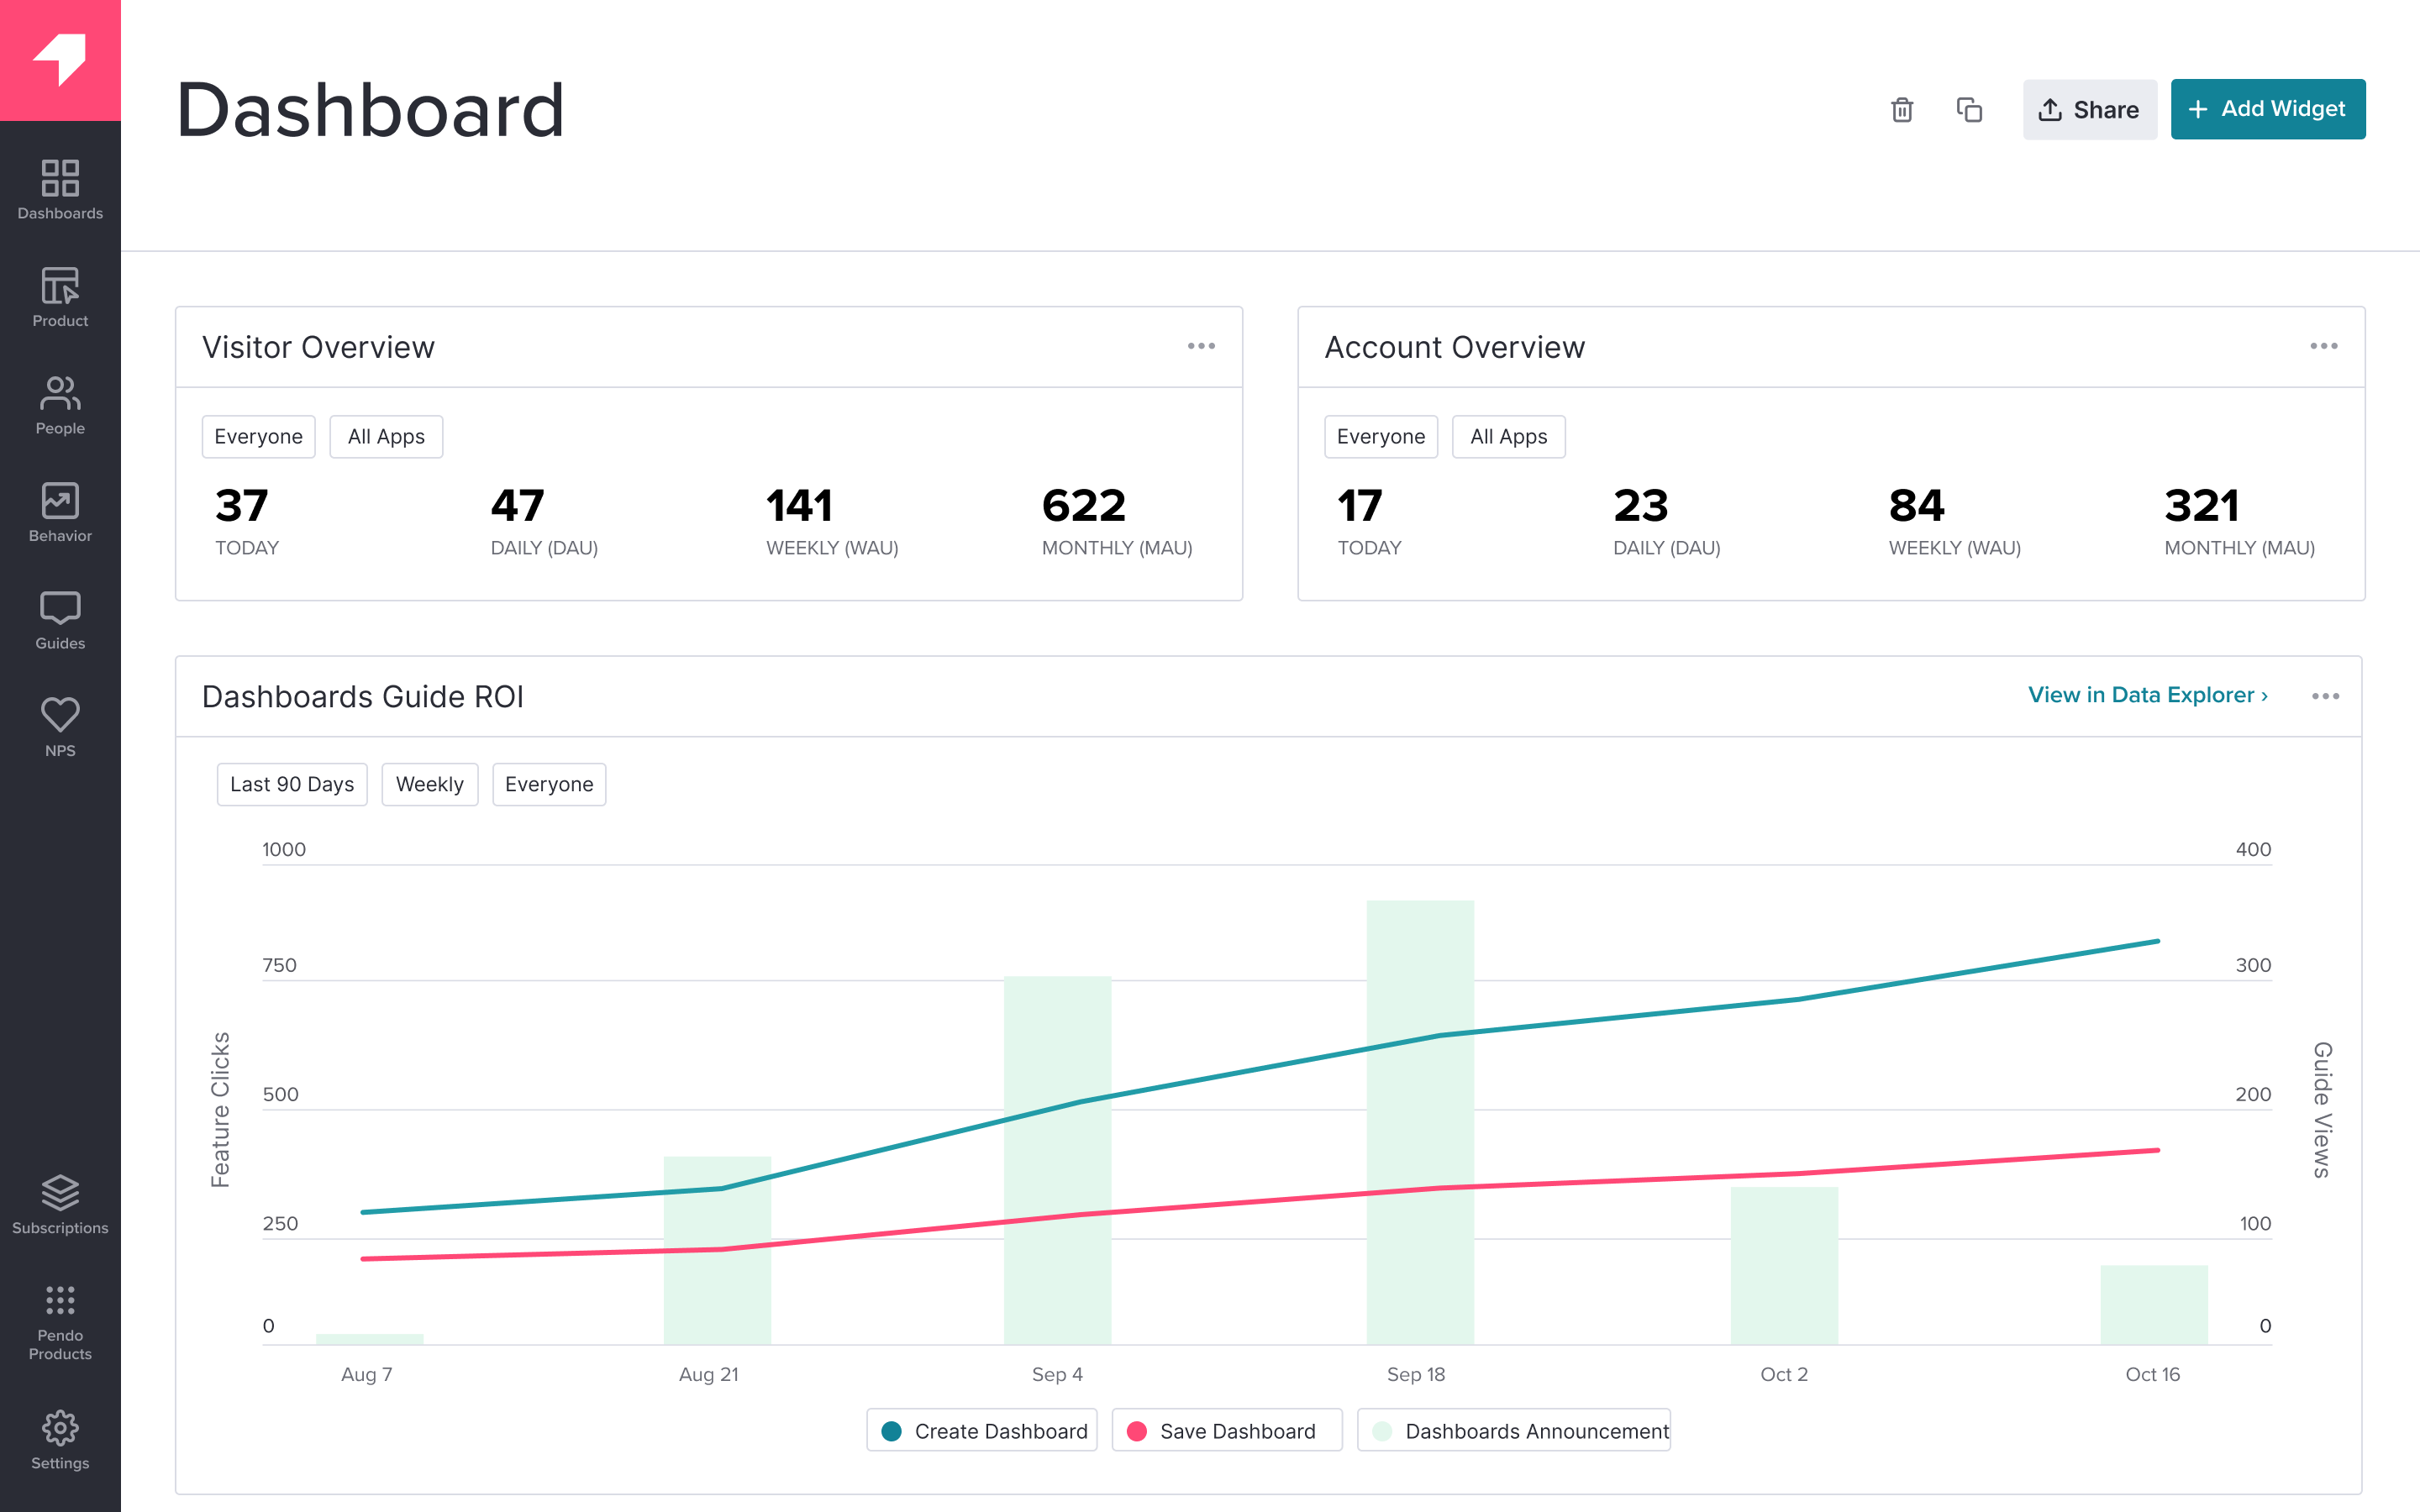
Pendo pairs product analytics with in-app guides, tooltips, walkthroughs, and NPS surveys. Its strength is the insight-to-action loop: see that 60% of users never discover your highest-retention feature, then build an in-app guide pointing them to it.
The free plan includes 500 MAUs with retroactive analytics, in-app guides, NPS, and roadmap tools. If your primary need is onboarding users and measuring their behavior in the same tool, Pendo's integration between analytics and guides is solid.
The trade-off: Pendo excludes anonymous users from retention analysis entirely, so if you have a large unidentified user base you'll get an incomplete picture. For session replay, feature flags, and error tracking, you'll need separate vendors.
Free plan available (500 MAUs). Self-serve for the free tier. Paid plans require contacting sales for MAU-based pricing.
| Plan | Price | Includes |
|---|---|---|
| Free | $0 | 500 MAUs, analytics + guides + NPS |
| Growth | Contact sales | MAU-based pricing, more guides |
| Enterprise | Contact sales | Governance, SSO, advanced analytics |
Pre-PMF: Speed over depth. Get data flowing in an afternoon and focus on three questions: are users signing up, are they reaching core value, are they coming back? See if your product has legs.
Post-PMF: You've validated the product. Now you need to understand why it works and how to grow efficiently. The tool you chose at the MVP stage either scales with you or becomes technical debt.
Scale-up: Reliability, data quality, and cost control matter as much as insights. You need warehouse integrations, group analytics for B2B accounts, and compliance features like EU residency and SSO.
The bundled approach means less setup, shared context across products, and one bill.
The unbundled approach gives you flexibility to swap individual tools, but every additional vendor means another data model, another integration, and another place where user context gets lost.
The wrong pricing model can cost you significantly more depending on your product's usage pattern.
"Free tier" means very different things across tools.
Some tools give you the full product at low volume. Others gate core features behind paid plans and call the rest "free." Before committing, check: how many events/sessions/users are included? Which features are restricted? Do you need a credit card? How long is data retained?
| Tool | Free tier | Pricing model | Self-serve? | Best for | You'll also need... |
|---|---|---|---|---|---|
| PostHog | 1M events/mo | Events (per product) | Yes | All-in-one platform | Nothing – it's bundled |
| Mixpanel | 1M events/mo | Events | Yes | Pure funnel/cohort analysis | Replay, flags, surveys, errors |
| Amplitude | 10K MTUs | MTUs | Partial | Retention depth | Replay, flags, surveys, errors |
| Heap | 10K sessions/mo | Sessions | Yes | Retroactive autocapture | Flags, surveys, errors |
| Fullstory | 10K sessions/mo | Contact sales | No | Replay-first analysis | Flags, surveys, errors |
| Pendo | 500 MAUs | MAUs | Free tier | Analytics + in-app guides | Replay, flags, errors |
For pre-PMF startups and solo founders
For post-PMF and scaling teams
For engineering-heavy teams
For product managers and less technical teams
For teams building AI-powered products
Start minimal. Install PostHog's autocapture snippet (or run our AI setup wizard). You'll start collecting data right away.
Define your activation hypothesis, build one funnel, watch 5-10 session replays a week. You need to answer three questions: are users signing up, are they reaching core value, are they coming back? The rest can wait.
A tracking plan is a document that defines every event you track, its properties, and its naming conventions. You don't need one on day one – autocapture gets you started immediately. But once you have multiple people instrumenting events or your product has grown beyond a few core flows, a tracking plan prevents duplicate events, inconsistent naming, and data you can't trust.
Match tool to stage: activation metrics pre-PMF, retention cohorts post-PMF.
Compare pricing models against your product's usage pattern: events (PostHog, Mixpanel), MTUs (Amplitude), MAUs (Pendo).
Check whether you need adjacent tools (replay, flags, experiments, surveys, error tracking...) in the same platform or are fine managing separate vendors.
And check mobile SDK support if building native apps.
Yes. PostHog has SDKs for iOS, Android, React Native, and Flutter. Mixpanel and Amplitude also have broad mobile support. Heap is primarily web. Fullstory's mobile is a paid add-on.
Mobile apps generate more events per session than web, so factor that into cost estimates on event-based pricing.
See our comparison of the best mobile app analytics tools.
Instead of tracking pageviews, event-based analytics records specific user actions – button clicks, feature usage, form submissions, purchases, API calls – as discrete data points with properties attached.
This lets you build funnels across any sequence of actions, segment users by behavior, and answer questions like "what did users who retained do differently in their first session?"
Autocapture automatically records every user interaction (clicks, page views, form submissions) without you writing code for each one. You get data immediately but may need to filter noise.
Manual tracking requires you to define and instrument each event explicitly – more setup time, but cleaner data from day one.
PostHog, Amplitude, and Heap support autocapture. Mixpanel added web autocapture recently.
You probably don't need to switch – you need to add.
GA4 is fine for marketing attribution and traffic analysis. Product analytics covers everything after signup: funnel drop-off, retention cohorts, feature adoption, behavioral segmentation. Most teams keep a web analytics tool for marketing and add a product analytics tool for in-product behavior.
Read our GA4 comparison for a deeper breakdown.
Product analytics = user-level event streams for real-time product decisions. BI = aggregated reporting for finance and ops.
Post-PMF startups export product events to a data warehouse (Snowflake, BigQuery) for unified reporting that combines product behavior with revenue data. Product analytics feeds the warehouse; BI tools visualize the combined data.
Yes, and many teams do.
The risk is data fragmentation: if your funnel data is in one tool and your retention data is in another, you lose the ability to connect them.
Tools like PostHog that bundle analytics, replay, and experiments in one data model avoid this problem. If you do use multiple tools, you can route data through a single source (like Segment or a warehouse) to keep things consistent.
A cohort is a group of users who share a characteristic – usually signup date.
Cohort analysis compares how different groups behave over time: did users who signed up in January retain better than those who signed up in March? This tells you whether your product is actually getting better, not just growing.
It's an important analysis for understanding product-market fit.
Most tools offer EU hosting, data residency options, and consent management.
PostHog offers both US and EU cloud hosting; Amplitude has EU data residency on enterprise plans; Mixpanel provides EU data residency and supports data deletion requests. If GDPR compliance is critical, check whether the tool processes data in the EU, supports consent-based tracking, and offers data deletion APIs.
Read our guide on the best GDPR compliant analytics tools for more details.
此内容由惯性聚合(RSS阅读器)自动聚合整理,仅供阅读参考。 原文来自 — 版权归原作者所有。