A PostHog recipe for people whose users keep leaving the table.
| Prep time | ~30 minutes setup, ~1 week of data |
| Difficulty | Beginner-friendly |
| Yields | One less broken onboarding flow |
| Best for | Product engineers, technical founders, growth teams |
| Outcome | Better onboarding conversion boosts all downstream metrics from activation to retention to revenue. |
Seeing your onboarding stats drop or stall can be discouraging, but here's the good news: it doesn't mean your product sucks (phew!)
Onboarding drop-offs are usually an indication of friction, not rejection. Users don't rage-quit because they hate your product, they quit because something didn't make sense, didn't work, or asked for too much too soon.
It's like attempting a beef wellington, realizing you're in over your head somewhere around the "wrap the beef in mushroom duxelles" step, and bailing to order pizza instead. Ask me how I know.
Even better news: onboarding friction is measurable, debuggable, and fixable.
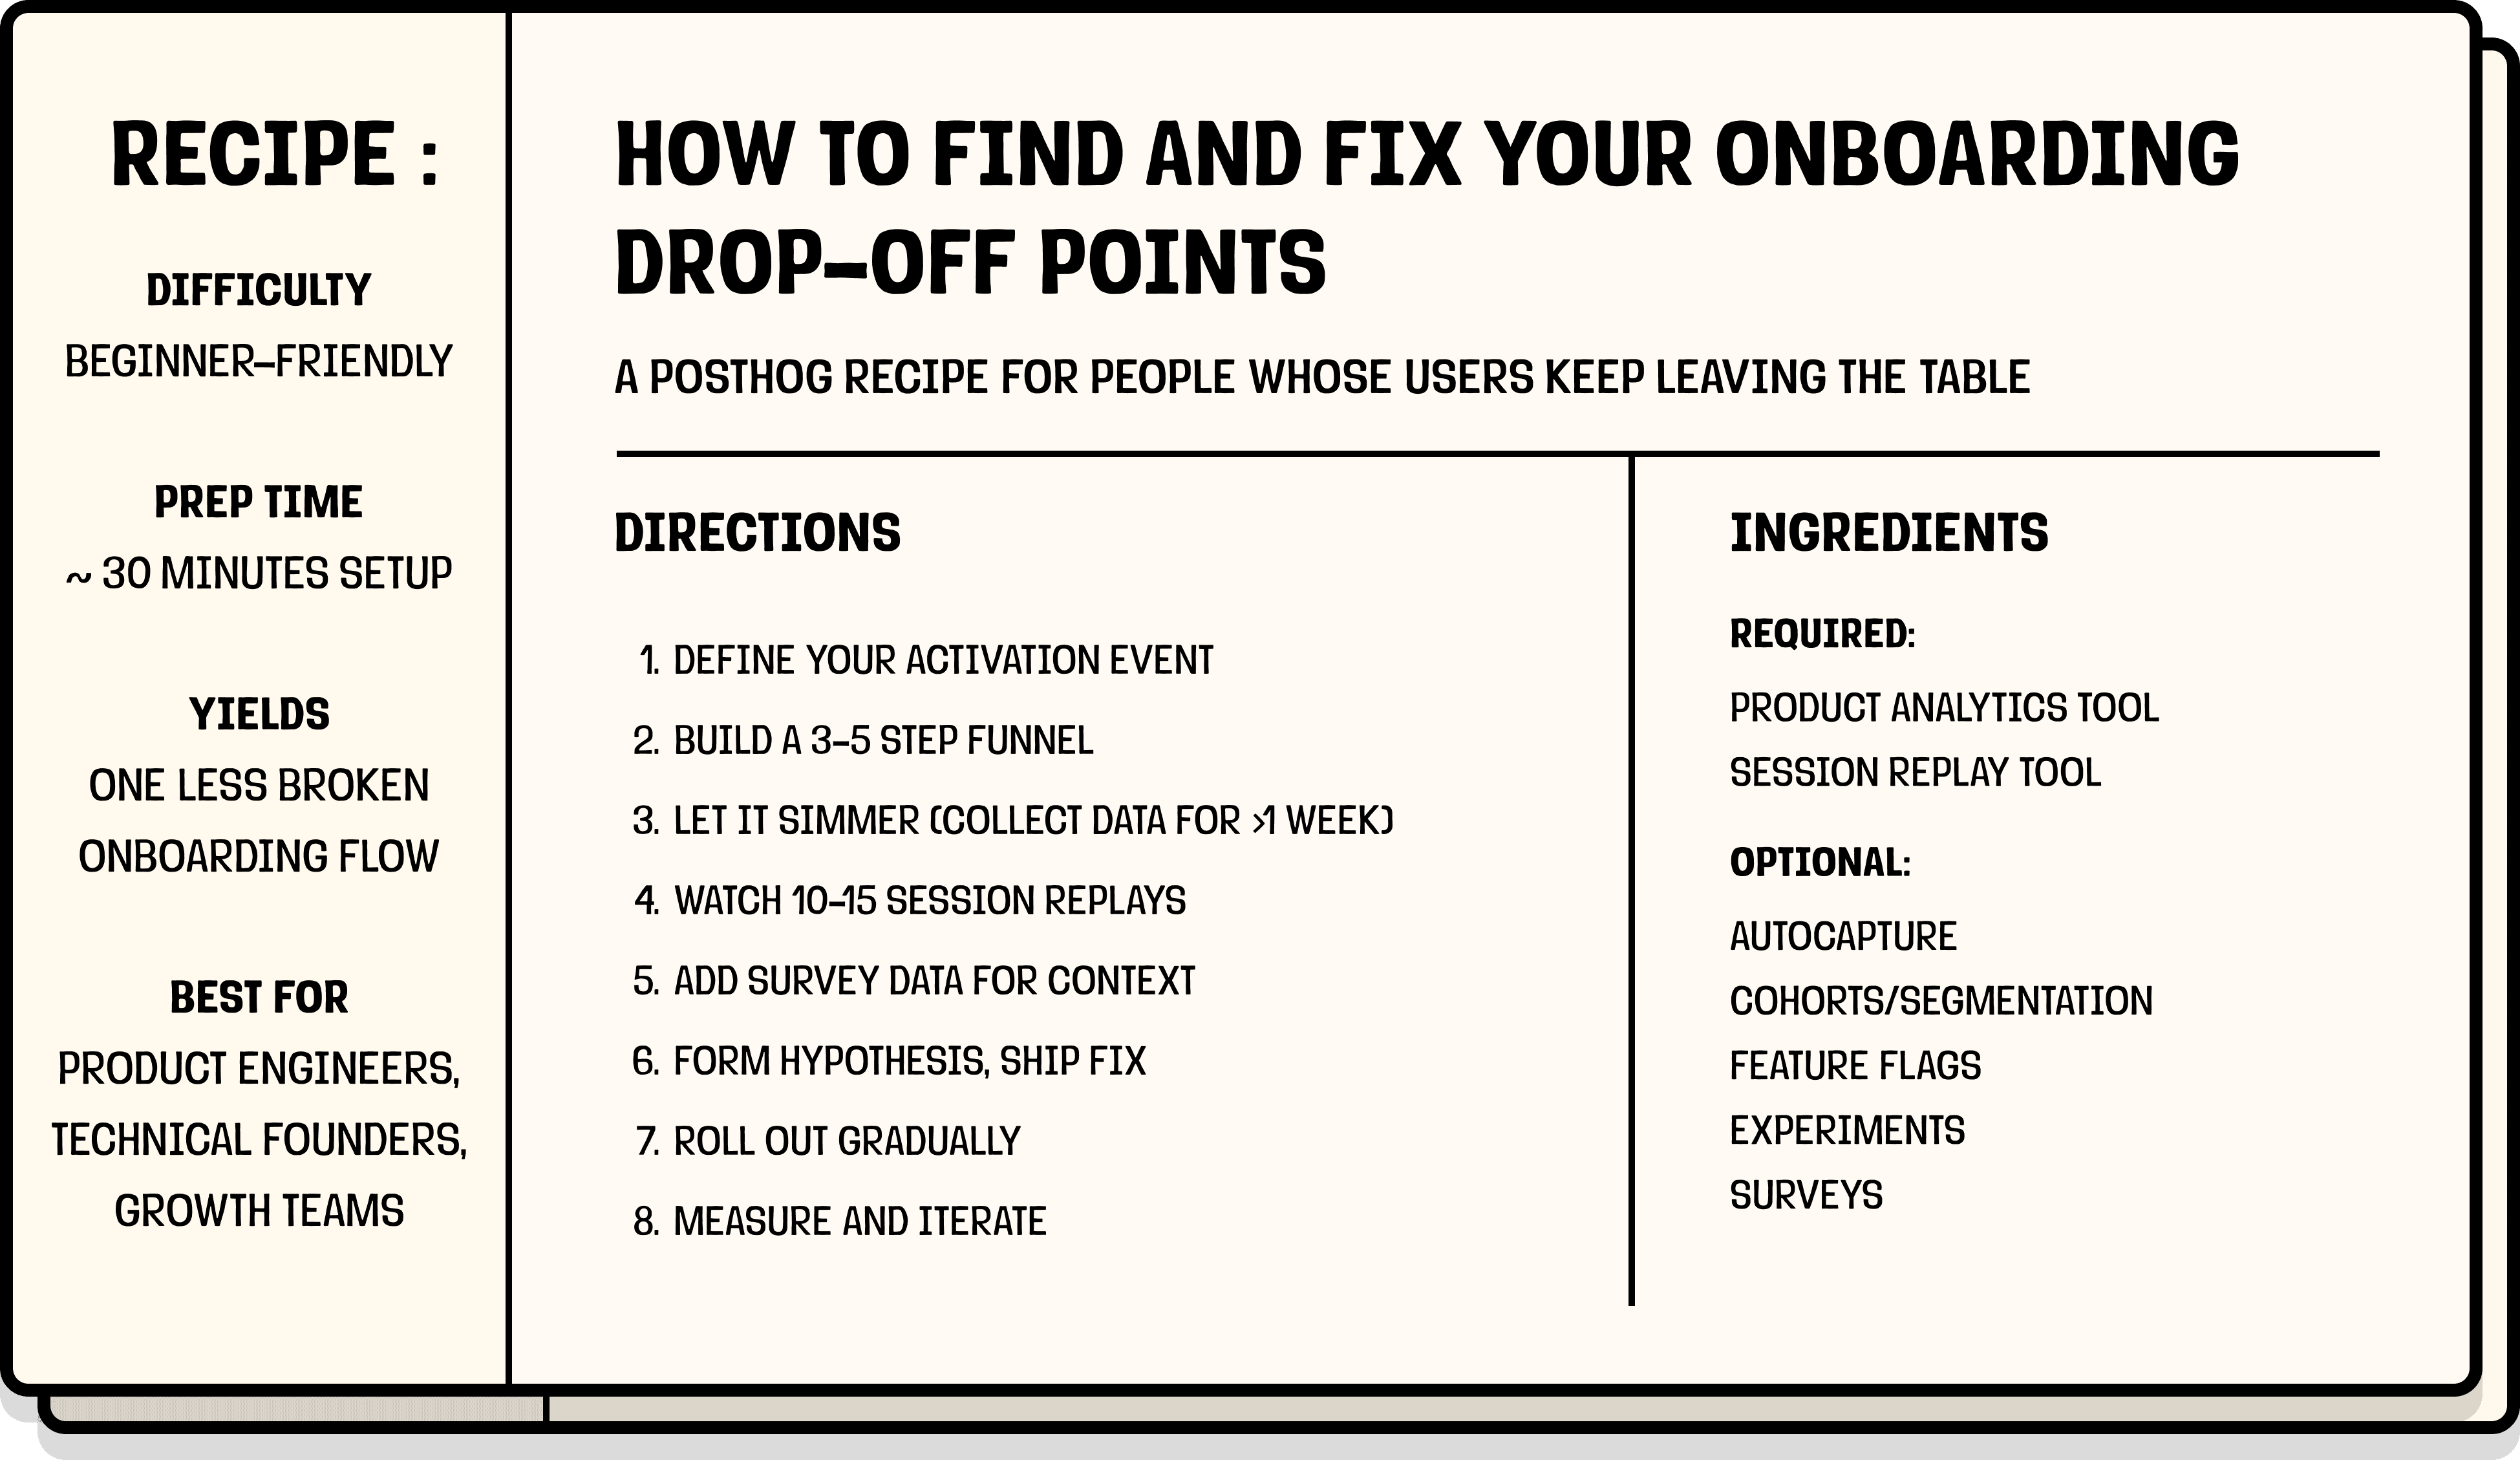
You don't need a massive stack for this recipe.
Required:
Optional, but recommended:
Autocapture (for skipping manual event setup)
Surveys (for getting direct feedback from users)
No session replay tool? You can interview users directly instead, but you'll be relying on their memory of what happened rather than what actually happened. It works, it's just slower and less reliable. Here's our guide to running effective user interviews if you go this route.
No surveys? It's okay, replays will get you 80% of the way there; the other 20% is context you'll have to infer.
No feature flags? You can ship straight to production. We won't judge. (...we will judge a little.) If something breaks, you'll just have to roll back manually. Here's why we think feature flags are worth it.
No cohorts or segmentation? You can still run this recipe, you'll just be looking at all users as one group. If your drop-off is consistent across everyone, that's fine. If it's not, you'll have a harder time figuring out who's actually struggling.
You'll also need:
If you haven't set it up yet, start here. Make sure you're capturing the key events in your onboarding flow (signups, form completions, button clicks, etc.). If you have autocapture enabled, you're probably already covered.
We highly recommend calling posthog.identify() when users sign up or log in; you'll be able to track them across sessions and devices, which makes your funnel data much more reliable.
Cook with PostHog – it's free!
Before you can fix your onboarding, you need to define what a successful onboarding flow actually means. This is your activation event, the foundation of your activation metrics and the thing you'll measure everything against.
Ask yourself: What's the moment when a user has gotten enough value that they're likely to stick around? What you're looking for is a value-producing action.
Some examples:
Not sure what yours is? Try looking at your retention data – what do retained users do that churned users don't? That should give you a starting point.
Here's how we figured out our activation metric at PostHog (spoiler: it took a few iterations).
Pick one. Be opinionated. You can always adjust later.
You're ready for the next step when....
You can complete the sentence: "A user has successfully onboarded when they ____."
Now you're ready to cook.
In your analytics tool, create a funnel with the steps a user must complete to reach your activation event.
A simple example:
$pageview on /signup/success (or a custom signed_up event)profile_completedfirst_project_createdteammate_invited (the last step is your activation event)A few tips:
If using PostHog:
Head to Product Analytics → New insight → Funnel. If you have autocapture enabled, many of these events may already be tracked for you; check your activity to see what's coming in.
You're ready for the next step when....
Your funnel is prepped, ending with your activation event, saved, and ready to collect data.
Save your funnel and let data collect for at least a week. You need enough users going through the flow to see meaningful patterns; looking too early is how you end up "fixing" problems that don't exist.
As a rough guideline:
While you wait, you can:
You're ready for the next step when...
Your data has had time to marinate – at least a few hundred users through the funnel with clear conversion rates at each step. Undercooked data leads to undercooked fixes.
Now that your funnel is showing you where users are falling off, look for:
If everyone drops off at the same step, it's probably a UX problem. Something about that step is broken or confusing for all users.
If only some users drop off, it's a context problem. Something about who they are or how they got there is causing friction.
If it's a context problem, try segmenting your funnel to find a clearer diagnosis:
If using PostHog:
Click on the drop-off number in your funnel to see the actual users who didn't make it. Use breakdowns to slice your funnel by user properties, device, or any event property. If you have many steps or breakdown values, you can also sort for poor performers in terms of number of conversions, conversion percentage, and even time in the Detailed results section.
You're ready for the next step when...
You're able to say: "Users drop off most at [this step]" and "It affects [these users] more than others." If you can't say both, don't move on yet.
You know where users drop off, now you need to find out why.
Watch 10–15 recordings. You're looking for patterns:
If recordings are looking wildly different from one user to the next, go back to Step 4 and segment further; you're probably mixing multiple problems together.
If using PostHog:
Fastest way: Click directly on the drop-off in your funnel – PostHog will pull up recordings for those users automatically. (This is one of the nice things about having replay and analytics in one tool!)
Manual way: In Session Replay, click Show filters → Filter for events or actions → select the last event users completed before dropping off. See our session replay filtering guide for more.
If you saved a cohort in Step 4, you can filter replays by that cohort directly.
You're ready for the next step when...
You're able to say "Users drop off here because [this thing] keeps happening."
This step isn't required, but it can be the difference between a good fix and the right fix.
Trigger this when users are about to abandon your onboarding flow:
You likely won't get a ton of responses, but the ones you do get can be really useful signals.
Survey users who did complete onboarding to understand what almost stopped them:
Trigger this right after your activation event fires; they'll remember while it's fresh.
If using PostHog:
Go to Surveys → New survey.
You can set display conditions based on URL, user properties, or events. For the completion survey, trigger it when your activation event fires.
You're ready for the next step when...
You've seasoned your data with user feedback that confirms, refines, or challenges what you saw in replays.
By now you should have:
Mix these into a hypothesis: "[These] Users are dropping off at [step] because [reason]."
Some common fixes:
You're ready for the next step when...
You've got one fix in the oven, designed to address your hypothesis.
Whatever the change, don't dump it straight into production, roll it out gradually if you can using feature flags.
Feature flags let you:
Want statistical proof it worked? Run an A/B experiment. This is optional, not every fix needs one. But it's worth it when:
While step isn't mandatory, it helps avoid "we think this worked" decisions.
If using PostHog:
Use feature flags to roll out your fix to a percentage of users first.
To run an experiment, go to Experiments → New experiment. Use your feature flag as the basis – PostHog will split users into control and test groups and track your funnel as the goal metric.
You're ready for the next step when...
Your fix is out of the kitchen, live (ideally behind a feature flag) and collecting data.
After your fix has been live for a bit:
Things to check:
If using PostHog:
Set your funnel's Graph type to Historical trends to see conversion over time.
If you used a feature flag or experiment, check the results in Experiments to see the impact with statistical significance. For another perspective on your funnel, you can also break it by whether that feature flag was enabled for that user.
You can see a lift in activation rates after deploying your fix.
If it didn't work as expected, that's okay. Go back to Step 4 with a new hypothesis. Onboarding optimization is iterative, you're rarely done after one fix.
Most teams piece this workflow together across 3–4 different tools: analytics in one place, replays in another, surveys or feature flags somewhere else. It works, but it's slow and you lose context switching between tabs.
With PostHog, everything's connected in one place:
Get started free with 1M events, 5K recordings, and 1M feature flag requests free every month!
Want to just try it already?
(Sorry for the shameless CTA.)
Product activation is the moment a user experiences enough value to stick around. It's the bridge between signing up and becoming an engaged user, and it's one of the most important metrics for product-led growth.
The key product activation metrics to keep an eye out for are activation rate (% of signups who activate), time to activate (how long it takes), and onboarding completion rate (% who finish your onboarding flow). Track all three to get the full picture.
Onboarding is the flow — the steps you guide users through. Activation is the outcome — the moment they get value. Good onboarding leads to activation, but they're not the same thing.
Onboarding drop-off is when users start your onboarding flow but leave before completing it. They signed up and showed intent, but never reached the point where they experienced real value from your product (your activation event).
Onboarding drop-off is not the same as churn – these users never really started using your product in the first place.
Onboarding drop-off happens before users get value. They never activate.
Churn happens after activation. Users got value, used the product for some time, and then stopped.
Drop-off is usually caused by UX friction or broken flows. Churn is more often driven by value, habit, pricing, or competition.
The most common causes are:
There's no universal benchmark.
For self-serve SaaS, 20–40% onboarding completion is common. Higher-touch products with sales involvement often see higher rates.
More important than benchmarks is tracking your own completion rate over time and improving it incrementally.
Optimizing the wrong metric.
Teams often track signups, pageviews, or dashboard loads instead of the action that actually predicts retention. If your activation event is wrong, everything downstream will be misleading.
Start by diagnosing the problem.
Identify where users drop off, then look at what actually happens at that step. Fix one thing at a time by simplifying the flow, adding guidance, removing unnecessary fields, fixing bugs, or reordering steps.
Roll out changes gradually so you can measure impact and roll back if needed.
At a minimum, you need:
You can assemble this with separate tools (for example, analytics, replay, feature flags, and experiments), but that usually means more setup, more context switching, and slower iteration.
Or you can use a unified platform like PostHog to do all of this in one place.
Yes, but it's harder.
Most teams end up stitching together funnels, replays, surveys, and experiments across multiple tools, which slows analysis and makes it harder to connect cause and effect.
A unified stack makes it much easier to move from “where users drop off” to “why” to “did this fix work?”
...hungry for more?
Subscribe to our newsletter
Read by 100,000+ founders and builders
We'll share your email with Substack
Share your before-and-after funnel below.
⭐⭐⭐⭐⭐ "Finally fixed our onboarding. Down to only 3 existential crises per quarter." – Actual user, probably
此内容由惯性聚合(RSS阅读器)自动聚合整理,仅供阅读参考。 原文来自 — 版权归原作者所有。