惯性聚合 高效追踪和阅读你感兴趣的博客、新闻、科技资讯
阅读原文 在惯性聚合中打开

推荐订阅源

C
Check Point Blog
GbyAI
GbyAI
奇客Solidot–传递最新科技情报
奇客Solidot–传递最新科技情报
U
Unit 42
美团技术团队
NISL@THU
NISL@THU
C
Cisco Blogs
SecWiki News
SecWiki News
N
Netflix TechBlog - Medium
Forbes - Security
Forbes - Security
Cloudbric
Cloudbric
雷峰网
雷峰网
T
Tailwind CSS Blog
博客园 - 司徒正美
The Register - Security
L
LangChain Blog
S
Security Affairs
Hacker News - Newest:
Hacker News - Newest: "LLM"
B
Blog
OSCHINA 社区最新新闻
OSCHINA 社区最新新闻
T
Threat Research - Cisco Blogs
I
InfoQ
S
Schneier on Security
L
Lohrmann on Cybersecurity
量子位
cs.CL updates on arXiv.org
Martin Fowler
Martin Fowler
Schneier on Security
F
Fortinet All Blogs
TaoSecurity Blog
TaoSecurity Blog
K
Kaspersky official blog
Google DeepMind News
Cisco Talos Blog
Cisco Talos Blog
PCI Perspectives
PCI Perspectives
Attack and Defense Labs
WordPress大学
WordPress大学
Microsoft Azure Blog
H
Help Net Security
Project Zero
Project Zero
The GitHub Blog
The GitHub Blog
D
Docker
N
News | PayPal Newsroom
K
KPMG report finds enterprise disconnect between AI and its ROI | CIO
H
Hacker News: Front Page
云风的 BLOG
云风的 BLOG
Microsoft Security Blog
freeCodeCamp Programming Tutorials: Python, JavaScript, Git & More
博客园 - 聂微东
Webroot Blog
Webroot Blog
MongoDB | Blog
MongoDB | Blog

Comments for Steve Bennett blogs

Comment on 10 things I hate about Git by Paul Comment on 10 things I hate about Git by CDSRV TechSupport Comment on 10 things I hate about Git by genius Comment on 10 things I hate about Git by Andrew Finnell Comment on 10 things I hate about Git by Usuck Reallybad Comment on 10 things I hate about Git by TLL You might not need PostGIS: streamlined vector tile processing for big map visualisations Terrain in TileMill: a walkthrough for non-GIS types Terrain in TileMill: a walkthrough for non-GIS types 10 things I hate about Git 10 things I hate about Git 10 things I hate about Git 10 things I hate about Git 10 things I hate about Git 10 things I hate about Git 10 things I hate about Git 10 things I hate about Git 10 things I hate about Git 10 things I hate about Git 10 things I hate about Git 10 things I hate about Git 10 things I hate about Git 10 things I hate about Git 10 things I hate about Git 10 things I hate about Git 10 things I hate about Git 10 things I hate about Git 10 things I hate about Git 10 things I hate about Git 10 things I hate about Git
You might not need PostGIS: streamlined vector tile processing for big map visualisations
steveko · 2018-05-15 · via Comments for Steve Bennett blogs

Posted by on May 15, 2018

I recently re-engineered the data processing behind OpenTrees.org. It’s a website that lets you explore the combined open tree databases of 21 local councils around Australia (over 800,000!), with some pretty data visualisations. Working on this site has taught me a lot about processing data into vector tiles. Today’s lesson: “You might not need PostGIS”.

Screenshot 2018-05-15 11.19.19.png

Trees from Melbourne, Hobson’s Bay and Brimbank.

First version: Tilemill, PostGIS, PGRestAPI

The architecture of v1 looked like this: (See “OpenTrees.org: how to aggregate 373,000 trees from 9 open data sources“).

  • Configuration file in JSON stores the location of each source file.
  • Bash scripts using JQ (yes, really) to run wget, ogr2ogr and psql to fetch, convert and load each datafile into PostGIS.
  • SQL scripts to merge and clean the datasets together into a single schema.
  • Tilemill to generate raster tiles from the data.
  • PGRestAPI to provide a queryable interface to the data (particularly to allow the map to zoom to a particular tree by ID).
  • Nginx serving the front end, built with Mapbox.js (a wrapper around Leaflet).
  • The magic of UTFGrid allows interrogating individual tree points. (I still love this technology.)

It worked fairly well, but with the huge disadvantage of having to host a web-accessible server, complete with database.

Second version: Mapbox-GL-JS, vector tiles, static hosting

When I lost access to my free hosting, I re-architected it using Mapbox-GL-JS: v2.

  • Same scripts to fetch and process data into PostGIS.
  • More scripts which export data out of PostGIS and call Tippecanoe to generate vector tiles, which I then upload to Mapbox.com.
  • No Tilemill
  • Brand new front-end built using Mapbox-GL-JS, with some clever new data visualisation, such as visualising by “rarity”.
  • No PGRestAPI. Clicking on a tree updates the URL to include its lat/long, so you have a shareable link that will go to that tree.
  • Front end hosted on Github Pages.

Now we don’t need a server (Github Pages and Mapbox are serving everything we need, and are free). But we still have the heavy dependency of PostGIS.

Do we really need PostGIS?

What is PostGIS actually doing in this scenario? Mostly it’s doing very simple row-oriented, non-relational operations like:

Screenshot 2018-05-15 10.35.52.png

or:

Screenshot 2018-05-15 10.36.24.png

(Yes, I should have used SPLIT_PART())

And then finally we just dump the whole table out to disk.

I began trying to replace it with Spatialite, but that didn’t seem to play very nicely with NodeJS for me. As soon as it got fiddly, the benefits of using it over Postgres began to disappear.

And why did I even need it? Mostly because I already had scripts in SQL and just didn’t want to rewrite them.

So, the disadvantages of PostGIS here:

  • It’s a big, heavy dependency which discourages any other contributors.
  • The data processing scripts have to be in SQL, which introduces a second language (alongside Javascript).
  • No easy way to generate newline-delimited GeoJSON (which would make generating vector tiles a bit faster.)

Third version: NodeJS, Mapbox

So, I rewrote it as v3:

  • Replaced the Bash scripts with NodeJS. Which means, instead of the nonsense of JQ, we have sensible looking Javascript for which the JSON config files work well.
  • Instead of loading Shapefiles into PostGIS, I convert everything into GeoJSON.
  • Instead of SQL “merge” scripts, a NodeJS script processes each tree then writes them all out as a single, line-delimited GeoJSON file.
  • Tippecanoe then operates on that file to generate vector tiles, which I upload to Mapbox.
  • Split the repository in two: one for the data processing (“opentrees-data“), and a separate one for the front end (“opentrees“). This seems to be a good pattern.

The workflow now looks like:

  1. 1-gettrees.js uses a configuration file to fetch datasets from predefined locations and save them, in whatever formats, in a standard place.
  2. 2-loadtrees.js converts each of these files into a geojson file using OGR2OGR.
  3. 3-processFiles.js loads each of these, processing all the individual trees into a standard schema, then writes out a single combined line-delimited GeoJSON.
  4. 4-vectorTiles.sh uses Tippecanoe to generate an mbtiles from the GeoJSON.

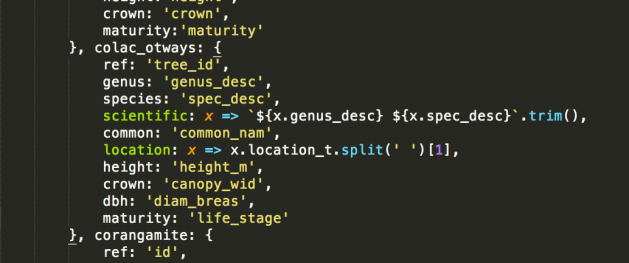
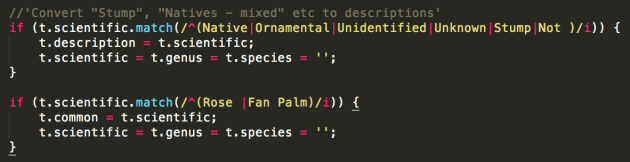
The processing scripts now look like:
Screenshot 2018-05-15 10.06.04.png

Screenshot 2018-05-15 10.07.11

For now, each GeoJSON file is loaded entirely in one synchronous load operation.

Screenshot 2018-05-15 10.41.32

(Processing all the GeoJSONs this way takes about 55 seconds on my machine. Loading them asynchronously reduces that to about 45. Most of the time is probably in the regular expressions.)

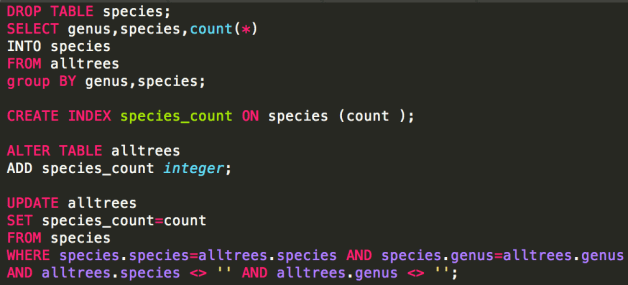
The only slight hurdle is generating the species count table. With PostGIS, this is just one more query run after all the others:
Screenshot 2018-05-15 10.23.15.png

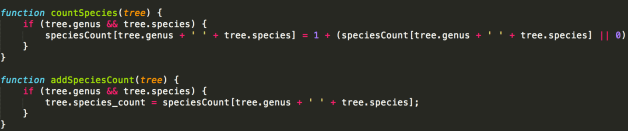
In NodeJS, our “process each tree once” workflow can’t support this. After processing them once (counting species as we go), we process them all again to attach the species count attribute.
Screenshot 2018-05-15 10.19.27

If we were doing a lot of statistics, possibly PostGIS would start to look attractive again.

Do we really need OGR2OGR?

The next dependency I would like to remove is OGR2OGR. It is there because datasets arrive in formats I can’t control (primarily CSV, Shapefile, GeoJSON). I love using Mike Bostock’s shapefile library, but it doesn’t currently support projections other than EPSG:4326. That’s not a showstopper, just more work.

It would also be great not to have to maintain VRT files (in XML!) to describe the CSV formats in which data arrives.