


I created a basemap for http://cycletour.org with TileMill and OpenStreetMap. It looked…ok.
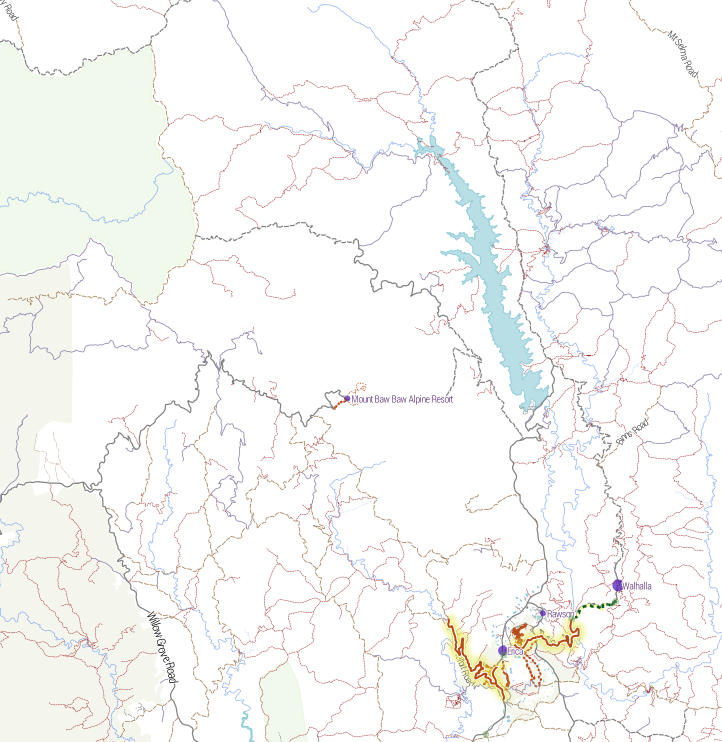
But it felt like there was something missing. Terrain. Elevation. Hills. Mountains. I’d put all that in the too hard basket, until a quick google turned up two blog posts from MapBox, the wonderful people who make TileMill. “Working with terrain data” and “Using TileMill’s raster-colorizer“. Putting these two together, plus a little OCD, led me to this:
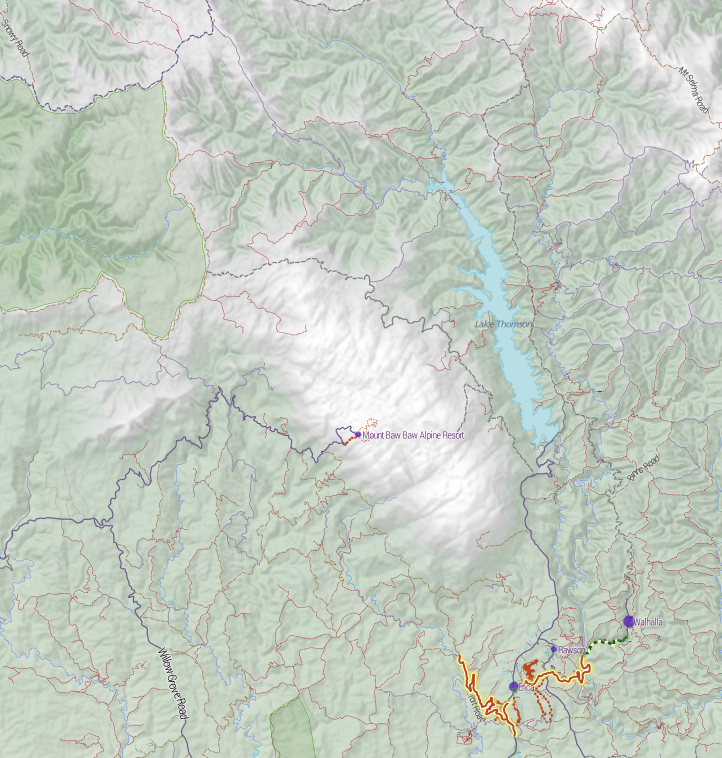
Slight improvement! Now, I felt that the two blog posts skipped a couple of little steps, and were slightly confusing on the difference between the two approaches, so here’s my step by step. (MapBox, please feel free to reuse any of this content.)
My setup is an 8 core Ubuntu VM with 32GB RAM and lots of disk space. I have OpenStreetMap loaded into PostGIS.
You need to do this if you want to use the raster-colorizer. You want this while developing your terrain style, if you want the “snow up high, green valleys below” look. Without it, you have to pre-render the elevation color effect, which is time consuming. If you want to tweak anything (say, to move the snow line slightly), you need to re-render all the tiles.
Fortunately, it’s pretty easy.
The easiest place is the ubiquitous NASA SRTM DEM (digital elevation model) data. You get it from CGIAR. The user interface is awful. You can only download pieces that are 5 degrees by 5 degrees, so Victoria is 4 pieces.
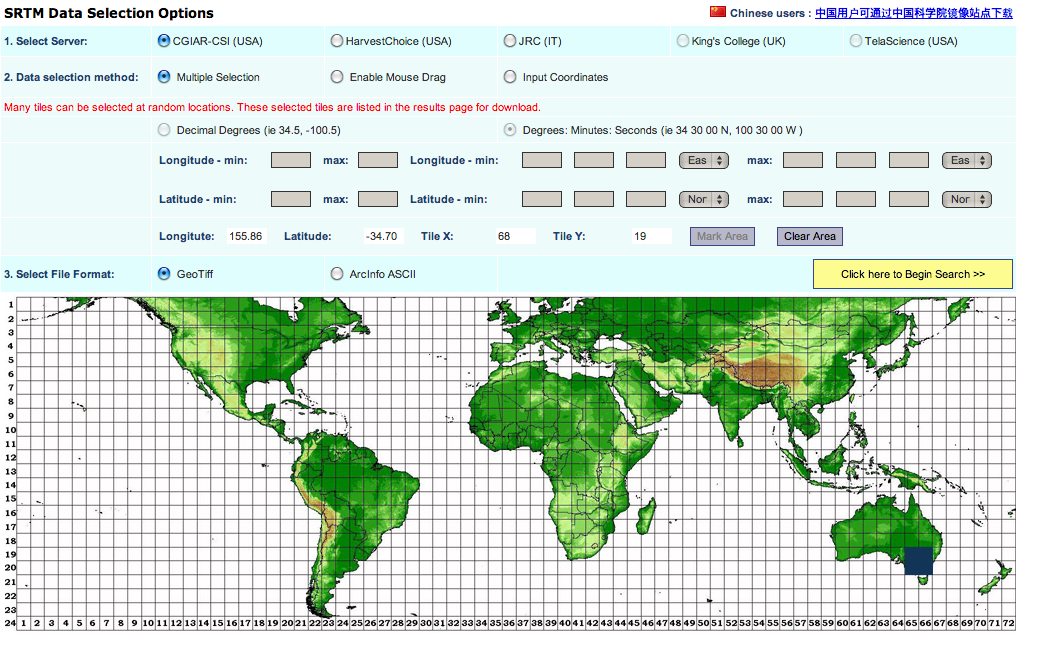
If you’re downloading more than about that many, you’ll probably want to automate the process. I wrote this quick script to get all the bits for Australia:
for x in {59..67}; do

for y in {14..21}; do

echo $x,$y

if [ ! -f srtm_${x}_${y}.zip ]; then

wget http://droppr.org/srtm/v4.1/6_5x5_TIFs/srtm_${x}_${y}.zip

else

echo "Already got it."

fi

done

done

unzip '*.zip'
To have any fun with terrain mapping in TileMill, you need to produce separate layers from the terrain data:
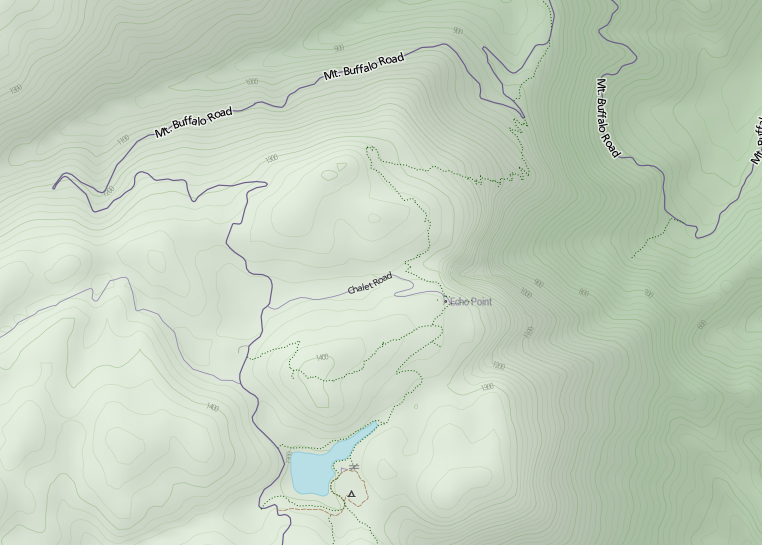
Contours – they’re the best.
In addition, you’ll need some extra processing:
Hopefully you already have GDAL installed. It probably came with the development version of TileMill.
Here’s my script for doing all the processing:
#!/bin/bash

echo -n "Merging files: "

gdal_merge.py srtm_*.tif -o srtm.tif

f=srtm

echo -n "Re-projecting: "

gdalwarp -s_srs EPSG:4326 -t_srs EPSG:3785 -r bilinear $f.tif $f-3785.tif
echo -n "Generating hill shading: "
gdaldem hillshade -z 5 $f-3785.tif $f-3785-hs.tif
echo and overviews:
 gdaladdo -r average $f-3785-hs.tif 2 4 8 16 32

echo -n "Generating slope files: "

gdaldem slope $f-3785.tif $f-3785-slope.tif

echo -n "Translating to 0-90..."

gdal_translate -ot Byte -scale 0 90 $f-3785-slope.tif $f-3785-slope-scale.tif

echo "and overviews."

gdaladdo -r average $f-3785-slope-scale.tif 2 4 8 16 32

echo -n Translating DEM...

gdal_translate -ot Byte -scale -10 2000 $f-3785.tif $f-3785-scale.tif

echo and overviews.

gdaladdo -r average $f-3785-scale.tif 2 4 8 16 32

#echo Creating contours

gdal_contour -a elev -i 20 $f-3785.tif $f-3785-contour.shp
Take my word for it that the above script does everything I promise. The options I’ve chosen are all pretty standard, except that:
Now you have four useful files, so create layers for them. I’d suggest creating them as layers in this order (as seen in TileMill):
For each of these, you must set the projection to 900913 (that’s how you spell GOOGLE in numbers). For the three ‘tifs’, set band=1 in the “advanced” box. I gather that GeoTiffs can have multiple bands of data, and this is the band where TileMill expects to find numeric data to apply colour to.
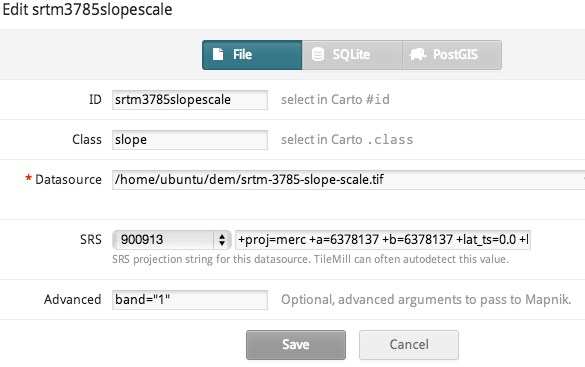
Mapbox’s blog posts go into detail about how to do this, so I’ll just copy/paste my styles. The key lessons here are:
My styles:
.hs[zoom <= 15] {
[zoom>=15] { raster-opacity: 0.1; }
[zoom>=13] { raster-opacity: 0.125; }
[zoom=12] { raster-opacity:0.15;}
[zoom<=11] { raster-opacity: 0.12; }
[zoom<=8] { raster-opacity: 0.3; }
raster-scaling:bilinear;
raster-comp-op:multiply;
}
// not really convinced about the value of slope shading
.slope[zoom <= 14][zoom >= 10] {
raster-opacity:0.1;
[zoom=14] { raster-opacity:0.05; }
[zoom=13] { raster-opacity:0.05; }
raster-scaling:lanczos;
raster-colorizer-default-mode: linear;
raster-colorizer-default-color: transparent;
// this combo is ok
raster-colorizer-stops:
stop(0, white)
stop(5, white)
stop(80, black);
raster-comp-op:color-burn;
}
// colour-graded elevation model
.dem {
[zoom >= 10] { raster-opacity: 0.2; }
[zoom = 9] { raster-opacity: 0.225; }
[zoom = 8] { raster-opacity: 0.25; }
[zoom <= 7] { raster-opacity: 0.3; }
raster-scaling:bilinear;
raster-colorizer-default-mode: linear;
raster-colorizer-default-color: hsl(60,50%,80%);
// hay, forest, rocks, snow
// if using the srtm-3785-scale.tif file, these stops should be in the range 0-255.
raster-colorizer-stops:
stop(0,hsl(60,50%,80%))
stop(392,hsl(110,80%,20%))
stop(785,hsl(120,70%,20%))
stop(1100,hsl(100,0%,50%))
stop(1370,white);
}
.contour[zoom >=13] {
line-smooth:1.0;
line-width:0.75;
line-color:hsla(100,30%,50%,20%);
[zoom = 13] {
line-width:0.5;
line-color:hsla(100,30%,50%,15%);
}
[zoom >= 16],
[elev =~ “.*00”] {
l/text-face-name:’Roboto Condensed Light’;
l/text-size:8;
l/text-name:'[elev]’;
[elev =~ “.*00”] { line-color:hsla(100,30%,50%,40%); }
[zoom >= 16] { l/text-size: 10; }
l/text-fill:gray;
l/text-placement:line;
}
}
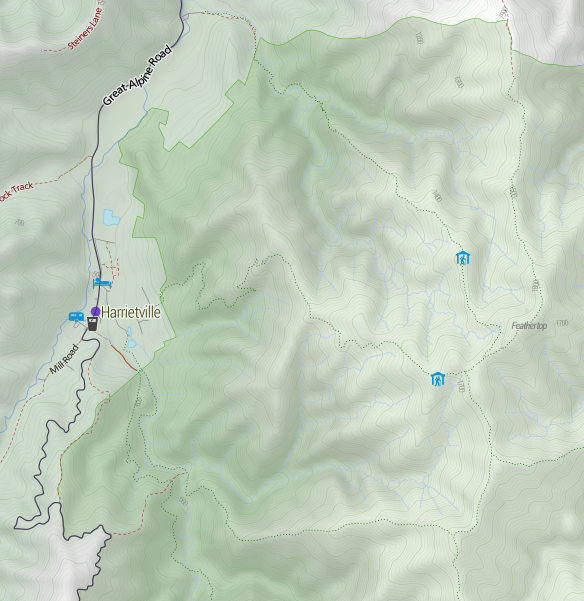
And finally a gratuitous shot of Mt Feathertop, showing the major approaches and the two huts: MUMC Hut to the north and Federation Hut further south. Terrain is awesome!
此内容由惯性聚合(RSS阅读器)自动聚合整理,仅供阅读参考。 原文来自 — 版权归原作者所有。