惯性聚合 高效追踪和阅读你感兴趣的博客、新闻、科技资讯
阅读原文 在惯性聚合中打开

推荐订阅源

量子位
cs.AI updates on arXiv.org
F
Fortinet All Blogs
博客园 - 聂微东
奇客Solidot–传递最新科技情报
奇客Solidot–传递最新科技情报
Hugging Face - Blog
Hugging Face - Blog
V
Visual Studio Blog
小众软件
小众软件
有赞技术团队
有赞技术团队
雷峰网
雷峰网
钛媒体:引领未来商业与生活新知
钛媒体:引领未来商业与生活新知
AWS News Blog
AWS News Blog
C
Cisco Blogs
美团技术团队
T
Threat Research - Cisco Blogs
C
CERT Recently Published Vulnerability Notes
人人都是产品经理
人人都是产品经理
宝玉的分享
宝玉的分享
Threat Intelligence Blog | Flashpoint
酷 壳 – CoolShell
酷 壳 – CoolShell
Stack Overflow Blog
Stack Overflow Blog
W
WeLiveSecurity
D
DataBreaches.Net
博客园 - 司徒正美
Blog — PlanetScale
Blog — PlanetScale
IT之家
IT之家
云风的 BLOG
云风的 BLOG
Cyber Security Advisories - MS-ISAC
Simon Willison's Weblog
Google DeepMind News
T
The Blog of Author Tim Ferriss
Know Your Adversary
Know Your Adversary
NISL@THU
NISL@THU
OSCHINA 社区最新新闻
OSCHINA 社区最新新闻
The Cloudflare Blog
Vercel News
Vercel News
月光博客
月光博客
T
Tailwind CSS Blog
H
Help Net Security
aimingoo的专栏
aimingoo的专栏
P
Proofpoint News Feed
Application and Cybersecurity Blog
Spread Privacy
Spread Privacy
cs.CL updates on arXiv.org
Cisco Talos Blog
Cisco Talos Blog
Microsoft Security Blog
V
V2EX
WordPress大学
WordPress大学
Cyberwarzone
Cyberwarzone
Recent Announcements

Steve Bennett blogs

Whenever: exploring times and places in film and books Alternative Earth: a procedurally generated map using vector tiles Host your own vector tile server on Glitch Building TinyMap: an itty bitty collaborative mapping tool You might not need PostGIS: streamlined vector tile processing for big map visualisations OpenStreetMap vector tiles: mixing and matching engines, schemas and styles 2015’s proudest moments After the hackathon: 4 classic recipes OpenTrees.org: how to aggregate 373,000 trees from 9 open data sources Cycletour.org: a better map for Australian cycle tours Normalize cross-tabs for Tableau: a free Google Sheets tool 7 reasons to release that government dataset The Data Guru in Residence Chromecast in the real world: six casting workflows Web map projections: the bare minimum you need to know Multivariate binary symbol maps with TileMill. The Australian’s menacing editorial Cycletouring and OpenStreetMapping: a beautiful symbiosis Git: what they didn’t tell you One week of Salt: frustrations and reflections. Super lightweight map websites with Github Digital humanities for beginners: get started with the Trove API Trello Tennis Terrain in TileMill: a walkthrough for non-GIS types A TileMill server with all the trimmings Forget trying to remember your servers’ names! Anonymous longitudinal surveys with LimeSurvey Windows red cross errors scam What I learned at e-Research Australasia 2012 A pattern for multi-instrument data harvesting with MyTardis Getting started with Chef on the NeCTAR Research Cloud How OData will solve data sharing and reuse for e-Research 10 things I hate about Git Semantic Google keywords Improving on the “administration rights required” workflow Why is buying stuff from eBay so complicated? Introducing: Cooking for engineers New Gmail feature: auto mailing list management Penny Auctions – a bit of analysis Hello world!
Your own personal National Map with TerriaJS: no coding and nothing to deploy
steveko · 2015-07-02 · via Steve Bennett blogs

Posted by on July 2, 2015

National Map is a pretty awesome place to find geospatial open data from all levels of Australian government.  (Disclaimer: I work on it at NICTA). But thanks to some not-so-obvious features in TerriaJS, the software that drives it, you can actually create and share your own private version with your own map layers – without programming, and without deploying any code.

What you get:

  • A 3D, rotateable, zoomable globe, thanks the awesome Cesium library. (It seamlessly falls back to Leaflet if 3D isn’t available.)
  • Selectable layers, grouped into an organised hierarchy of your devising
  • Support for a wide range of spatial services: WMS, WFS, ESRI (both catalogs and individual layers for all of these), CKAN, individual files like GeoJSON and KML, and even CSV files representing regions like LGAs, Postcodes, States…
  • Choose your own basemap, initial camera position, styling for some spatial types, etc.

1. Make your own content with online tools

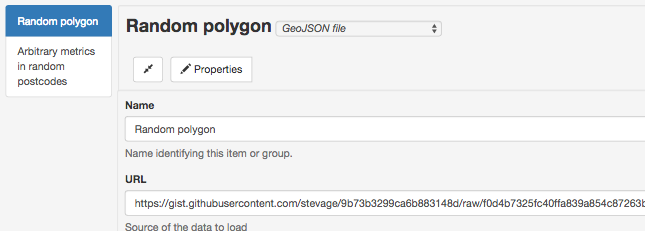
Want to create your own spatial layer – polygons, lines and points? Use geojson.io and choose Save > Gist to save the result to Github Gist. (Gist is just a convenient service that stores text on the web for free).

Screenshot 2015-07-02 07.56.52

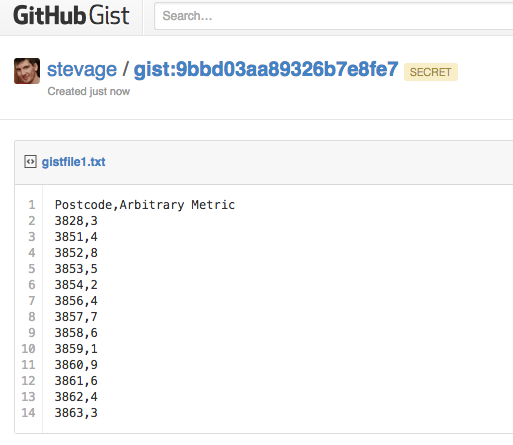
How about a layer of data about suburbs by postcode? Create a Google Sheet that follows the csv-au-geo specification (it’s easy!), download as CSV, paste it into a fresh Gist.
Screenshot 2015-07-02 08.02.28

2. Create a catalog with the Data Source Editor

Using the new TerriaJS Data Source Editor (I made this!), create your new catalog. You’re basically writing a JSON file but using a web form (thanks json-editor!) to do it.

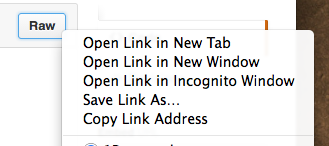
To add one of your datasources on Gist, make sure you link to the Raw view of the page:
Screenshot 2015-07-02 08.07.02

Screenshot 2015-07-02 08.08.16

Don’t forget to select the type for each file: GeoJSON, CSV, etc.

3. Add more data

You might want to bring in some other data sources that you found on National Map. This can be a little tricky – there’s a lot of complexity in accessing data sources that National Map hides for you.

But here’s roughly how to go about it for a WMS (web map service) data source.

In the layer’s info window, grab the WMS URL

Screenshot 2015-07-02 10.53.13

You’ll need to put “http://nationalmap.gov.au/proxy/” in front of a some layers, because their WMS servers don’t support CORS.

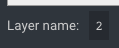
You’ll also need the value of the “Layer name” field. (For Esri layers you need to dig a bit further.)
Screenshot 2015-11-13 11.10.55

(Yes, this layer is called “2”)

Add a WMS layer, and add “Layers Names” as an additional property. So it looks like this:
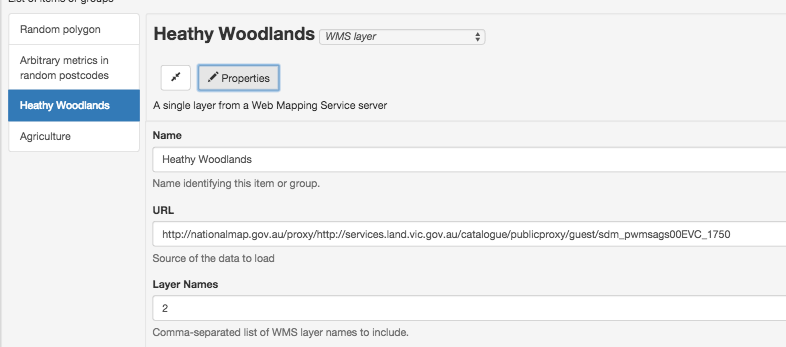
Screenshot 2015-07-02 10.55.54

4. Tweak your presentation

You can add extra properties to layers to fine tune their appearance. For example, for our CSV dataset:
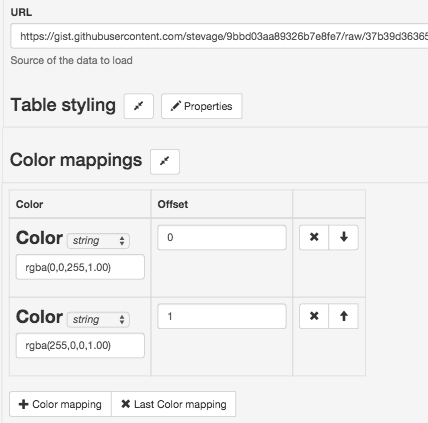
Screenshot 2015-07-02 10.57.49

You might want to set “Is Enabled” and “Is Shown” on every layer so they display automatically.

And finally, you might want to set an initial camera and base map, so the view doesn’t start off the west coast of Africa with a satellite view.
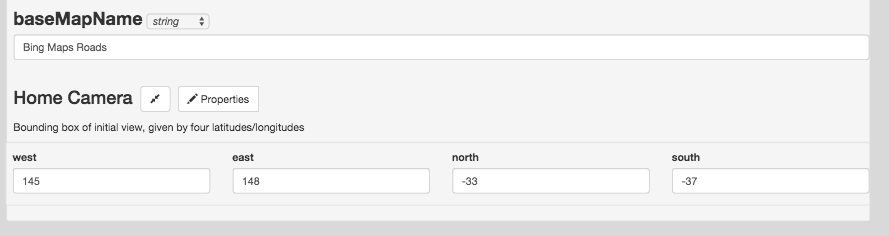
Screenshot 2015-07-02 10.39.55

5. Save and preview

Screenshot 2015-07-02 10.46.41

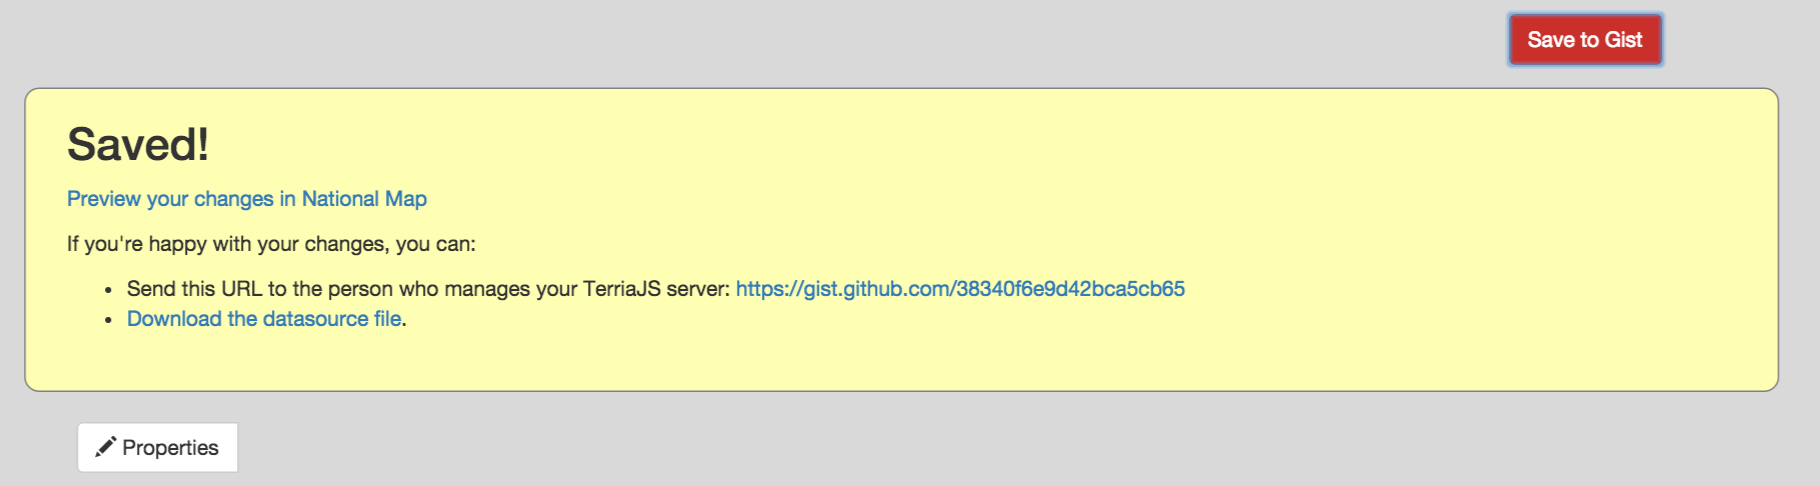
As you make changes, click “Save to Gist” to save your configuration file to a secret location on Gist. You can then click “Preview your changes in National Map”.
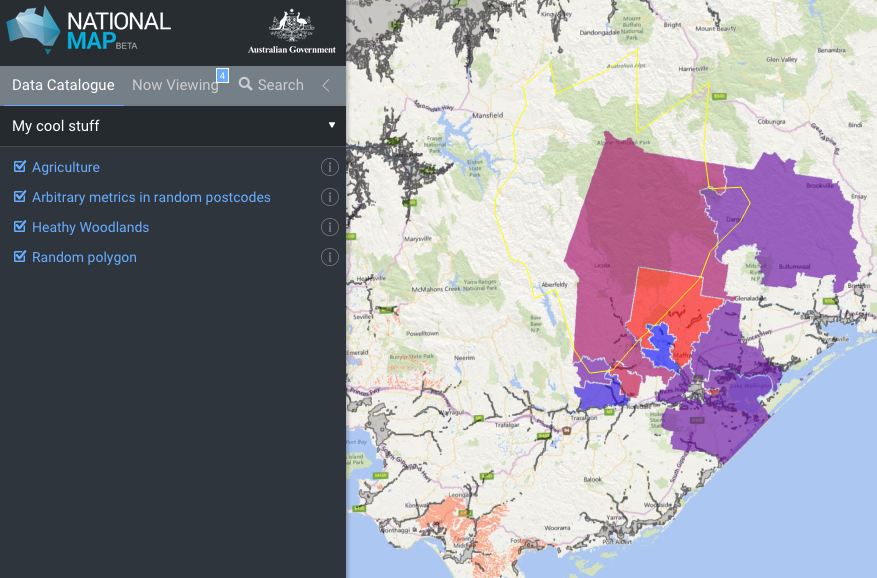
Screenshot 2015-07-02 11.01.19

Make a note of the Gist link so you can keep working on it in the future. You can’t modify an existing configuration, but you can load from there and save a new copy.

6. Share!

Now you have a long URL like this: http://nationalmap.research.nicta.com/#clean&https%3A%2F%2Fgist.githubusercontent.com%2Fanonymous%2Fc3f181ca742b9ed94fe4%2Fraw%2F10853f7d8bb33610e4f2ce26947eaf6882192957%2Fdatasource.json

So, use tinyurl.com or another URL shortening service to get something more useful:

http://tinyurl.com/myawsummap