



惯性聚合 高效追踪和阅读你感兴趣的博客、新闻、科技资讯
阅读原文 在惯性聚合中打开

推荐订阅源

G
Google Developers Blog
Jina AI
Jina AI
大猫的无限游戏
大猫的无限游戏
Martin Fowler
Martin Fowler
博客园 - 司徒正美
云风的 BLOG
云风的 BLOG
C
Cybersecurity and Infrastructure Security Agency CISA
CTFtime.org: upcoming CTF events
S
Securelist
S
Security Affairs
freeCodeCamp Programming Tutorials: Python, JavaScript, Git & More
L
LINUX DO - 热门话题
博客园 - 三生石上(FineUI控件)
T
Threatpost
T
The Blog of Author Tim Ferriss
C
CERT Recently Published Vulnerability Notes
IT之家
IT之家
P
Palo Alto Networks Blog
Microsoft Azure Blog
Spread Privacy
Spread Privacy
Cyberwarzone
Cyberwarzone
腾讯CDC
L
LangChain Blog
Know Your Adversary
Know Your Adversary
C
CXSECURITY Database RSS Feed - CXSecurity.com
GbyAI
GbyAI
Threat Intelligence Blog | Flashpoint
I
Intezer
T
Tor Project blog
AWS News Blog
AWS News Blog
T
Tenable Blog
NISL@THU
NISL@THU
Security Latest
Security Latest
cs.CL updates on arXiv.org
H
Hackread – Cybersecurity News, Data Breaches, AI and More
人人都是产品经理
人人都是产品经理
MongoDB | Blog
MongoDB | Blog
MyScale Blog
MyScale Blog
D
DataBreaches.Net
Microsoft Security Blog
钛媒体:引领未来商业与生活新知
钛媒体:引领未来商业与生活新知
量子位
美团技术团队
The Cloudflare Blog
酷 壳 – CoolShell
酷 壳 – CoolShell
罗磊的独立博客
The GitHub Blog
The GitHub Blog
阮一峰的网络日志
阮一峰的网络日志
OSCHINA 社区最新新闻
OSCHINA 社区最新新闻
Stack Overflow Blog
Stack Overflow Blog

Steve Bennett blogs

Whenever: exploring times and places in film and books Alternative Earth: a procedurally generated map using vector tiles Host your own vector tile server on Glitch Building TinyMap: an itty bitty collaborative mapping tool You might not need PostGIS: streamlined vector tile processing for big map visualisations OpenStreetMap vector tiles: mixing and matching engines, schemas and styles 2015’s proudest moments Your own personal National Map with TerriaJS: no coding and nothing to deploy After the hackathon: 4 classic recipes OpenTrees.org: how to aggregate 373,000 trees from 9 open data sources Cycletour.org: a better map for Australian cycle tours Normalize cross-tabs for Tableau: a free Google Sheets tool 7 reasons to release that government dataset The Data Guru in Residence Chromecast in the real world: six casting workflows Web map projections: the bare minimum you need to know Multivariate binary symbol maps with TileMill. The Australian’s menacing editorial Cycletouring and OpenStreetMapping: a beautiful symbiosis Git: what they didn’t tell you One week of Salt: frustrations and reflections. Digital humanities for beginners: get started with the Trove API Trello Tennis Terrain in TileMill: a walkthrough for non-GIS types A TileMill server with all the trimmings Forget trying to remember your servers’ names! Anonymous longitudinal surveys with LimeSurvey Windows red cross errors scam What I learned at e-Research Australasia 2012 A pattern for multi-instrument data harvesting with MyTardis Getting started with Chef on the NeCTAR Research Cloud How OData will solve data sharing and reuse for e-Research 10 things I hate about Git Semantic Google keywords Improving on the “administration rights required” workflow Why is buying stuff from eBay so complicated? Introducing: Cooking for engineers New Gmail feature: auto mailing list management Penny Auctions – a bit of analysis Hello world!
Super lightweight map websites with Github
steveko · 2014-02-13 · via Steve Bennett blogs

Posted by on February 13, 2014

Github, the online version control repository host for Git, recently added support for GeoJSON files. Sounds boring, right? It actually lets you do something very cool: build your own “dots on a map” website with virtually zero code.
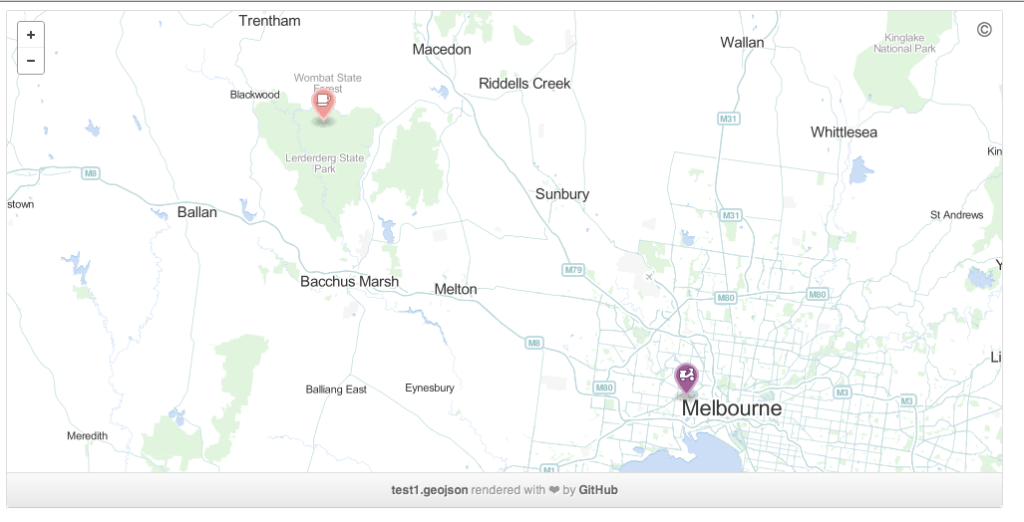
An example of GeoJSON on Github I whipped up.

An example of GeoJSON on Github I whipped up. Click it.

Here’s what you need to do.

  1. Get a Github repository if you don’t have one already. They’re free.
  2. Create a GeoJSON file. You can export to this format from various tools. One easy way to get started would be to upload a CSV file with locations to dotspotting.org then download the GeoJSON from there. Or even easier, use geojson.io to place dots, lines and polygons with a graphical tool. It can save directly to your GitHub.
  3. Here’s what my test file looks like:
    {
     "type": "FeatureCollection",
     "features": [{ "type": "Feature",
     "geometry": {
     "type": "Point",
     "coordinates": [144.9,-37.8]
     },
     "properties": {
     "title": "Scooter",
     "description": "Here's a dot",
     "marker-size": "medium",
     "marker-symbol": "scooter",
     "marker-color": "#a59",
     "stroke": "#555555",
     "stroke-opacity": 1.0,
     "stroke-width": 2,
     "fill": "#555555",
     "fill-opacity": 0.5
     }
     },
     { "type": "Feature",
     "geometry": {
     "type": "Point",
     "coordinates": [144.4,-37.5]
     },
     "properties": {
     "title": "Cafe",
     "description": "Coffee and stuff",
     "marker-size": "medium",
     "marker-symbol": "cafe",
     "marker-color": "#f99",
     "stroke": "#555555",
     "stroke-opacity": 1.0,
     "stroke-width": 2,
     "fill": "#555555",
     "fill-opacity": 0.5
     }
     }]
    }

    It’s worth validating with GeoJSONLint.
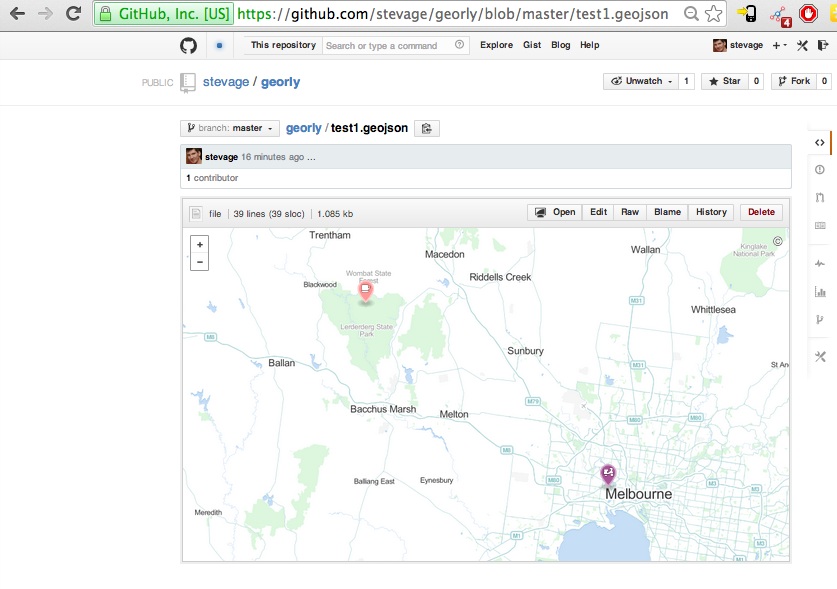
  4. Commit this file, say test.geojson, to your Github repository. You can get a preview of it in Github:

    The test GeoJSON file, as seen on GitHub.

    The test GeoJSON file, as seen on GitHub.

  5. Now the really cool part. Embed the map into your own website. This is stupidly easy:
    <!DOCTYPE html>
    <html>
    <body>
    <script src="https://embed.github.com/view/geojson/stevage/georly/master/test1.geojson?height=500&width=1000"></script>
    </body>
    </html>

    If you don’t have a website, site44 is an extremely easy way to get started. You place HTML files into your DropBox, and they get automagicked onto the web, with a subdomain: something.site44.com.

Now what?

That’s it! What’s especially interesting about the hosting on GitHub is it’s a very easy way to have a lightweight shared geospatial database of points, lines or polygons. Here’s how you could add dots to my map:

  1. Fork my repository
  2. Add a few points, by modifying the GeoJSON file
  3. Commit your changes to your repository.
  4. Send me a pull request
  5. I accept the changes, and voila – now your points are shown with mine.

Using this method, we have a “review before publish” workflow, and a full version history of every change.

Caveats

This is a nifty tool for prototyping social mapping applications, but it obviously won’t cut it for production purposes:

  • No support for different layers: all the dots are always shown
  • No support for different basemaps: always the same OpenStreetMap style
  • No authoring tools: you must use something else to generate the GeoJSON
  • Obligatory “rendered with (heart) by GitHub” footer.

Soon you’ll want to build a proper application, using tools like MapBox, CloudMade, CartoDB, Leaflet etc.