



I try to convince government bodies, especially local councils, to publish more open data. It’s much easier when there is a concrete benefit to point to: if you publish your tree inventory, it could be joined up with all the other councils’ tree inventories, to make some kind of big tree-explorey interface thing.
Introducing: opentrees.org. It’s fun! Click on “interesting trees”, hover over a few, and click on the ones that take your fancy. You can play for ages.
Here’s how I made it.
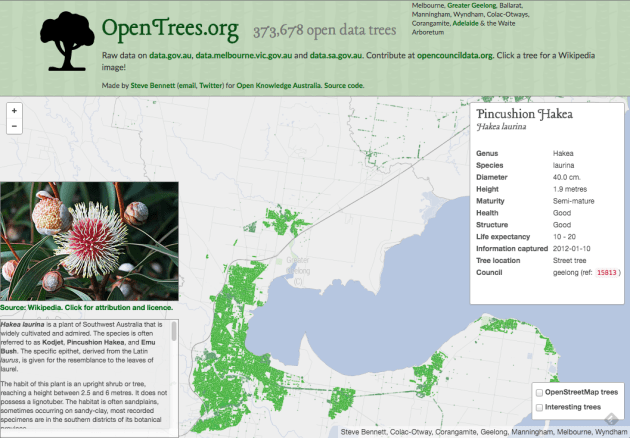
Through a bit of searching on data.gov.au, I found tree inventories (normally called “Geelong street trees” or similar) for: Geelong, Ballarat (both participating in OpenCouncilData), Corangamite (I visited last year), Colac-Otways (friends of Corangamite), Wyndham (a surprise!), Manningham (total surprise). It showed two results from data.sa.gov.au: Adelaide, and the Waite Arboretum (in Adelaide). Plus the City of Melbourne’s (open data pioneers) “Urban Forest” dataset on data.melbourne.vic.gov.au.
Every dataset is different. For instance:
Tip for data providers #1: Choose CSV files for all point data, with columns “lat” and “lon”. (They’re much easier to manipulate than other formats, it’s easy to strip fields you don’t need, and they’re useful for doing non-spatial things with.)
Next we load all the data files, as they are, into separate tables in PostGIS. GDAL is the magic tool here. Its conversion tool, ogr2ogr, has a slightly weird command line but works very well. A few tips:
Tip for data providers #2: Provide all data in unprojected (latitude/longitude) coordinates by preference, or Web Mercator (EPSG:3857).
CSV files unfortunately require creating a companion ‘.vrt’ file for non-trivial cases (eg, weird projections, weird column names). For example:
<OGRVRTDataSource>

<OGRVRTLayer name="melbourne">

<SrcDataSource>melbourne.csv</SrcDataSource>

<GeometryType>wkbPoint</GeometryType>

<LayerSRS>WGS84</LayerSRS>

<GeometryField encoding="PointFromColumns" x="Longitude" y="Latitude"/>

</OGRVRTLayer>

</OGRVRTDataSource>
The command to load a dataset looks like:
ogr2ogr --config PG_USE_COPY YES -overwrite -f "PostgreSQL" PG:"dbname=trees" -t_srs EPSG:3857 melbourne.vrt -nln melbourne -lco GEOMETRY_NAME=the_geom -lco FID=gid -nlt GEOMETRY
Source code for loadtrees-db.sh.
Unfortunately most councils do not yet publish data in the (very easy to follow!) opencouncildata.org standards. So we have to investigate the data and try to match the fields into the scheme. Basically, it’s a bunch of hand-crafted SQL INSERT statements like:
INSERT INTO alltrees (the_geom, ref, genus, species, scientific, common, location, height, crown, dbh, planted, maturity, source)

SELECT the_geom,

tree_id AS ref,

genus_desc AS genus,

spec_desc AS species,

trim(concat(genus_desc, ' ', spec_desc)) AS scientific,

common_nam AS common,

split_part(location_t, ' ', 1) AS location,

height_m AS height,

canopy_wid AS crown,

diam_breas AS dbh,

CASE WHEN length(year_plant::varchar) = 4 THEN to_date(year_plant::varchar, 'YYYY') END AS planted,

life_stage AS maturity,

'colac_otways' AS source

FROM colac_otways;
Notice that we have to convert the year (“year_plant”) into an actual date. I haven’t yet fully handled complicated fields like health, structure, height and dbh, so there’s a mish-mash of non-numeric values, different units (Adelaide records the circumference of trees rather than diameter!)
Tip for data providers #3: Follow the opencouncildata.org standards, and participate in the process.
Source code for mergetrees.sql
We now have 370,000 trees but it’s of very variable quality. For instance, in some datasets, values like “Stump”, “Unknown” or “Fan Palm” appear in the “scientific name” column. We need to clean them out:
UPDATE alltrees

SET scientific='', genus='', species='', description=scientific

WHERE scientific='Vacant Planting'

OR scientific ILIKE 'Native%'

OR scientific ILIKE 'Ornamental%'

OR scientific ILIKE 'Rose %'

OR scientific ILIKE 'Fan Palm%'

OR scientific ILIKE 'Unidentified%'

OR scientific ILIKE 'Unknown%'

OR scientific ILIKE 'Stump';
We also want to split scientific names into individual genus and species fields, handle varieties, sub-species and so on. Then there are the typos which, due to some quirk in tree management software, become faithfully and consistently retained across a whole dataset. This results in hundreds of Angpohoras, Qurecuses, Botlebrushes etc. We also need to turn non-values (“Not assessed”, “Unknown”, “Unidentified”) into actual NULL values.
UPDATE alltrees

SET crown=NULL

WHERE crown ILIKE 'Not Assessed';
Source code for cleantrees.sql
Tip for data providers #4: The cleaner your data, the more interesting things people can do with it. (But we’d rather see dirty data than nothing.)
I use TileMill to make web maps. For this project it has a killer feature: the ability to pre-render a map of hundreds of thousands of points, and allow the user to interact with those points, without exploding the browser. That’s incredibly clever. Having complete control of the cartography is also great, and looks much better than, say, dumping a bunch of points on a Google Map.
As far as TileMill maps goes, it’s very conventional. I add a PostGIS layer for the tree points, plus layers for other features such as roads, rivers and parks, pointing to an OpenStreetMap database I already had loaded. Also show the names of the local government areas with their boundaries, which fade out and disappear as you zoom in.
My style is intentionally all about the trees. There are some very discreet roads and footpaths to serve as landmarks, but they’re very subdued. I use colour (from green to grey) to indicate when species and/or genus information is missing. The Waite Arboretum data has polygons for (I presume) crown coverage, which I show as a semi-opaque dark green.

Source code for the TileMill CartoCSS style.
There’s also an interactive layer, so the user can hover over a tree to see more information. It looks like this:
<b>{{{common}}} <i>{{{scientific}}}</i></b>

<br/>

<table>

{{#genus}}<tr><th>Genus </th><td>{{{genus}}}</td></tr>{{/genus}}

{{#species}}<tr><th>Species</th><td>{{{species}}}</td></tr>{{/species}}

{{#variety}}<tr><th>Variety</th><td>{{{variety}}}</td></tr>{{/variety}}
...
I also whipped up two more layers:
Source code for makespecies.sql.
It’s very easy to display a tiled, interactive map in a browser, using Leaflet.JS and Mapbox’s extensions. It’s a lot more work to turn that into an interesting website. A couple of the main features:
Source code for treesmap.html, treesmap.js, treesmap.css.
And of course there’s a server component as well. The lightweight tilelive_server, written mostly by Yuri Feldman, glues together the necessary server-side bits of MapBox’s technology. I pre-generate a large-ish chunk of map tiles, then the rest are computed on demand. This bit of nginx code makes that work (well, after tilelive_server generated 404s appropriately):
location /treetiles/ {

# Redirect to TileLive. If tile not found, redirect to TileMill.

rewrite_log on;

rewrite ^.*/(\d+)/(\d+)/(\d+.*)$ /supertrees_c8887d/$1/$2/$3 break;
 proxy_intercept_errors on;

error_page 404 = @dynamictiles;

proxy_set_header Host $http_host;

proxy_pass http://127.0.0.1:5044;
 proxy_cache my-cache;

}
location @dynamictiles {

rewrite_log on;

rewrite ^.*/(\d+)/(\d+)/(\d+.*)$ /tile/supertrees/$1/$2/$3 break;

proxy_pass http://guru.cycletour.org:20008;

proxy_cache my-cache;

}
A really obvious feature would be to show native and introduced species in different colours. Try as I might, I could not find any database with this information. There are numerous online plant databases, but none seemed to have this information in a way I could access. If you have ideas, I’d love to hear from you.
It would also be great to make a great mobile app, so you can easily answer the question “what is this tree in front of me”, and who knows what else.
Dear councils,
Please release datasets such as tree inventories, garbage collection locations and times, and customer service centres, following the open standards at opencouncildata.org. We’ll do our best to make fun, interesting and useful things with them.
Love,
The open data community
此内容由惯性聚合(RSS阅读器)自动聚合整理,仅供阅读参考。 原文来自 — 版权归原作者所有。