

惯性聚合 高效追踪和阅读你感兴趣的博客、新闻、科技资讯
阅读原文 在惯性聚合中打开

推荐订阅源

GbyAI
GbyAI
Threat Intelligence Blog | Flashpoint
S
Securelist
cs.CL updates on arXiv.org
Google DeepMind News
N
News and Events Feed by Topic
钛媒体:引领未来商业与生活新知
钛媒体:引领未来商业与生活新知
博客园 - Franky
T
Threat Research - Cisco Blogs
罗磊的独立博客
IT之家
IT之家
人人都是产品经理
人人都是产品经理
Stack Overflow Blog
Stack Overflow Blog
K
Kaspersky official blog
博客园_首页
T
The Blog of Author Tim Ferriss
T
Tenable Blog
I
InfoQ
Apple Machine Learning Research
T
The Exploit Database - CXSecurity.com
D
Docker
TaoSecurity Blog
TaoSecurity Blog
S
Schneier on Security
Attack and Defense Labs
N
News and Events Feed by Topic
M
MIT News - Artificial intelligence
U
Unit 42
N
Netflix TechBlog - Medium
L
LINUX DO - 热门话题
C
CERT Recently Published Vulnerability Notes
T
Tailwind CSS Blog
Hacker News: Ask HN
Hacker News: Ask HN
让小产品的独立变现更简单 - ezindie.com
爱范儿
爱范儿
美团技术团队
F
Fortinet All Blogs
Last Week in AI
Last Week in AI
AWS News Blog
AWS News Blog
V
V2EX
博客园 - 【当耐特】
cs.AI updates on arXiv.org
Hacker News - Newest:
Hacker News - Newest: "LLM"
Schneier on Security
腾讯CDC
H
Help Net Security
B
Blog RSS Feed
T
Tor Project blog
P
Privacy & Cybersecurity Law Blog
The Last Watchdog
The Last Watchdog
有赞技术团队
有赞技术团队

Blogs on CoreDNS: DNS and Service Discovery

CoreDNS-1.14.2 Release CoreDNS-1.14.1 Release CoreDNS-1.14.0 Release CoreDNS-1.13.2 Release CoreDNS-1.13.1 Release CoreDNS-1.13.0 Release CoreDNS-1.12.4 Release CoreDNS-1.12.3 Release CoreDNS-1.12.2 Release CoreDNS-1.12.1 Release CoreDNS-1.12.0 Release CoreDNS-1.11.4 Release CoreDNS-1.11.3 Release CoreDNS-1.11.2 Release CoreDNS-1.11.1 Release CoreDNS-1.11.0 Release CoreDNS-1.10.1 Release CoreDNS-1.10.0 Release CoreDNS-1.9.4 Release CoreDNS-1.9.3 Release CoreDNS-1.9.2 Release CoreDNS-1.9.1 Release CoreDNS and Apache APISIX open new doors for Service Discovery? Trail Of Bits Security Review CoreDNS-1.9.0 Release CoreDNS-1.8.7 Release CoreDNS-1.8.6 Release CoreDNS-1.8.5 Release CoreDNS-1.8.4 Release CoreDNS-1.8.3 Release CoreDNS-1.8.2 Release CoreDNS-1.8.1 Release CoreDNS-1.8.0 Release CoreDNS-1.7.1 Release CoreDNS-1.7.0 Release CoreDNS-1.6.8 Release CoreDNS-1.6.9 Release CoreDNS-1.6.7 Release CoreDNS-1.6.6 Release CoreDNS-1.6.5 Release CoreDNS-1.6.4 Release CoreDNS-1.6.3 Release CoreDNS-1.6.2 Release CoreDNS-1.6.1 Release CoreDNS-1.6.0 Release CoreDNS-1.5.2 Release CoreDNS-1.5.1 Release CoreDNS-1.5.0 Release CoreDNS-1.4.0 Release CoreDNS-1.3.1 Release CoreDNS-1.3.0 Release Cluster DNS: CoreDNS vs Kube-DNS Scaling CoreDNS in Kubernetes Clusters CoreDNS-1.2.6 Release CoreDNS-1.2.5 Release CoreDNS-1.2.4 Release CoreDNS-1.2.3 Release CoreDNS-1.2.2 Release CoreDNS-1.2.1 Release CoreDNS-1.2.0 Release CoreDNS-1.1.4 Release CoreDNS-1.1.3 Release Migration from kube-dns to CoreDNS CoreDNS-1.1.2 Release CoreDNS-1.1.1 Release Cure53 Security Assessment CoreDNS-1.1.0 Release CoreDNS-1.0.6 Release Deploying Kubernetes with CoreDNS using kubeadm CoreDNS-1.0.5 Release CoreDNS-1.0.4 Release CoreDNS-1.0.3 Release CoreDNS-1.0.2 Release CoreDNS-1.0.1 Release CoreDNS-1.0.0 Release CoreDNS-0.9.10 Release Setting up CoreDNS (on AWS) CoreDNS-0.9.9 Release Semantic Versioning CoreDNS-011 Release A first look at CoreDNS Logging with dnstap Intro to CoreDNS webinar by John Belamaric CoreDNS-010 Release Compile Time Enabling or Disabling Plugins When Should Plugins be External? Add External Plugins Corefile Explained CoreDNS-009 Release CoreDNS-008 Release How Queries Are Processed in CoreDNS Custom DNS Entries For Kubernetes CoreDNS-007 Release CoreDNS for Minikube Why CNCF for CoreDNS? CoreDNS for Kubernetes Service Discovery, Take 2 How to Add Plugins to CoreDNS History of CoreDNS in four posts. CoreDNS-006 Release CoreDNS-005 Release
CoreDNS Performance Testing
miek · 2017-08-09 · via Blogs on CoreDNS: DNS and Service Discovery

As CoreDNS is an inception level project under the CNCF which means we have access to the physical cloud infrastructure of Packet, a bare metal(!) cloud provider. Physical machines imply performance and also because you get an entire machine you can use them for performance metrics.

For CoreDNS we have a few Benchmark tests (from the Go standard library) that haven’t seen much use. Typically you run these before your change and then after your and then use a tool like benchcmp to compare the results and impress your PR’s reviewers. This is all pretty manual, a more automated (and visual!) way would be welcome.

Our new Packet machines to the rescue. We’ve setup the following work flow:

GitHub > webhook > mbench > prometheus > grafana

I.e. we configured a webhook that gets triggered on a pull request and then via some Caddy proxy trigger gets delivered to webhook. Webhook then kicks of a shell script, that pulls down CoreDNS’ repo and the correct pull request. ^[Yes, this script parses the JSON with grep, ultimately that was the only way to make it reliably work.]

This benchmark script does nothing more than run the bench mark tests: go test -run='' -bench=. -benchmem ./... 2>/dev/null).

The output from these tests, i.e:

BenchmarkRequestDo-8   1000000000	 2.11 ns/op	  0 B/op    0 allocs/op

… is written into the named pipe which is then picked up by mbench and converted into Prometheus metrics:

2017/06/25 09:21:51 [INFO] Parsed line: {branch="pr-753",cpu="8",subsystem="coredns"}requestdo_coredns: 1000000000 2.110000 0 0

The latest known branches are found by using a “recording rule” that uses an extra metrics that mbench exports: _start_time_seconds: So we only see the active branches from the last n branches:

benchmark_coredns_branches_topk10 = topk(10, benchmark_coredns_cacheresponse_start_time_seconds{branch != "master"})

There is also cron.hourly that tests master on a continuous basis, which we display separately in Grafana.

Grafana

In Grafana, for each defined benchmark, we’ve setup a templated dashboard: benchmark_coredns_[[benchmark]]_run_gauge{branch=~"$branch"}:
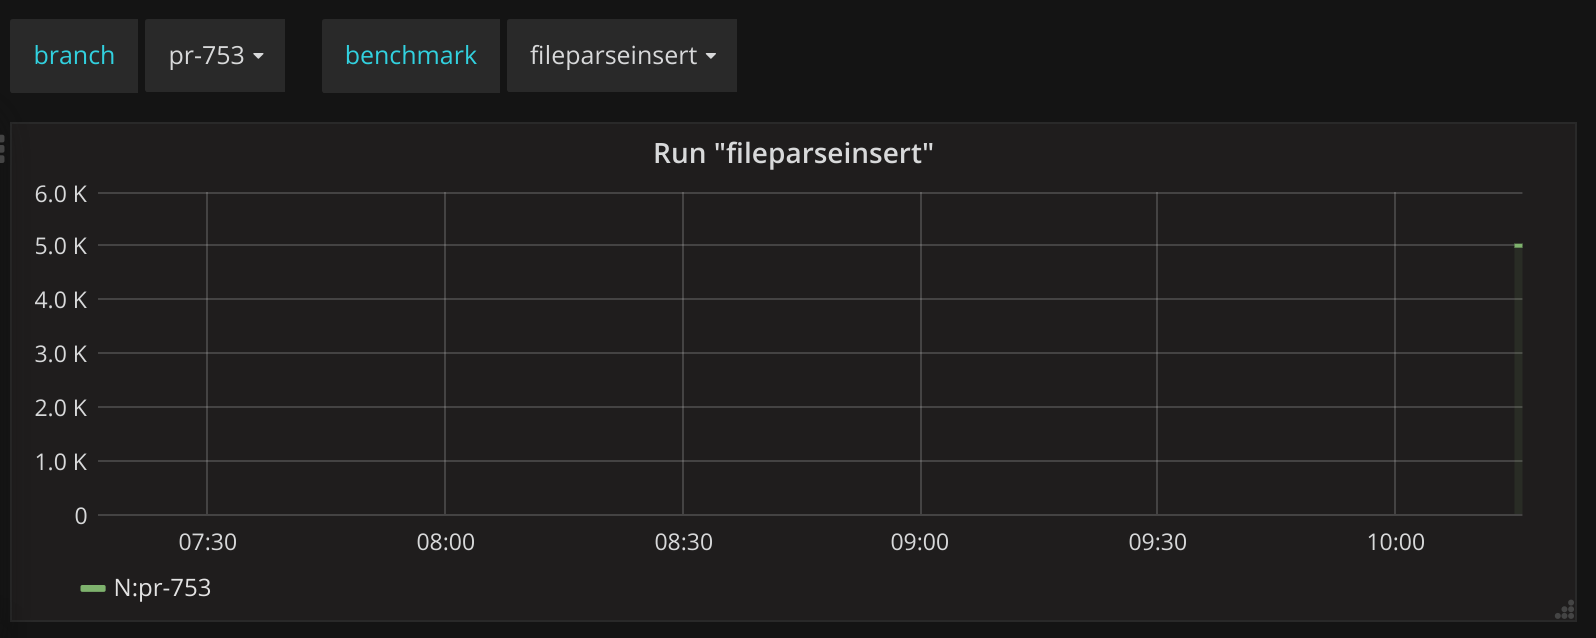
Branch and benchmark selectors in Grafana.

So we can easily select that branch and compare it with whatever other branch.

Thus in the end leading to a dashboard where you can easily compare your performance against the master branch: https://snapshot.raintank.io/dashboard/snapshot/0er0u40KAZ1YM4dl0KgDUkeD3KhzZqFj
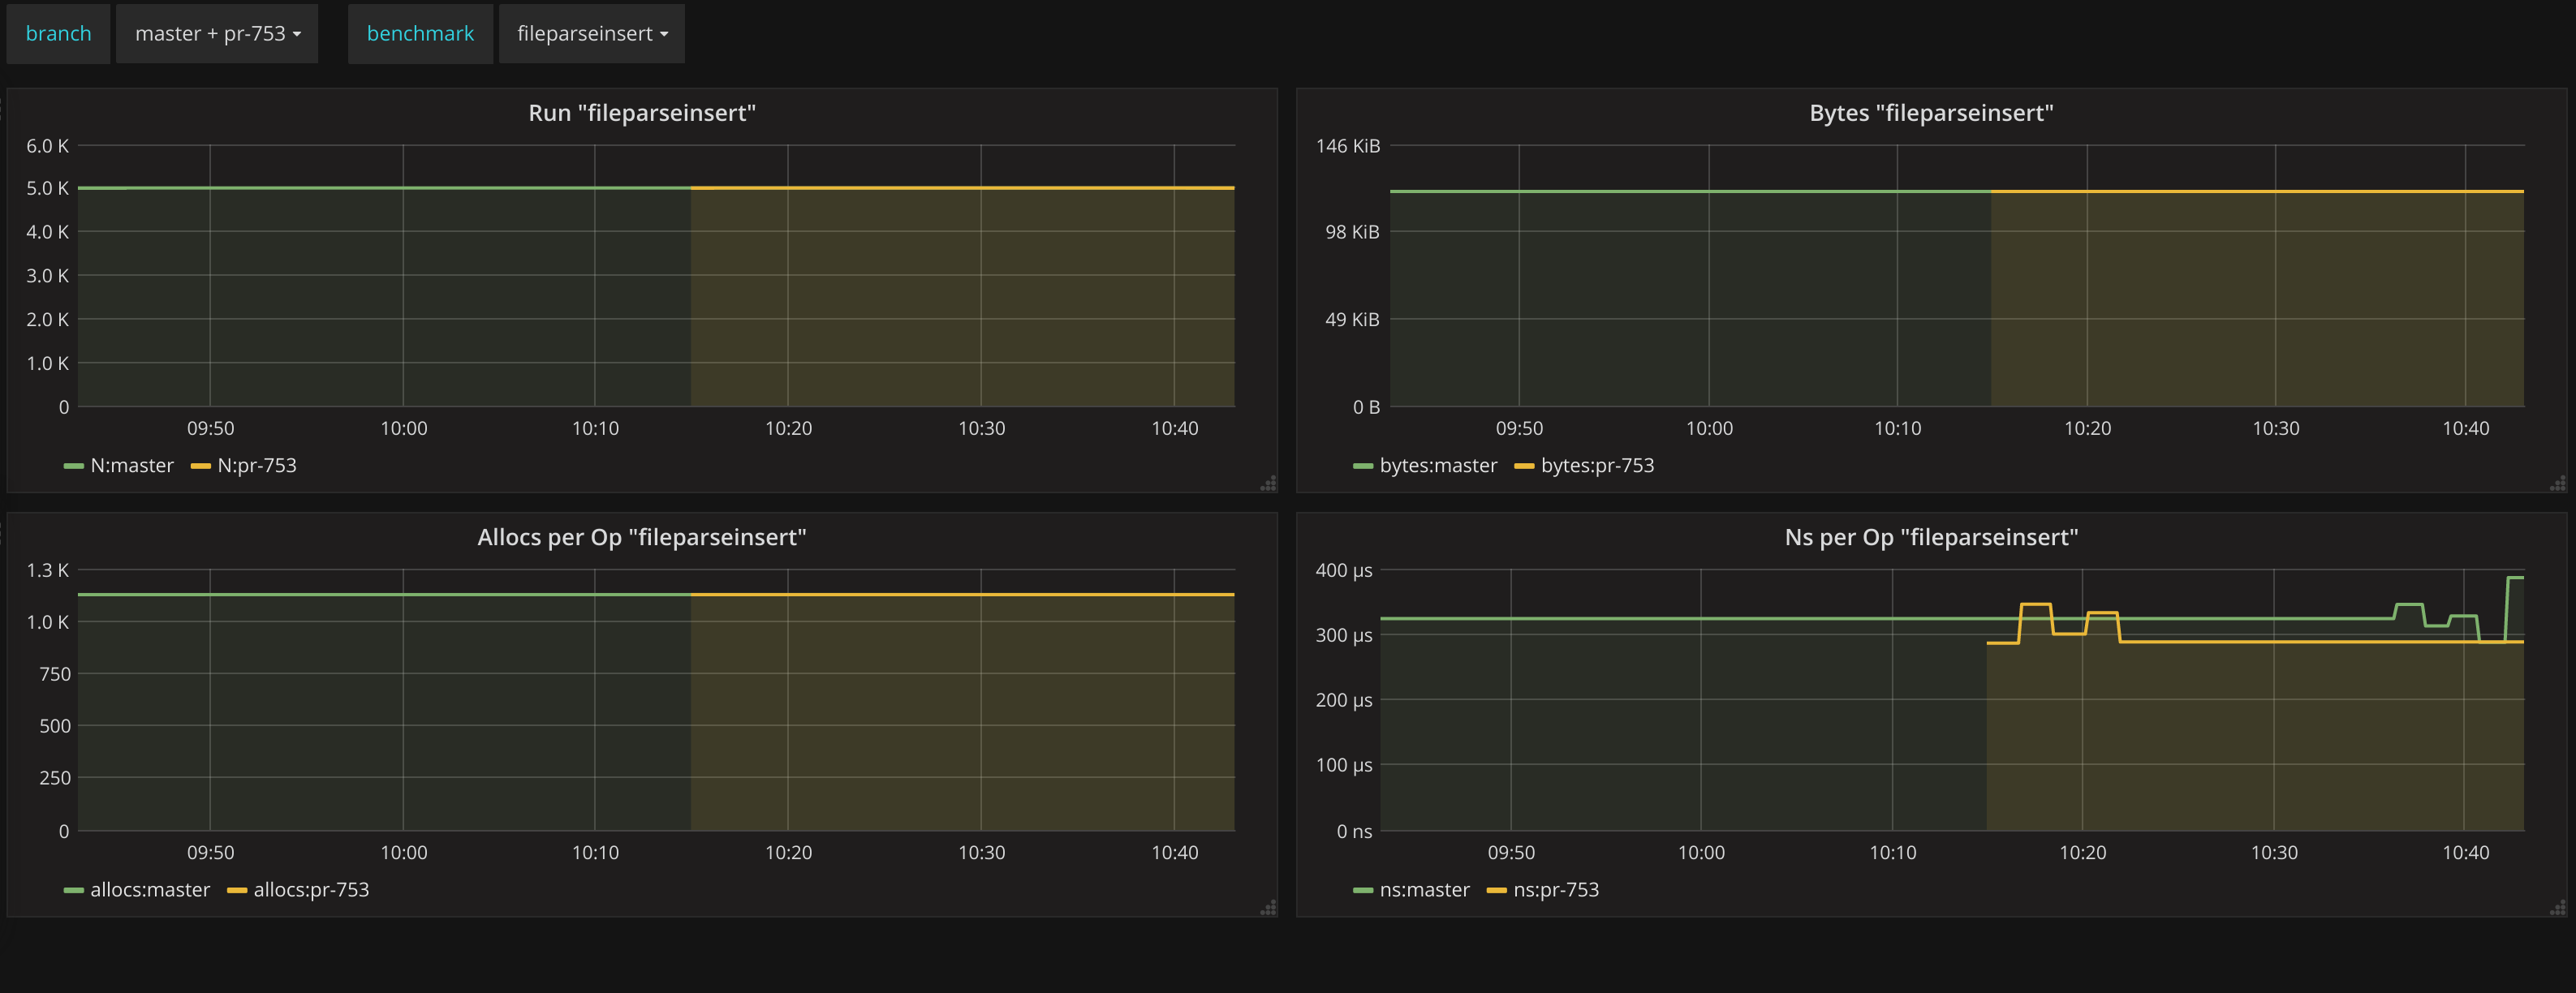
Benchmark dashboard.

The end result of all this is that if someone adds an optimization it will be immediately visible in the stats. Any new pull request shows up automatically and any new benchmark function will also be automatically discovered.