







That is, they do not think about logging until an incident happens. Then it is too late: the threat actor is not likely to repeat its actions for the sake of being logged.
Often, the assumption is that the logs on the device or devices are enough. This has, so far, seldom been true: firewalls, routers, and other network devices have very limited storage capacity. In some of our cases, the logs covered only a few minutes and did not bring any value to the investigation.
Having extensive and complete logs helps with incident responses and forensic analyses by enabling the investigators to search through the events: for example, this helps to answer the question as to when an RDP connection occurred or what user is related to a certain VPN session.
For that reason, regulatory frameworks, such as PCI-DSS, require that the logs are kept for a certain period, called the “log retention”. For example, PCI-DSS specifies 12 months. The only way to guarantee that the log will meet their retention period is to store them on a dedicated server, that we call a “log collector.”
Lastly, the log collector is a mandatory step in the automated processing of logs. We will present this in another post.
The network vendors usually have their own logging protocols that work with their solutions for logs collection. We may cite Fortigate and its Fortianalyzer, or Clavister and its InControl.
A common logging protocol that is universally available is the venerable Syslog, defined originally in RFC3164 and updated in RFC5424.
Syslog can log remotely, it is then a text protocol that uses, generally, UDP to send log entries from the source, called “originator”, to a log destination, called “collector”, with or without relays in between. For the rest of this article, we will consider the case and use of Syslog from an originator to a collector without any intermediate relay and over a cleartext UDP connection. Note that many collectors and originators support connection-oriented transport using TCP, and some even support using TLS to provide confidentiality. The benefit of using TCP is that messages cannot be lost in transit, but it comes at the expense of requiring more resources on the originator.
On the collector, a software receives the log messages. There, the choice is vast and depends on how the collected logs will be stored: files or indexed storage.
This is a very common way of storing the logs: the entries are, if needed, converted to text and written to files on a disk. These files are then rotated based on volume or time, with the files having passed the retention period being removed.
In addition, the rotated files are often compressed to preserve the disk space, permitting efficient use of the storage.
The data in the files can be searched, but that is usually slow, error-prone, and cumbersome when complex queries are required.
“Storing in indices” is a generic term to indicate that the log entries are parsed and stored in a database, for example Apache Lucene or Azure Sentinel. They both take the parsed fields from the log, for example “source IP” and “destination IP” and add them to an index which maps these entries to the actual messages, making them optimized for searches.
The main advantage of this method of storage is the speed at which it is possible to search the logs, usually several hundred times faster than using files. The drawback is that the storage requirements are a lot more than simply storing files, especially if the logs must be kept for several months.
Complex queries are not an issue: languages such as Kusto and Lucene have been developed for that exact purpose.
A solution often seen is to use both the file and indices storage: file storage for long term retention and index storage for immediate searches and processing.
In that case, the file storage is configured to keep the unprocessed log entries for the full retention period; the indices are used to make the logs searchable over a period of 30 to 90 days.
The finality being decided, we can look at the various software options. This article will consider that the installation is done on a Linux server.
For file storage, the usual programs are “rsyslog” and “syslog-ng”. The latter has more options and features to filter and process logs prior to storage. Both are readily available as packages for most Linux distributions.
The rotation of logs is achieved via the tool logrotate. It also takes care of the retention by ensuring that the correct number of files are kept on the filesystem.
These three tools are specific to Elastic’s Elasticsearch, an open-source search and analysis platform built on top of Apache Lucene. They can ingest logs in a variety of forms, including receiving syslog, parse them and ship them to Elasticsearch for mapping and indexing.
The rotation and retention of logs is achieved via the use of Index Lifecycle policies, which specify the period the logs are kept in a certain tier and the total time after which they are deleted.
In addition, Elastic Pipeline offers ways to enrich the data during the ingestion, for example by adding the geoip information or by tagging the events if an IOC is present.
This is the tool that Truesec MDR uses to ingest and parse logs, and to send them to an Azure Sentinel where the SOC analyzes them in real time.
Datadog’s vector can be seen as a Swiss army knife when it comes to ingesting, transforming and outputting data.
Our scenario is to install syslog-ng on a Linux Ubuntu Server running on a virtual machine. This is a very common setup, simple yet powerful enough for many situations.
Syslog is not a very intense process and will accommodate even modest configurations. However, it is important to plan for the processing that we will add later.
For that, I chose 4 vCPU and 8GB of RAM. This is plenty to collect the logs and do some processing later. Dynamic features from the hypervisor, such as dynamic memory allocation, may be leveraged to adapt to varying workloads. The Operating System (OS) will be Ubuntu Server 24.03, a common Server-grade distribution.
Disk-wise, the important part is to allow for growth. For that, I will set a first virtual disk of 64GB for the OS and the user directories. A second virtual disk will hold the logs. The Logical Volume Manager will be used to enable adding devices later if the initial space is too small.
Estimating the space taken by the logs is a fairly complex exercise, with a lot of guesswork, and volumes that will depend on unpredictable events. I propose the following process:
If that number is above 1TB, add a second disk to cover the delta and add it to the LVM for the log group.
Ideally, that server should be part of the devices that an NMS monitors to detect early high disk space usage.
This looks like this in practice.

The figure above shows, under the “SCSI Controller”, the two disks: SYSLOG01 (64GB) for the Operating System, SYSLOG01-02 (1TB) for the logs.
Note that the Template under “Secure Boot” must be set to “Microsoft UEFI Certificate Authority”, otherwise it will not boot.
Time to boot the machine. Turn it on and let it run. You should soon be faced with the following screen.

Pick your language, keyboard, option for the server (normal or minimized). Make sure to select “Search for third-party driver.” Configure the network stack, proxy, mirror. Time to configure the disk layout. Select a manual layout.
On the 64GB disk, create a new GPT partition: 8GB, type “swap”. This automatically creates the UEFI partition. Create a second GPT partition with all the space left, mounted as “/”. This takes care of the OS disk.

For the log space, create Volume Group (LVM) and attach the 1TB disk. Give it a meaningful name, such as vg-logs.

Add a new logical volume, called lv-logs inside vg-logs. Keep ext4, and mount as “Other” on /var/log.
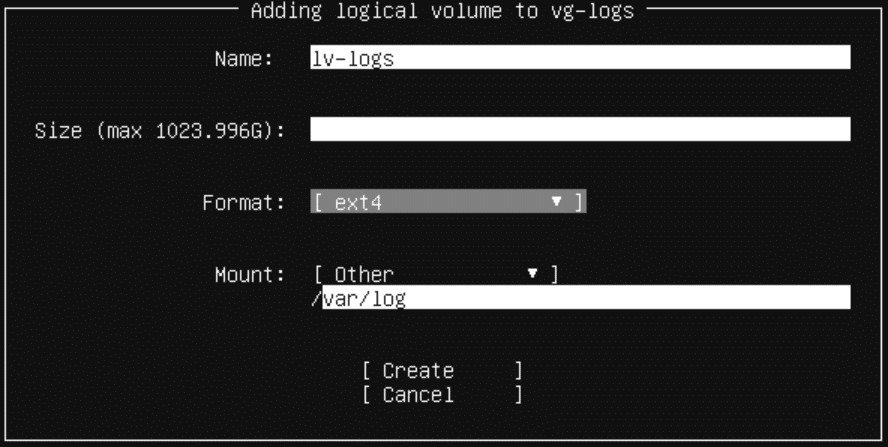
And you are done!
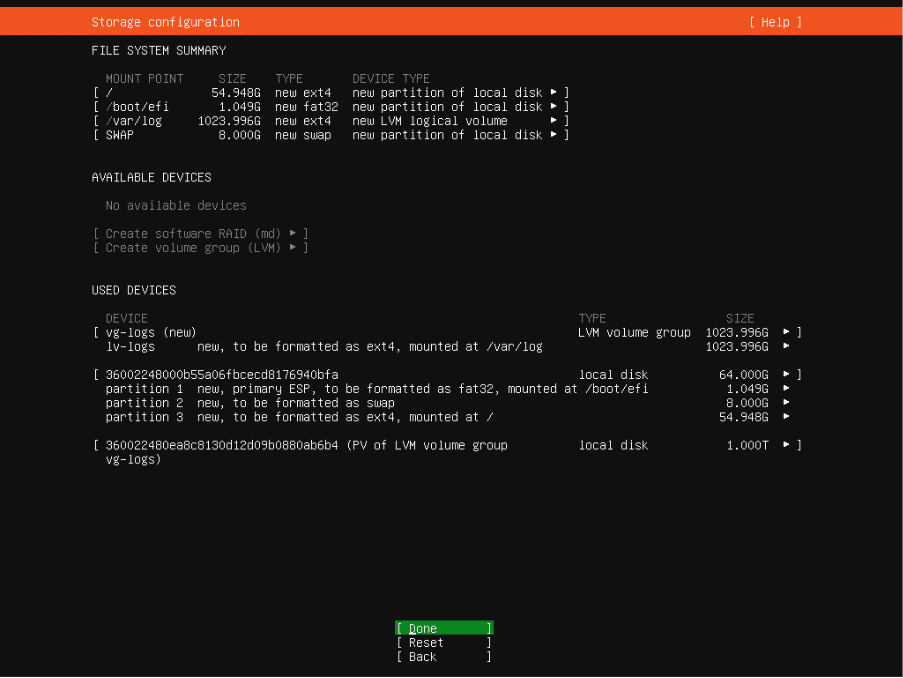
Accept the changes and move to the next screen, where you will provide a name, server name, username and passwords. Then done. Keep going, don’t forget to install the OpenSSH server when offered. Don’t select any featured server snap and the system installation starts.

When the installation completes, reboot.
First, let’s update the system. Login and issue the commands “sudo apt update && sudo apt full-upgrade”. Accept the changes and let the update run to the end.
When this has completed, time to install syslog-ng: “sudo apt install syslog-ng”and accept the installation.
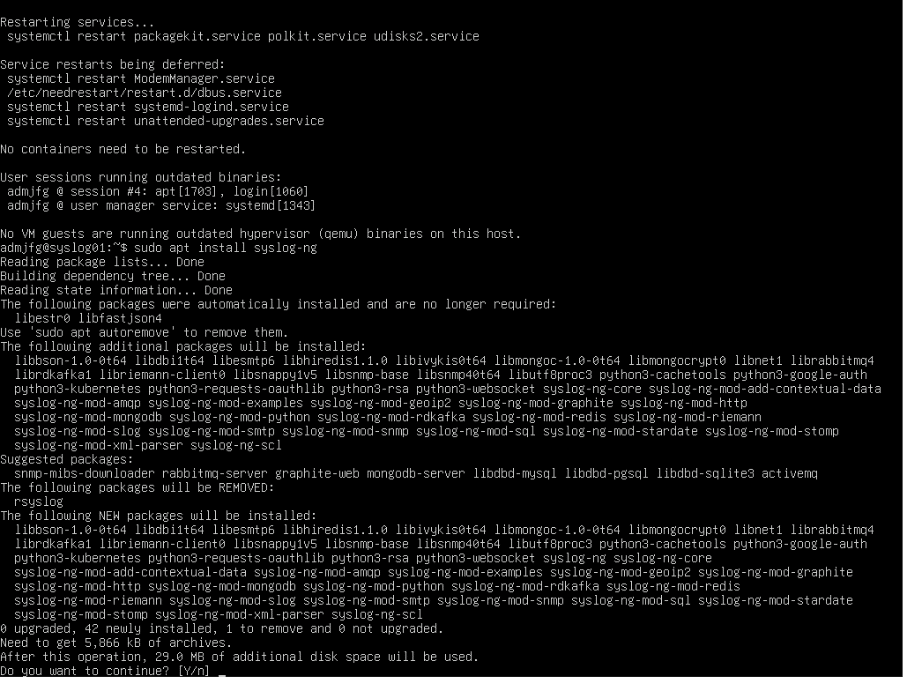
And that’s it, syslog is installed. Now we need to configure it.
Before we put hands to keyboard, let’s define what we want.
We want our syslog to receive the logs via the network on 514/udp.
While it would be possible to store the logs received from every device in a single file, that is not be a good idea. Instead, we want a hierarchy under “/var/log” that includes the IP address of the system from which the log was received. To make it obvious that these messages came via the network, we want them in a directory called “network”. For example, the logs from a firewall sending its logs from 192.168.128.1 should go under “/var/log/network/192.168.128.1/”.
The filename will be “messages”. All logs coming from the same device will go to the same destination.
Syslog-ng works by associating an input, an eventual filter, and a destination. This corresponds to the sections source{}, filter{} and destination{}. Ultimately, these are chained together into a pipeline by the directive log{}.
To organize properly the configuration, we will create the sources in “/etc/syslog-ng/conf.d/01-sources.conf”, the filters in “10-filters.conf”, the destinations in “20-destinations.conf” and the log statements in “90-logs.conf”.
Our events come from the network on 514/udp. This is achieved by the following statements.

This indicates that we want to listen to events from any IP coming via UDP on port 514. Simple.
For now, we will not have any filter defined so let’s skip this file.
As written above, we want to store the files into /var/log/network//messages, where is the IP address of the sending host.
Syslog-NG has a notion of macros, that is special “words” that have a value that syslog-ng determines when it receives a message. Macros can be used to generate file names or paths, among other things.
As we won’t traverse any syslog relays, we can use the macro ${SOURCEIP}. It represents the IP from where the message comes from. If we had an intermediate relay, the macro would contain the IP of the relay itself, not of the original source.

The additional “create_dirs(yes)” indicates that if a directory does not exist, syslog-ng must create it. Otherwise, the administrator must create the different directories that the logs are stored in.
The last piece is the log{} directive which binds the input, the eventual filter and the output.
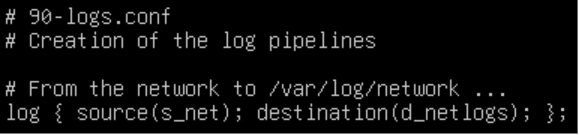
One “systemctl restart syslog-ng” later, we are in business. We can check that the daemon is listening on 514/udp with “ss -aun”

That is all for the server side.
The next step is to configure our firewall to send its logs to the syslog collector.
The logging configuration is specific to each firewall, for this post, we configure an OPNSense firewall to send its logs to our new collector.

If all is going well, we should now have the first messages in /var/log/network//messages, as shown by “ls -alsh”.

If we leave this as it is, the file “messages” will grow until it fills all the available space.
To prevent this, Linux has a mechanism called “logrotate”, a daemon that runs periodically and is responsible for renaming and deleting old log files.
Let’s assume that our retention policy is 190 days (a bit more than 6 months) with daily rotation. Rotated files should be compressed even if they are empty.
The definition of the rotation parameters is in the files stored in /etc/logrotate.d. Using /etc/logrotate.d/syslog-ng as a base, we have the following configuration.
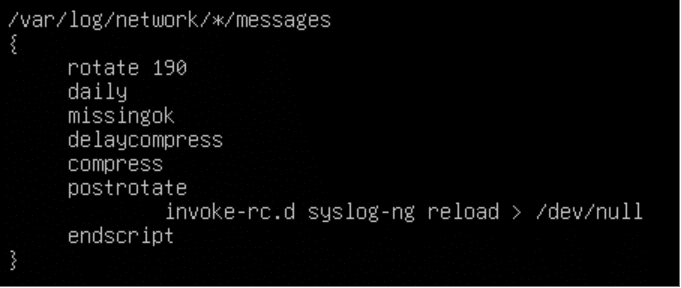
And there we have it: a log collector that will keep the data for half a year.
We mentioned that between the input and the destination, we can set filters. These are ways to limit the messages that will be sent to a specific destination. In our case, we pass everything we receive to the destination.
By default, syslog-ng adds the usual syslog timestamp defined in RFC 3164. It is recommended to use the ISO8601 format, which includes the year, instead.
This is set by adding “ts-format(iso);” to the options in /etc/syslog-ng/syslog-ng.conf.
The protection comes at 3 levels:
Backups. That is the most effective way.
With backups in place, a question can be asked on the retention: if we keep the retention on the server at 6 months and have a backup schedule that enable retrieving the information up to 3 months in the past, we are effectively creating a 9-month retention, 3 of which are not immediately available for analysis.
In that case, it may be worth considering diminishing the retention on the server, for example to 4 months. Added to the 3 months in backup, we can retrieve up to 7 months of logs, 4 of which are immediately available.
The log collector is part of the fabric and should be protected as such: access to the network should be filtered and user accounts on the machine should NOT be the same as in the main Active Directory domain.
We have had incidents in which the client had a log collector as a virtual machine. Unfortunately, the threat actor destroyed most virtual machines by encrypting the virtual disks.
The hypervisor is also part of the fabric and should be protected as such: separate networks, separate accounts.
Now that we have a log collector set up, we can look at setting an automatic processing to detect immediate issues. This will be the subject of a future post.
此内容由惯性聚合(RSS阅读器)自动聚合整理,仅供阅读参考。 原文来自 — 版权归原作者所有。