



Playwright ships with a black-box recorder that records every detail of every test, giving you a treasure trove of information for debugging flaky tests. Most Rails apps I’ve worked on don’t use it.
It’s called the Trace Viewer, and if you’re running Capybara with Playwright via playwright-ruby-client, turning it on takes a single block in rails_helper.rb.
When Playwright records a trace, you get back a .zip you can replay in the Trace Viewer. The viewer is essentially a DVR for your test run. For every action Playwright took, every click, fill_in, and navigation, you get:
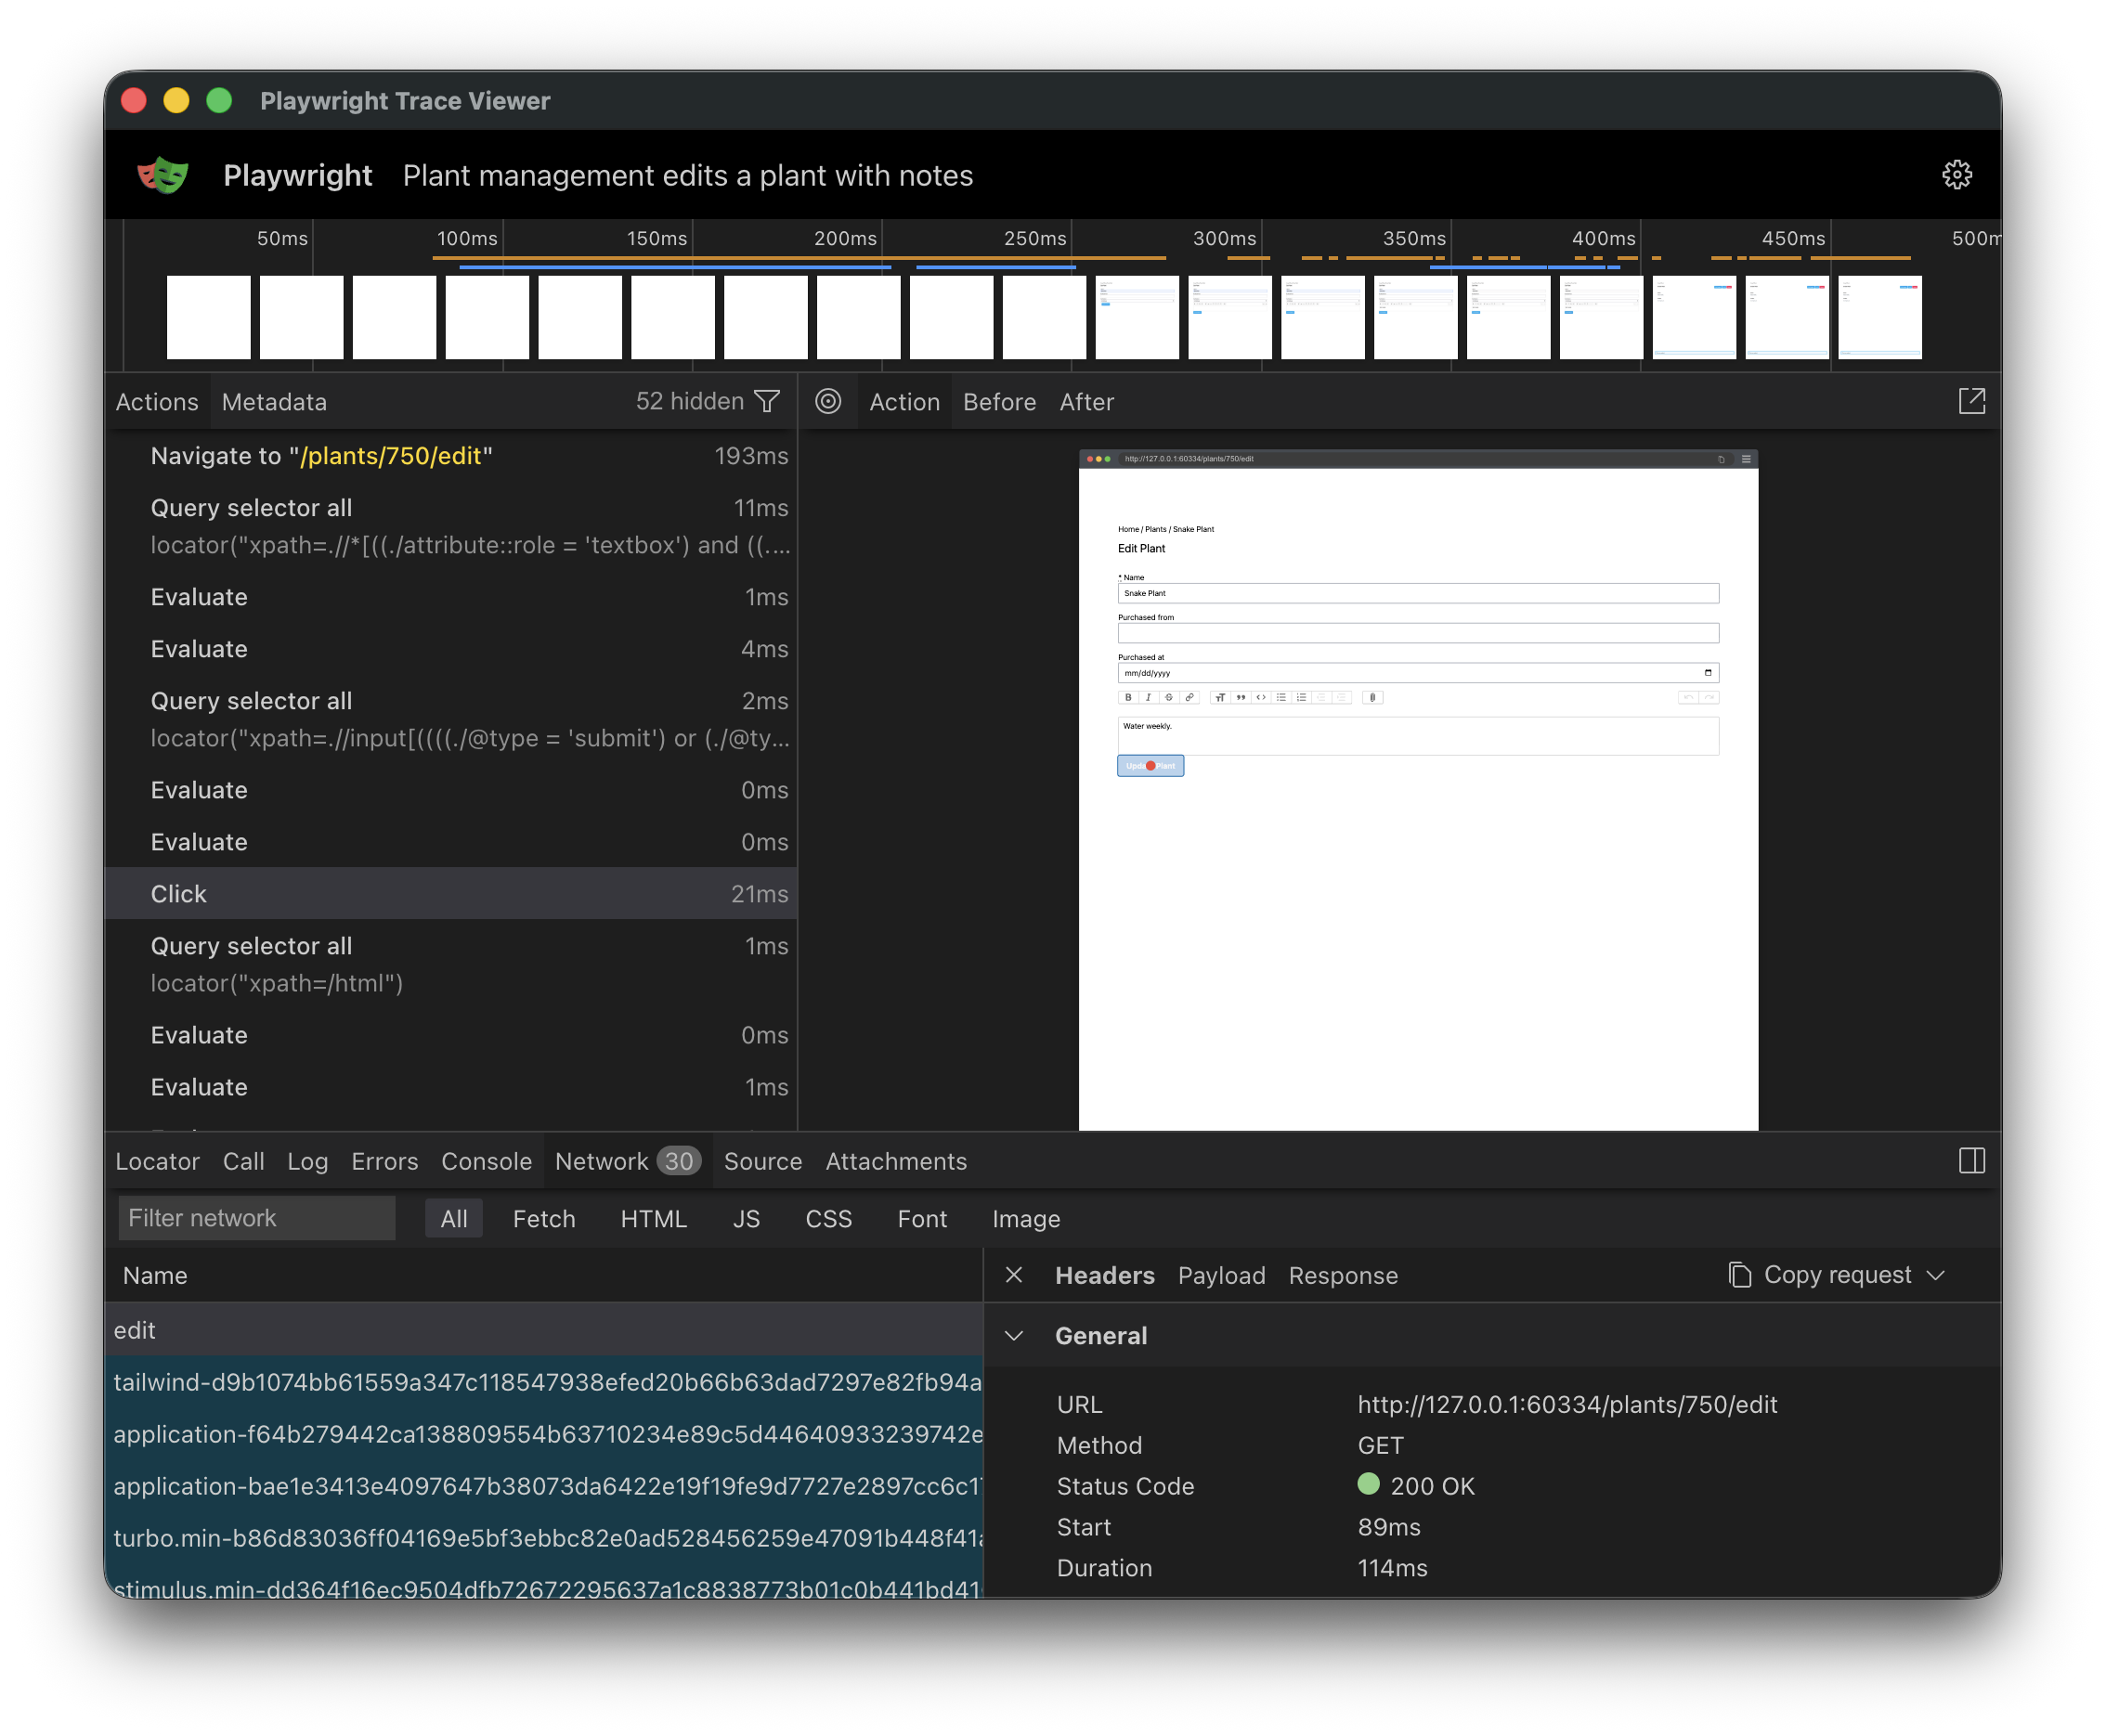
Compare that to what you usually get when a test fails on CI: A screenshot, and maybe a stack trace pointing at expected to find "Saved". With a trace, you can scrub through the test like a video, and pinpoint exactly where things went wrong.
Drop this into your rails_helper.rb. It assumes you’re using playwright-ruby-client.
You may need to change type: :system to type: :feature if that’s how you set up your browser-based tests.
RSpec.configure do |config|
  config.before(:each, type: :system) do |example|
    driver = Capybara.current_session.driver
    next unless driver.respond_to?(:start_tracing)

    driver.start_tracing(
      screenshots: true,
      snapshots: true,
      sources: true,
      title: example.full_description
    )
    example.metadata[:playwright_tracing] = true
  end

  config.after(:each, type: :system) do |example|
    next unless example.metadata[:playwright_tracing]

    path = trace_path(example)
    Capybara.current_session.driver.stop_tracing(path:)
    if example.exception
      output = RSpec.configuration.output_stream
      output.puts("Playwright trace: #{path}")
    end
  rescue Playwright::Error => e
    raise unless e.message.start_with?("Must start tracing before stopping")
  end

  def trace_path(example)
    if example.exception
      Rails.root.join(
        "tmp",
        "playwright-traces",
        [
          example.full_description.parameterize[0, 150],
          "-#{Time.current.to_i}",
          ".zip"
        ].join
      )
    else
      File::NULL
    end
  end
end
This starts a trace before every feature spec and only saves it if the test failed. When that happens, you’ll see a line like this printed:
Playwright trace: /Users/jutonz/code/thoughtbot/testing/tmp/playwright-traces/it-works-1775576941.zip
A few things in the snippet might catch your eye (the before(:each) instead of around, the rescue, the conditional path). They’re like that for a reason. Copy as-is, or expand below for the rationale.
before(:each) over around. Capybara only swaps from RackTest to Playwright after it sees the spec’s :js (or js: true) metadata. That swap happens after the around block, so a hook running there would still see the RackTest driver and respond_to?(:start_tracing) would always be false.rescue Playwright::Error. If start_tracing failed for any reason, e.g. if a test modifies some low level driver config, stop_tracing will throw a “Must start tracing before stopping” error. Catching it won’t fail an otherwise passing test because of a tracing issue.trace_path / File::NULL. Playwright requires you to write a trace somewhere once you’ve started one. Since we don’t care about traces for passing tests, we discard them by writing them to the /dev/null null device.You’ll want to keep failed traces around for inspection. In GitHub Actions, add an upload step that runs even when the suite fails:
- name: Upload Playwright traces
  if: failure()
  uses: actions/upload-artifact@v4
  with:
    name: playwright-traces
    path: tmp/playwright-traces
Now you can download traces after a failed test.
Once you’ve downloaded a trace zip, open it with:
npx playwright show-trace path/to/trace.zip
That spins up the Trace Viewer in a local browser. The Playwright docs cover the UI in detail.
A couple of things worth knowing once traces are on.
Traces only show Playwright actions, not Capybara or RSpec.
A click_on("Save") call will appear as Click in the trace, since that’s the underlying Playwright action that’s performed. Usually it’s easy enough to map the Playwright action to the Capybara version, but it won’t be exactly the same.
The trace recorder is also capable of capturing Playwright-based assertions, but if you’re using Capybara, these won’t show up. Capybara does assertions itself, rather than delegating to the driver. This is because Selenium and other drivers don’t support built-in assertions.
There’s a small I/O cost.
Recording is mostly disk-bound. In my experience the cost is negligible, but if your CI is I/O-constrained, you might notice it as new flakiness. If that happens, you can store traces in a tmpfs or ramdisk by passing tracesDir to the driver:
Capybara::Playwright::Driver.new(
  app,
  # ... existing options ...
  tracesDir: ENV["CI"].present? ? "/mnt/ramdisk/playwright-traces" : nil,
)
CircleCI exposes /mnt/ramdisk by default. On other providers you can create a tmpfs directory manually.
Before traces, my approach to flaky CI was guess, re-run, and hope. Now I open the artifact, scrub through the test, and see the actual problem. The difference is night and day, and the setup is one block of code.
If you’re running Playwright through Capybara, you’ve already got everything you need. Turn it on.
此内容由惯性聚合(RSS阅读器)自动聚合整理,仅供阅读参考。 原文来自 — 版权归原作者所有。