









A number of people have asked me to put some of my recent writing on European economic performance outside the paywall. Here is the central argument, revised to include data I think is slightly more informative.
I’m still in Europe, where one of the luxuries I’m experiencing is not having to think about Donald Trump and the nightmarish state of U.S. politics 100% of the time — more like 90%, but still. And by way of luxuriating in the slight emotional distance, I’ll postpone my next primer on healthcare for another week and talk more this week about European economic performance.
Last week I wrote about the question of whether Europe is really falling behind the United States economically. I argued that the conventional narrative of clear relative decline is wrong. And I followed up with a small formal model of the underlying logic of the situation as I see it.
I’m gratified to have started a wider discussion, with smart observers like Noah Smith and Luis Garicano weighing in. Judging from the conversation so far, however, I need to do more to explain my central point — which is that widely used comparisons of productivity growth can’t be used to judge European versus U.S. economic success.
In today’s post, then, I’ll try to offer more explanation, backed by some additional data and what I hope are useful analogies.
Below I will address the following:
1. Comparing Europe with America
2. The US-Europe paradox: Slow European growth, but without a growing gap
3. Explaining the paradox
4. What Europe should and shouldn’t worry about
Comparing Europe with America
When we compare the European, or at least northern European, economy with that of the United States some points should be indisputable. Both are wealthy economies that make extensive use of modern technology, with no obvious winner in terms of sophistication — the days when Jacques Chirac lamented that the internet was an “Anglo-Saxon network” are long past. Americans, however, have more stuff, that is, material goods: Our houses and cars, in particular, are much bigger. Europeans, on the other hand, have more time, working shorter hours and taking more vacations, and have the security and longer lifespans that come with more extensive social programs such as guaranteed healthcare, and sane gun regulations.
Which side of the Atlantic lives better? Your kilometerage may vary. As an American progressive who favors strong social safety nets — basically what Europeans would call a social democrat — I find a lot to admire in the European way. And even the Draghi report, with its call to arms over what it portrays as a loss of European competitiveness, starts by praising Europe’s economic and social achievements.
However, while the question of which continent offers a better life is obviously important politically, it’s somewhat separate from the question of which way the US-Europe comparison is trending. Mario Draghi, like many observers, concedes that Europe is a good place to live now, but warns that it is falling behind, above all suffering from low productivity growth compared with the United States. Noah concludes his response by saying that
you have to reckon with the uncomfortable fact that America’s output per hour has soared while West Europe’s has grown only slowly.
But is that a fact? Or at any rate is it the relevant fact? The main point of what I’ve been trying to say is that I do not think that output per hour, i.e., productivity, means what many people think it means.
So let me try to further explain that point using somewhat different data and a different presentation approach than I did last week.
The apparent US-Europe paradox
Gross domestic product (GDP) is the total value of goods and services produced by an economy over a given period, usually a year. On its own, GDP in a given year isn’t that informative a number (although people would have a better perspective on many issues if more of them knew just how big U.S. GDP is — currently running at an annual rate of more than $30 trillion.) Normally, we want to compare GDP over time and space — GDP in two different years or two different countries.
Such comparisons require making some adjustments. To compare GDP over time, economists normally look not at raw GDP but at “real GDP” — GDP at constant prices, that is, measured in the prices of a base year, currently 2017 in most U.S. data but 2021 in the World Bank data I use below.
To compare GDP between countries, economists could and sometimes do just use dollar values. But such comparisons jump around when currencies fluctuate, so economists often use “purchasing power parity” (PPP) -- GDP in different countries adjusted for difference in countries’ overall price levels.
How, then, can we compare nations’ economic performance over time? Analyses that raise the alarm about European competitiveness generally look at the growth of real GDP, either per capita or per working hour, that is, productivity, in each country. But we can also simply compare GDP per capita or per hour at each point in time using PPP.
One might think that these approaches — one based on GDP at constant prices and one based on GDP at PPP — would tell the same story. But they don’t. And that is what I’m calling the apparent US-Europe paradox. I use the qualifier “apparent” because, as I will explain shortly, once one takes into account how productivity affects prices, the paradox is resolved.
Let’s start by looking at GDP per capita in Europe (actually the euro area) as a percentage of GDP per capita in the US. If we do this using constant prices — the World Bank uses 2021 prices — we get the line in Chart 1 labeled “2021 prices.” This line shows Europe falling behind over the past 25 years.
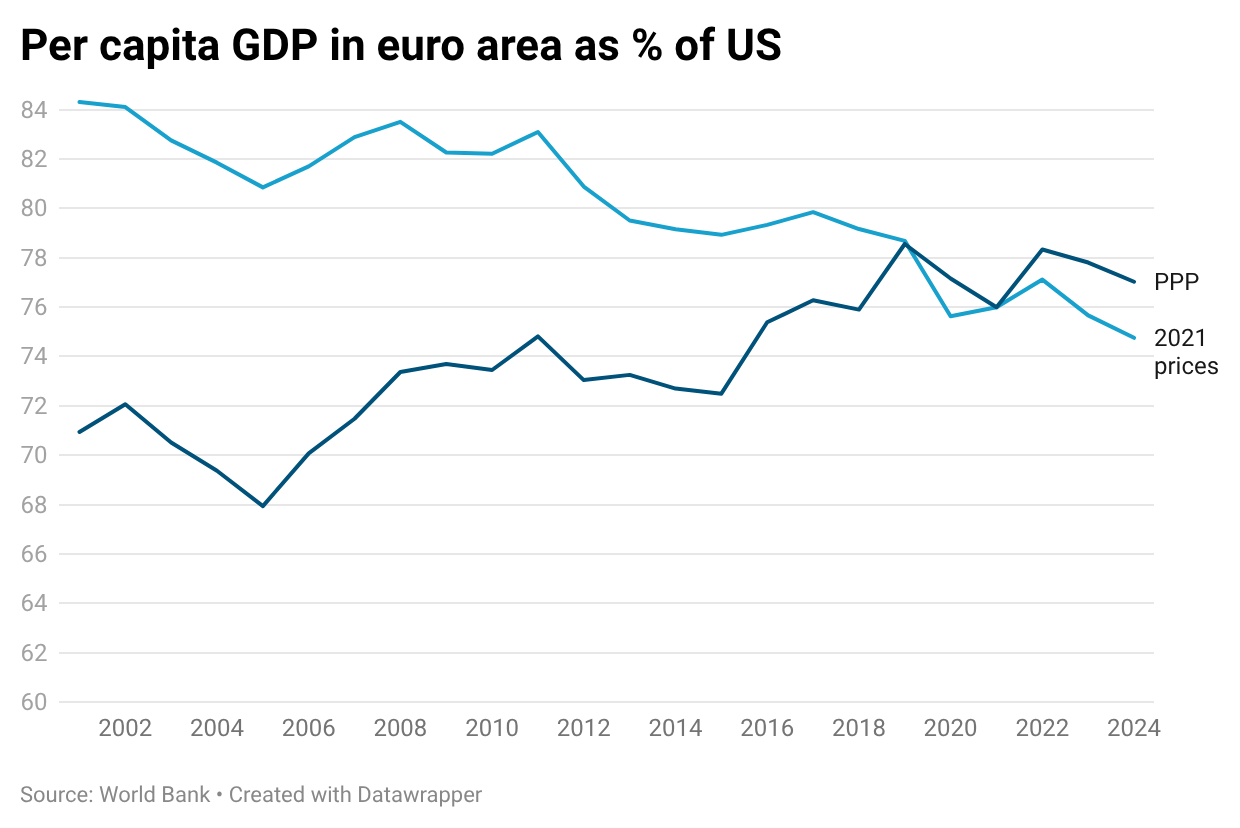
Chart 1
If, however, we simply use prices in each given year, we get the line labeled “PPP,” which shows Europe gaining on the US.
We get a similar picture if we look at GDP per worker-hour. The Paris-based Organization for Economic Cooperation and Development calculates productivity; the data are available on the OECD Data Explorer. Here’s productivity in the euro area relative to productivity in the US, at constant and current prices:
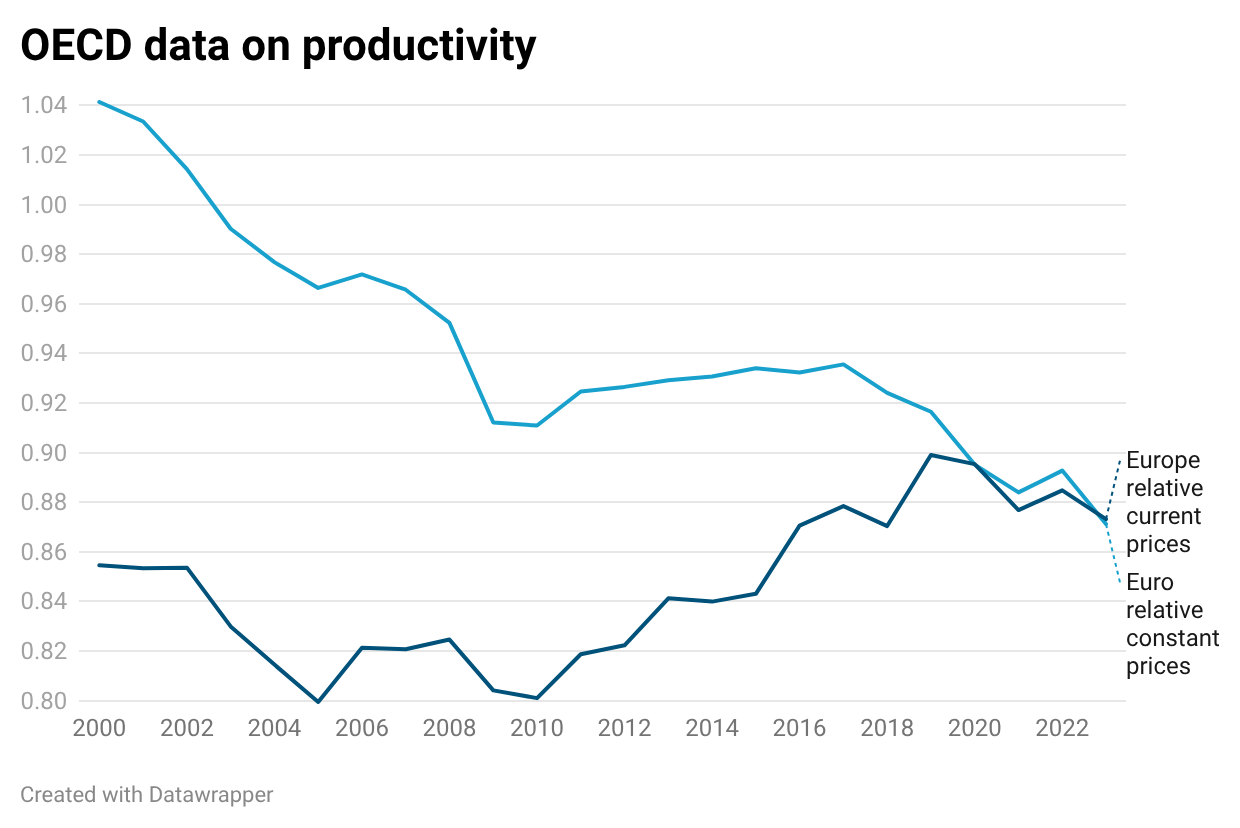
Chart 2
The blue line labeled “Euro relative constant prices” supports the Draghi-Smith story of badly lagging European productivity, with Europe starting well above the US level but falling far behind. But the black line labeled “Europe relative current prices” shows Europe holding its own.
Which of these lines is “right”? If we want to compare economies, surely we want to focus on value at each point in time. That is, we want to look at the black line, which calculates the value of output using the current PPP prices, and not the blue line, which calculates the value of output using a static price level. Looking at Chart 2, the PPP line shows that in 2000 the value of goods and services produced per hour by an average European worker was about 86 percent as much as the value per hour produced by an American worker. In 2024 that percentage was about 87 percent. Thus, if you want to claim that between 2000 and 2024 European productivity fell far behind U.S. productivity, then, as I said earlier, I do not think that word “productivity” means what you think it means.
Yet productivity growth as conventionally measured has in fact been much faster in the US than in Europe. How can this be consistent with the fact that there has been virtually no change in the relative value of goods produced per hour? That’s the apparent US-Europe paradox. What explains it is the fact that the US and European economies produce different mixes of goods – a qualifier that is not picked up in the conventional measures of productivity. And that difference in mixes of goods affects the prices at which productivity measures should be calculated in order to make a meaningfulcomparison across countries.
Explaining the paradox
One key fact about economic growth in all advanced economies in the 21st century is that progress has been highly concentrated in a relatively small sector — the “tech” or information technology (IT) sector.
The Chicago Fed has a recent letter titled “Concentrated growth: The role of the IT sector.” The authors analyze “total factor productivity,” which is related to but somewhat different from labor productivity, but the moral is clear. Starting in the late 1980s, productivity in IT has risen much faster than in the rest of the economy:
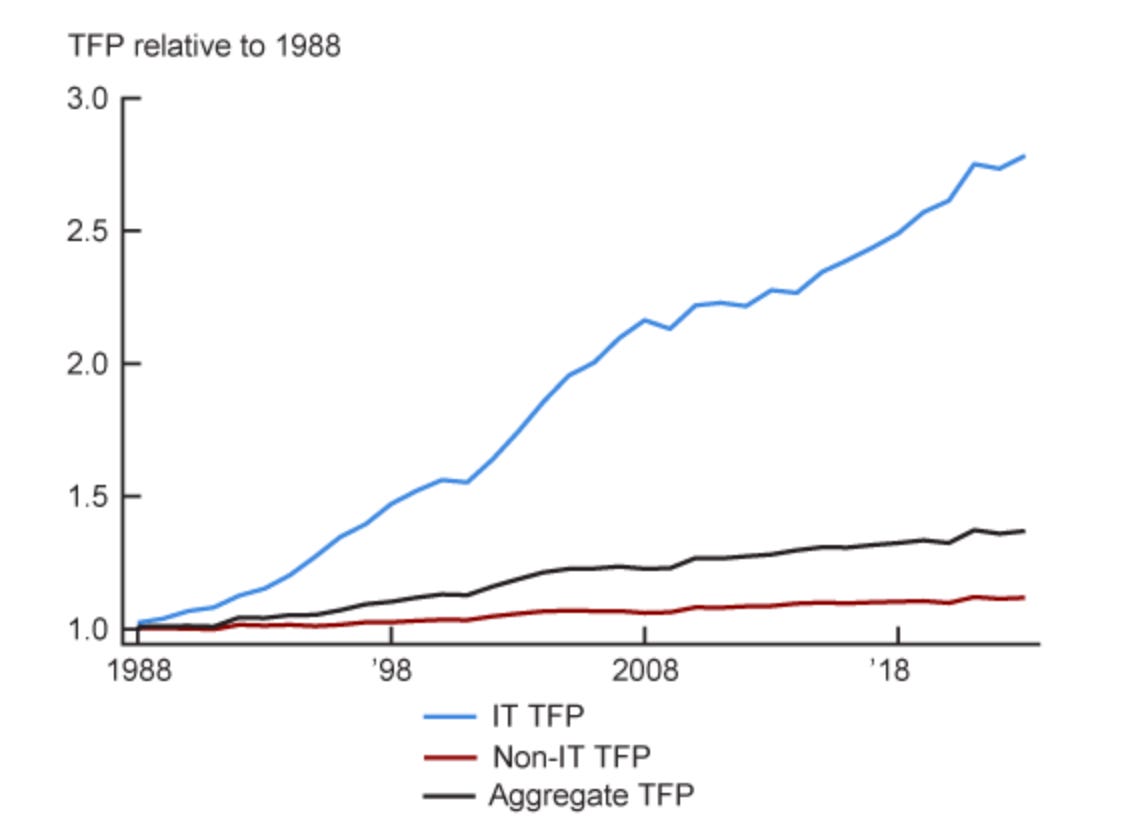
Chart 3 Source
As the authors define it, IT accounts for only 8 percent of US value added — that is, it accounts for only 8% of the net total value generated by production in the U.S., and hence 8 percent of GDP. Yet IT is responsible for almost half of US productivity growth.
This does not mean that half of the benefits of US productivity growth for the last nearly 40 years have accrued to the workers and companies in the IT industry, although that is where the growth was generated. The reason is that the benefits of the vast increase in productivity in the IT sector are passed through to the rest of the economy.
Why haven’t the benefits of IT stayed with IT producers? Because there is effective, if not perfect, competition among American IT firms. As a result, most of the benefits of technological progress in IT are passed on to consumers in the form of lower prices. Correspondingly, workers in the IT sector have seen a huge rise in productivity compared with workers in other sectors, but they haven’t seen a huge rise in their incomes compared with other workers.
A specific example: According to the Bureau of Labor Statistics, output per worker hour in computer manufacturing has risen by a factor of more than 14 since 1988, or about 10 percent per year. As best the BLS can measure it, output per hour in hospitals barely changed over the same period. But we didn’t see a correspondingly huge rise in the wages of computer workers relative to those of doctors and nurses. What happened instead was that computers became much cheaper compared with healthcare, with the value produced by each worker in the two sectors remaining similar.
Why is this relevant to the US-Europe comparison? Because the United States has a dominant position in IT, largely as a result of self-reinforcing network effects (in economics jargon, local external economies.) IT firms have strong incentives to locate in Silicon Valley and a few other tech hubs precisely because so many other IT firms are located there. This is largely for historical reasons: Although this is no longer true, the United States used to be much more technologically sophisticated than other advanced nations. Consequently, most of the world’s big tech hubs are in the US. (Some are now emerging in China, but that’s another story.)
As a result, the US economy as a whole vis-à-vis Europe is effectively in the same position, albeit to a lesser degree, as IT workers versus doctors. We dominate industries in which output per hour rises rapidly over time, so US productivity measured in constant prices rises faster than it does in Europe. But the goods those industries produce get steadily cheaper relative to the goods produced both by non-IT workers in the US and by workers in Europe. So Europe’s relative productivity as measured by the value of goods produced per hour at any point in time — relative output per hour at PPP — has not declined.
And therefore Europe’s purchasing power, and hence its material standard of living, hasn’t declined relative to the US despite Europe’s slower productivity growth as conventionally measured.
I laid out a little formal model of how this works a few days ago. One way to state the key result of that model is to think of two sectors, IT and non-IT, with productivity growth in IT much higher than in non-IT. For the economy as a whole, the rate of conventionally measured productivity growth will be
Overall productivity growth rate = (Productivity growth rate in IT * share of IT in GDP) + (Productivity growth rate in non-IT * share of non-IT in GDP)
Assume that productivity growth is 10 percent a year in IT, zero in non-IT. Also assume that IT is 10 percent of the US economy, zero of the European economy. Then measured productivity growth will be 1 percent a year in the US, 0 in Europe. But because IT progress is passed on to all consumers via lower prices, the relative value of output in the two economies — and hence the relative value of goods produced per person-hour — won’t change.
In short, what we will see is exactly what I am calling the US-Europe paradox, of much faster productivity growth as usually measured in America, but no change in the ratio of value produced per hour.
Not incidentally, differences in productivity growth driven by who happens to host IT clusters isn’t uniquely a US-Europe phenomenon. We can see the same story when comparing regions within the United States. A few months ago I posted the following chart:
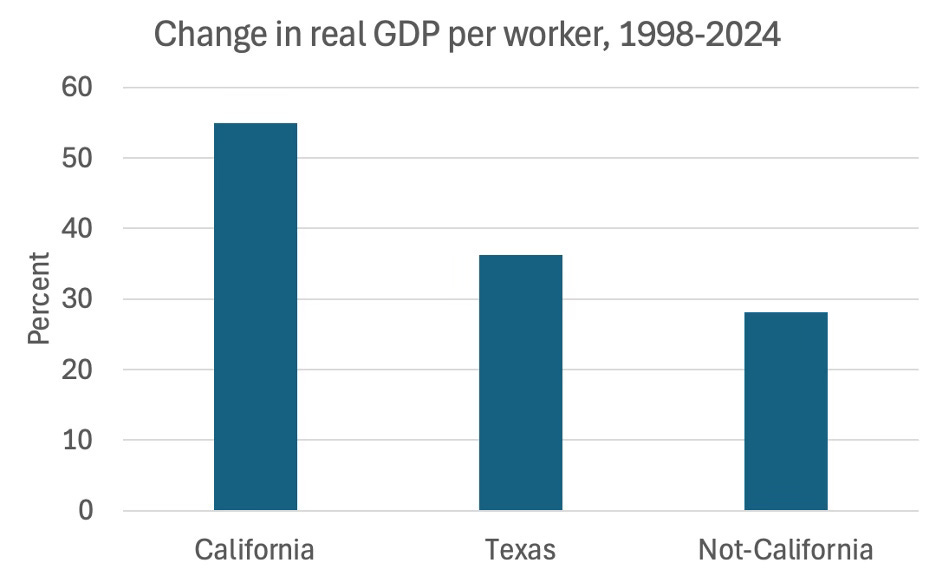
Chart 4 Source: BEA
The difference in measured productivity growth between California and the rest of the US is wider than the difference between the US and Europe, yet that difference isn’t the source of constant agonizing by U.S. states worried that they are falling behind. It doesn’t lead to anguished concerns about the superiority of California’s business culture, or the supposedly anti-business policies of the rest of America.
So should Europeans be as relaxed about faster measured US productivity growth as Texans are about faster California growth? What should Europeans be worried about?
What Europe should and shouldn’t be worried about
It is a fact that the US plays a much bigger role in the global IT industry than Europe does. Few of the biggest tech companies are European. The current race to dominate AI is overwhelmingly a tournament among US companies. Chinese companies taking a different, less computation-heavy approach may be serious contenders, but Europe isn’t in the game.
But does this matter? The big benefits of IT come from applying it, rather than creating it. And as I’ve tried to show, the data show Europe holding its own in the relative value of the goods it produces, indicating that European economies are doing fine when it comes to applying technological advances.
It’s true that in some cases European adoption of new technologies is handicapped by market fragmentation: The single market, as the Draghi report emphasizes, remains incomplete, and that is one reason European productivity, even measured at PPP, is lower than in the US.
But overall Europe has done well at making use of technologies developed elsewhere. And there is no obvious reason to believe that this will change — that, for example, the fact that US companies are leading the development of AI models will make the US economy as a whole better than Europe at making use of AI in the years ahead.
What should worry Europe, instead, are the geopolitical implications of US/Chinese leadership in advanced technology. We used to have a global economic system overseen by a mostly benign and in any case law-abiding hegemon. That system was, however, gradually eroding with the rise of China, and has now taken a drastic hit with America’s abandonment of the rules it largely created.
In this new world, Europe — one of the world’s three great economic superpowers — unfortunately can’t be sure that it will always have access to new technologies developed and produced in the other superpowers. The risk of being cut off from strategically important technologies, once minimal, is now very real.
And that risk, rather than misleading numbers about trends in real GDP per worker hour, is what should concern European policymakers.