








· Based on a talk at Cloud Native Aachen Meetup, April 2026
A Go function in our application kept getting cancelled in production.
The function had a tight timeout. The same code ran fine in our development setups, in our CI and CD pipelines, in every integration test we had. In production it would sometimes blow past the timeout and die with context deadline exceeded.
What made it worse was the state machine library1 we used. When its context got cancelled, it wouldn’t recover on its own. It would crash and hang. We couldn’t reproduce it.
When we talked to users, they reported the CPU utilization looked fine.
It took us weeks to find the cause.
Why average CPU isn’t enough
One of the first things you learn when you work with computers is: when it gets slow, you open the task manager (or the equivalent) and check the CPU. If it’s high, you look at what the process is, and you stop it or you work on it, and you continue.
On Linux servers you have top, htop, whatever, with a lot of other numbers on the screen. At least for me, when I was working with it, I always just looked at the average CPU. Then when you continue with your career, you provision VMs. Maybe on VMware or Hyper-V on-prem. Maybe on AWS, Azure, or Hetzner. You pick a number of vCPUs. If you look closer, it says something like “performance” or “dedicated” as a more expensive option. But at least I myself never really asked why. It was just cheaper without.
The instinct, taught to you by every tool, by every vendor, by every dashboard, fails here.
Every tool shows you average CPU utilization, but none of the tools help you interpret it. None of them tell you that CPU utilization isn’t linear to how much capacity you have. They just show you a percentage. The jump from 80% to 81% CPU utilization adds roughly 20× more wait time than the jump from 10% to 11%2. So even with 20% “headroom” at 80% utilization, latencies have already started climbing3:
| CPU utilization | Wait for a 10 ms request |
|---|---|
| 10% | ~11 ms |
| 80% | ~50 ms |
| 95% | ~200 ms |
M/M/1 queueing model baseline.3

Low utilization: a new request waits about one slot for the current job to finish.

Higher utilization: the same request waits three slots. Reality is more complex of course (random arrivals, variable service times). The M/M/1 model captures the details.
Average CPU is the right metric for one question: are our CPUs utilized? That’s a cost question, and the IT department is right to ask it.
It only works if your workloads can wait. For latency-sensitive ones, higher utilization just means longer waits.
But in our case, our CPU utilization wasn’t even high. What we hit was a Linux kernel feature that Docker and Kubernetes use to enforce per-container limits, called the cgroup, and one of its byproducts: throttling.
There was a resource limit on the container, set to 2000m. We read it as “two CPUs.” The kernel read it as a time budget. When the budget runs out, the container is throttled until the next period begins.
None of the tools we or our customer had in front of us would show this. And that’s why it took us weeks to find the reason for the context deadline exceeded. Every graph said everything was fine. Every user said everything was fine.
It was extremely surprising.
How CFS throttling actually works
Let’s assume you’re running a service in a container that processes HTTP messages, and you’ve set resource limits because that’s what every guide recommends4.
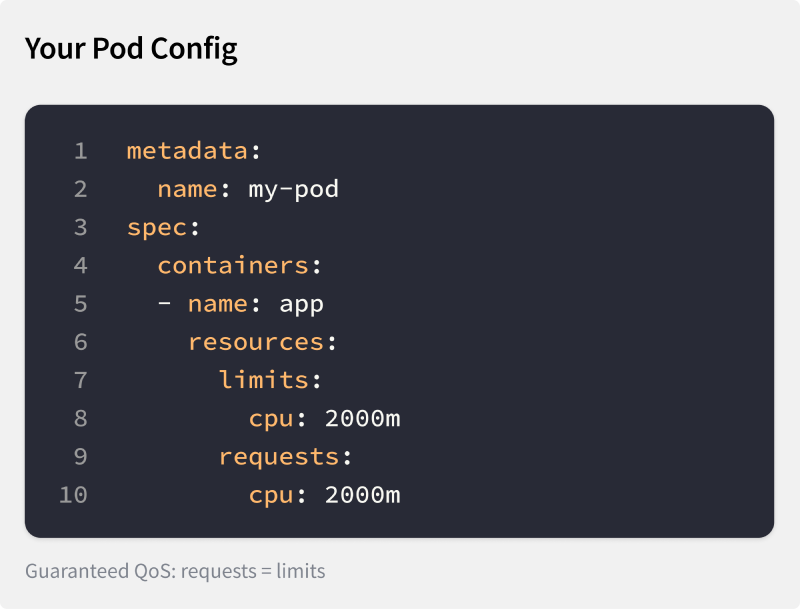
Guaranteed QoS pod config: requests = limits = 2000m
kubectl top pod shows 800 millicores. Your Horizontal Pod Autoscaler (HPA) is configured to scale up at 80% utilization. 800m of a 2000m limit is 40 percent, far from the 80 percent target. Everything looks fine. Right?
No, let’s look closer. There are three numbers that determine what happens here:
- Your resource limit:
2000m - The kernel’s CFS scheduling period:
100 msby default.5 - The host CPUs:
4 cores.

A 100 ms CFS scheduling period. With a 2000m limit, the container gets 200 ms of CPU time per period.
Now, why does it matter how many CPU cores the host has? Because this is where the abstraction leaks. The container can spend that 200 ms across every CPU core available on the node.
Now imagine an HTTP service. A request could come in that is resource intensive and could burst the entire available budget across all 4 cores within 50 ms.

A 50 ms burst across 4 cores exhausts the 200 ms budget.
When a second request arrives, it is throttled and has to wait 50 ms more until the next scheduling period.

The next 50 ms of wall clock are throttled.
Now imagine this repeats. If your load pattern is burst, idle, idle, idle, burst, your p99 latency can go through the roof. Yet every CPU graph still says everything is fine.

Alternating burst-idle-idle-idle-burst pattern: average CPU looks healthy while p99 climbs.
This is what was happening to our Go function. The function ran with a tight timeout and needed to execute within that time frame. Sometimes a different goroutine had already burst through the available budget of that period. The function would starve and die with context deadline exceeded. What made it worse: one of the underlying libraries we used1 would land in a deadlock state if you cancelled the context. But every CPU graph still looked fine.
This isn’t unique to us. Indeed Engineering published the same pattern from production in 2019:6 one application, 4.1 CPUs allocated, usage well below one core, and yet most 100 ms periods throttled.
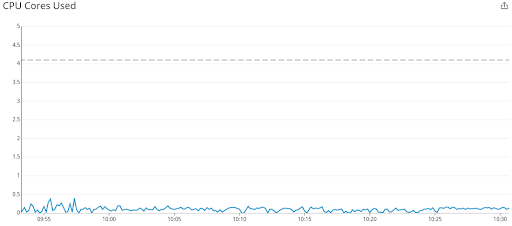
CPU usage stays well below the 4.1 cores allocated. Dave Chiluk, Indeed Engineering (2019)
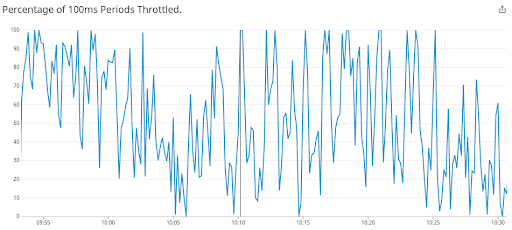
Same workload: most 100 ms periods are throttled. Dave Chiluk, Indeed Engineering (2019)
How to spot it and react to it
We spent weeks looking in the wrong places. The metric we needed had been there all along, in /sys/fs/cgroup/cpu.stat7. The kernel writes nr_throttled (the count of throttle events) and throttled_usec (the total microseconds frozen) for every container with a CPU limit set. Run kubectl exec <pod> -- cat /sys/fs/cgroup/cpu.stat. The output looks like this:
usage_usec 49823715
user_usec 41205893
system_usec 8617822
nr_periods 300
nr_throttled 30
throttled_usec 6142188
nr_bursts 0
burst_usec 0
If those counters are climbing, there’s your answer.
Until the ecosystem catches up, you need to check this yourself. Kube-prometheus ships a CPUThrottlingHigh alert, but most installations have it disabled because it fires too often.8 For containers on dedicated cores, cat /sys/fs/cgroup/cpu.stat is your check. The same directory also exposes cpu.pressure9: a kernel PSI signal that catches saturation even when you’re under quota. For vCPUs in a hypervisor, the cgroup file doesn’t show hypervisor-level throttling. You see that as steal time (%st in top)10. Steal time is what happens when your VM’s hypervisor gives your vCPU’s slot to another tenant: your code is ready to run, but the physical CPU is busy with someone else’s.
That’s the immediate workaround. The longer-term answer is application-side starvation detection. The application asks if a millisecond is still a millisecond. If not, it has been starved of CPU. The cause could be CFS throttling, hypervisor steal time on a virtual CPU, a sibling process inside the same container bursting the shared budget away, or anything else above the application. The application alerts that something is wrong. Ideally it also reacts, for example by descheduling background maintenance work to free CPU for foreground requests.
Redpanda’s reactor calls this a “reactor stall”11, their term for the same starvation. CockroachDB built a feedback controller around Go’s /sched/latencies:seconds histogram, which measures how long goroutines wait between becoming runnable and actually running, treating p99 latency above 1 ms as the trigger to shed background work.12
Go 1.25 made GOMAXPROCS cgroup-aware by default13. This stops a Go application from using more threads than the cgroup allows, reducing the chance of starvation. It doesn’t help when sibling processes in the same container burn the shared budget. Application-side detection remains the universal answer.
Summary
To recap: when you set a resource limit on a Docker container, you don’t limit the number of CPUs it has access to. Instead, you give it a time budget per 100 ms scheduling period. For example, a resource-intensive HTTP request can burst through all node cores at once. And if you’re unlucky, the average CPU graph won’t see it.
What to watch instead:
cgroupthrottling (nr_throttledandthrottled_usecincpu.stat)- kernel PSI (
cpu.pressure) for cgroup-native saturation9 - hypervisor steal time (
%stintop) - application-level starvation signals (in Go,
/sched/latencies:seconds)
Use these together to see what the average CPU graph hides.
Now imagine running an application inside a larger organization, like a traditional enterprise. Say, a large manufacturer with an IT department, partly outsourced, responsible for setting up VMs and cloud resources. You ask for more CPUs because the application isn’t working properly, or for the resource limit to be removed because it’s causing issues. They point at the 40% CPU graph and ask why you need more. They also point at the recommended guides4 for auditors and compliance, which require setting resource limits.
This is why we should get rid of average CPU utilization. Not the limits. Those stay because auditors require them. But we can make working with them easier by exposing more than the average CPU graph. Maybe one signal that says “this container needs more CPU.” The CPU isn’t a production machine you’re optimizing for high utilization. It’s a resource you use to keep your application running smoothly.
If you find yourself in this conversation, send them this article.
looplab. Finite State Machine for Go. v1.0.3, Apache-2.0. When
fsm.Event(ctx, …)is cancelled mid-transition,transitionFunc(fsm.golines 347–354) returns early without resettingf.transitiontonil. The FSM is then permanently stuck: every subsequent event returnsevent X inappropriate because previous transition did not complete. See issue #115 (August 2025, no maintainer response) and the older issue #90. UMH’s FSMv2 rewrite removes this dependency. ↩︎ ↩︎Dan Slimmon. 2016. The most important thing to understand about queues. M/M/1 is a teaching model, not a model of CFS specifically. The 20× figure derives from M/M/1’s marginal slope
dL/dρ = 1/(1−ρ)²: 25.0 at ρ=0.80 vs 1.23 at ρ=0.10. Related: Adrian Cockcroft. 2006. Utilization Is Virtually Useless as a Metric! (CMG) presents the canonical utilization-is-insufficient argument. Brendan Gregg. 2012. The USE method introduces the systems-performance vocabulary. ↩︎Daniel Myers. CS 547 Lecture 12: The M/M/1 Queue. University of Wisconsin–Madison. Numbers computed from the M/M/1 mean response-time formula
R = service_time / (1 − utilization): with 10 ms service, ρ=0.10 → 11 ms, ρ=0.80 → 50 ms, ρ=0.95 → 200 ms. Myers: “Extra capacity is the price of low latencies. To achieve low residence times, you must allow the system to occasionally become idle.” Real web services see 2–3× higher numbers due to non-exponential service-time variance: Kingman’s G/G/1 approximationW_q ≈ ρ/(1−ρ) · (C_a² + C_s²)/2 · servicerecovers M/M/1 when both coefficients of variation are 1, and for typical web workloadsC_s²is 2–4. CFS-throttled containers are strictly worse: the throttling pause acts as a “vacation queue”. Related: Marc Brooker. 2021. Latency Sneaks Up On You. AWS. ↩︎ ↩︎NIST. 2017. SP 800-190: Application Container Security Guide. §2.2 and §4.4.3, mapped to NIST 800-53 SC-6 Resource Availability via Appendix B Table 3. BSI. 2023. IT-Grundschutz SYS.1.6 Containerisierung. A15 Limitierung der Ressourcen pro Container, Standard tier. CIS. 2022. Docker Benchmark v1.6.0. Controls 5.11 (memory) and 5.12 (CPU shares). NSA & CISA. 2022. Kubernetes Hardening Guide v1.2. Recommends setting CPU/memory limits as part of pod-level hardening. IEC. 2013/2019. 62443-3-3 / 4-2: Security for industrial automation and control systems. FR 7 Resource Availability (SR 7.1, SR 7.2, CR 7.2), mechanism-agnostic. Whichever your compliance team reads, the answer is the same: set the limit. ↩︎ ↩︎
Linux Kernel Project. CFS Bandwidth Control. The page documents cgroup v1; the 100 ms default applies identically to cgroup v2’s
cpu.max. ↩︎Dave Chiluk. 2019. Unthrottled: Fixing CPU Limits in the Cloud. Indeed Engineering. Chiluk subsequently authored the Linux 5.4 CFS bandwidth-control fix. ↩︎
Linux Kernel Documentation. Control Group v2: CPU Interface Files. Field names and semantics for
cpu.statin the unified hierarchy. ↩︎The kube-prometheus
CPUThrottlingHighalert ships with severityinfo, suppressed by default Alertmanager inhibition rules when other alerts fire in the same namespace. The maintainers downgraded its severity in July 2020 after concluding that “in many cases this alert is not actionable (apart from silencing it)” (PR #453, Krupa et al., merged 1 July 2020). The driving issue #108 (Christopher Beneke, 2018) accumulated 119 thumbs-up reactions and went six years without a fix on the merits before being closed as “not planned” by a stale bot in December 2024. Red Hat removed the alert outright in OpenShift 4.6.0 (Bugzilla 1843346, RHBA-2020:4196, 27 October 2020). ↩︎Linux Kernel Documentation. PSI: Pressure Stall Information. Added to Linux 4.20 (December 2018) by Johannes Weiner at Facebook. For a cgroup,
/sys/fs/cgroup/<container>/cpu.pressurereports the percentage of wall-clock time during which at least one task was runnable but not running, a direct saturation signal at the cgroup boundary. (The file exposes bothsomeandfulllines; the description above issome, the actionable line for CPU.) Complementscpu.stat’snr_throttled(which only fires on active kernel pause): PSI catches saturation from contention with other workloads on the host, not just CFS quota exhaustion. ↩︎ ↩︎procps-ng. top(1): Linux User’s Manual. Defines
%stas “time stolen from this vm by the hypervisor.” ↩︎Seastar (the framework Redpanda is built on) emits a stack trace when a reactor task runs without yielding the CPU for longer than
blocked_reactor_notify_ms(reactor.cc, default 25 ms). Redpanda raised its runtime default to 200 ms via redpanda#5996. ↩︎CockroachDB Engineering Blog. Rubbing control theory on the Go scheduler. The Pacer / ElasticHandle controller treats Go’s
/sched/latencies:secondsp99 above1 msas the trigger to throttle background work (backups, range-feed catchup, compactions); foreground KV/SQL traffic is not affected. CockroachDB also patches the Go runtime for per-goroutine on-CPU time viagrunning.Time()(golang/go#41554 pending since 2020). ↩︎The Go Authors. 2025. Go 1.25 Release Notes and Container-aware GOMAXPROCS. On Linux, if the cgroup CPU bandwidth limit is lower than the number of logical CPUs available,
GOMAXPROCSdefaults to the lower limit and updates periodically if limits change. Auto-disabled ifGOMAXPROCSis set manually via the env var orruntime.GOMAXPROCS;runtime.SetDefaultGOMAXPROCSre-enables the default. ↩︎