







One of the more powerful features of the CUDA Profiling Tools Interface (CUPTI) is support for Program Counter (PC) sampling. This lets developers of CUDA programs see where their code is spending time down to the instruction level. Building upon our support for kernel timing information, we've added the ability for our low-overhead continuous profiler to send PC sample data to our backend where it can be analyzed using the Polar Signals UI or run through your favorite LLM model using our MCP support. PC sampling is typically used in developer-oriented workflows with tools like NVidia NSight and Triton's Proton profiler, but with our approach to minimizing overhead it's actually possible to use it in production! But first, what is PC sampling and how does it work?
If you're just interested in trying this, this work is available in the v0.48.0 release of the open source Parca Agent. Check out this blog post on how to try it out on Kubernetes.
PC Sampling was introduced in the Maxwell architecture and had a simple API that piggy-backed on the CUPTI activity API. When the Volta architecture came out a new dedicated API for PC sampling was introduced. PC sampling works via dedicated hardware per-warp, on every sampling tick the state of each warp is recorded. The sampling interval is based on a power of 2 sampling factor where the hardware samples every 2^SAMPLING_FACTOR GPU cycles. The sampling factor is constrained to the range 5 to 31, so we could be taking a sample every 32 cycles (2^5) or only once every couple billion (2^31), tens of millions of samples a second at one extreme, barely one a second at the other. Quite the range! For our purposes we found 20 to be a good default sampling factor but of course it's configurable. That's a raw hardware rate of over 2k samples/s which may seem high for a "low-overhead" continuous profiler but depending on your application and GPU utilization the amount of data can be much less. That's because PC sampling records a PC offset/stall reason "bucket" and every time a sample is taken it's just incrementing the counter on that bucket. So no call stacks, no timestamps, just a pc offset / stall-reason pair.
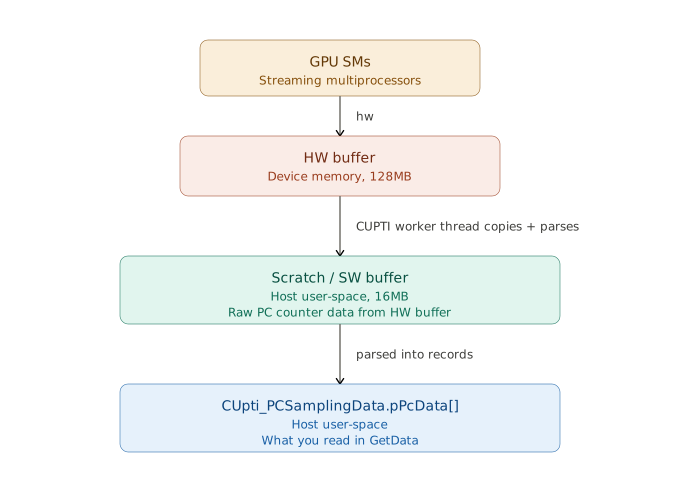
Basically the pc/stall-reason information is collected in hardware, counters go up, and then periodically this information is flushed from the hardware buffers out to software buffers (all low-level stuff handled by CUPTI and the driver). We can configure this buffer size but the real trick is getting this information out of the buffer and into our CUPTI shim library. If you didn't commit the information from our prior blog posts to memory the way it works is your CUDA application is run with an env var (CUDA_INJECTION64_PATH) set to our shim library and it handles initializing CUPTI and listening for information about GPU happenings.
For PC sampling it works like this:
The real power of PC sampling is that it's not just recording the PC, it's the stall reason that comes with it, meaning that if the instruction at that cycle is (or is not) being issued the reason will be recorded. It's like if you had a CPU profiler that told you, down to the instruction level, if the instruction was retired normally or it had to wait on a pipeline stall, a cache miss or coherency delays. In GPU land there are a multitude of stall reasons but the main ones are "long scoreboard" memory latency dependencies (waiting on loads) or "short scoreboard" latency waiting on shared memory or specialized functional unit results. But there can also be queuing stalls (waiting for busy functional units to open up), synchronization barriers/memory fences etc. Similar to a CPU just a bigger menu of options.
The Polar Signals profiler takes the guess work out of understanding these stall reasons by including a brief explanation and linking to NVIDIA documentation for deeper understanding (see screenshot below).
A GB10 chip like the DGX Spark has 48 streaming multiprocessors (SMs) with 48 warps/SM which means it's sampling 2304 warps in parallel! Many levers are needed to deal with that much information! We've already talked about the sampling factor and how data is rolled up into PC/stall-reason pairs. Another lever we have is the PC sampling collection mode. PC sampling can be done in a "continuous" mode or a "kernel-serialized" mode. You'd think a continuous profiler would want to use continuous mode, but continuous mode makes attribution of samples to a particular kernel launch impossible: a GPU handles multiple kernel launches in parallel and schedules them as aggressively as it can, so you could end up with two kernel launches that share some of the same underlying CUDA binaries (cubins) both contributing to the same pc/stall-reason pairs. To take the guess work out of this we use kernel-serialized mode, which as you probably surmised, kills performance hard. So how do we make a continuous production mode profiler when we're killing performance? By sampling the samples!
Turns out you can enable/disable PC sampling pretty quickly so we have a dynamic algorithm that periodically turns on PC sampling for short intervals (~50ms) and then turns it off again where the delay between is tuned to get a target number of PC/stall reason pairs per second. By default we target 100/s (again also configurable) which seems to work well in practice. For simple GPU workloads there may be very little time between intervals, and for intense PyTorch training workloads there may be many seconds between sampling intervals.
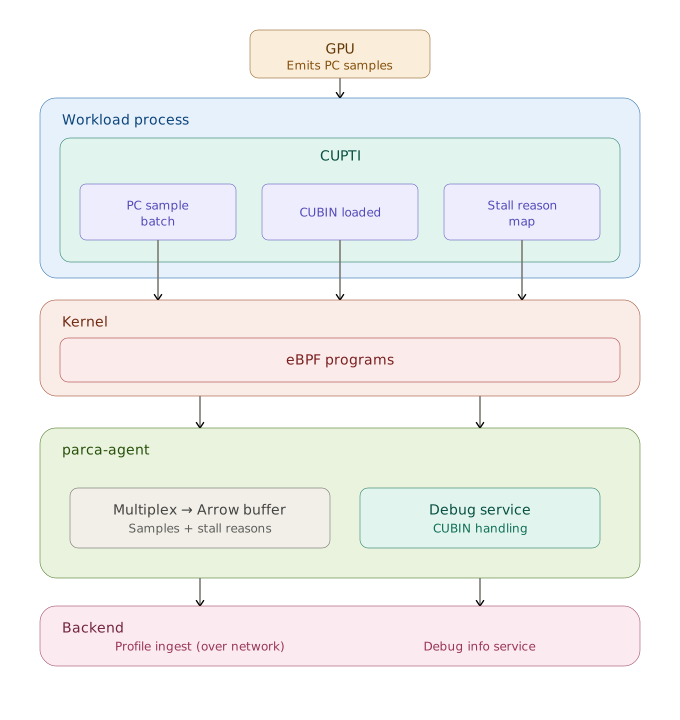
So we know how to get the data off the hardware and into our shim library, but how do we efficiently get it over the network back to the collection service? Simple, we piggy back on our existing work and utilize USDT probes to allow our agent to place hooks into the shim library and extract all the goods.
Here are the new probes we added to support PC sampling:
And here's how everything is wired together:
There's a subtle problem hiding in that probe table. A pc_sample_batch record is useless on its own, to make sense of it you need the stall_reason_map (to decode the stall indices), the cubin_loaded bytes (to turn a PC offset back into source), and the gpu_config (to convert samples to time). But those are one-shot events. The stall reason map is emitted once at startup, and cubins fire as they're loaded, often long before anyone is watching.
Remember there's no coordination between the shim and the agent. The shim just fires these probes and does very little processing on the information other than to batch things up conveniently (you wouldn't want a BPF probe to fire on every single PC sample). This is great from a division-of-labor perspective, but it makes things tricky. What if the agent attaches mid-workload?
Typically the Polar Signals agent will be running 24/7 like a fly on the wall but customers will sometimes change label configs and restart for upgrades, and it's also the case that some of these PyTorch training workloads can run for a very long time (as we saw in my last blog). So we think it's important to handle this case.
Without going into excruciating detail basically what we do is listen and record the USDT semaphore counts on our probes which allows us to know when clients attach/detach from the probes and when this occurs we re-send cached stall reason maps and CUBIN information.
The agent installs BPF programs on all of these probes, feeding the stream of events into a BPF ring buffer for processing. The one real trick it has to play is caching kernel launches: PC samples show up after the fact tagged only with a correlation ID, so the agent keeps a cache of recent launches and matches each batch of samples back to the application stack that launched that kernel. We take the PC and stall reason and attach them as "labels" on the stack sample that can be grouped or filtered:

From there the samples are packed into Apache Arrow records for efficient transmission to the server. One nice property that falls out of how PC sampling works: because the data is already reported as counts, each pc/stall-reason bucket carries the number of times it was sampled, meaning there's nothing to deduplicate. The agent and backend can simply add buckets together as they arrive.
The last piece is symbolization. Rather than resolve instructions to source on the host, which would mean burning cycles inside the profiled process, the agent uploads each cubin to our debuginfo service and we symbolize on the backend. The wrinkle is that cubins don't ship with standard DWARF debug info mapping SASS instructions back to source lines, so we can't lean on the usual symbolization tooling. Instead we crack open the cubin, disassemble it, and build our own address-to-source tables to turn a pc offset back into a function, file, and line. Just be sure to include the -lineinfo flag on your nvcc command line (seen screenshot above for an example).
PC sampling has traditionally been confined to interactive, developer-time tools like NSight and Proton because of its overhead. By sampling the samples, replaying metadata so a late-attaching agent never misses the context it needs, and pushing symbolization to the backend, we've gotten it down to something you can leave running in production. The result is instruction-level GPU insight, right down to why a warp stalled, alongside the call stacks and kernel timings you already get from the Polar Signals continuous profiler.
You can get started with our free 14-Day trial today. If you're on Kubernetes, check out how to get started within just a few minutes without modifying your workload.