





Posted: 2025-08-17
Updated: 2025-09-17
TL;DR: Don’t base your FPS calculations on a specific number of frames. Instead, maintain a rolling window of frames that happened during the last second. Use precise timers. Read on for more details.
I mentioned this in my post about the GMTK Game Jam 2025, but I wanted to cover it in detail.
Let’s say you want to display an FPS counter in your game, which you’ve seen many games do. First, let’s ask ourselves what it is that we want this piece of data to show us. We want to know how the game performs and whether it is, within most recent history, hitting the target of 30 or 60 FPS.
Sure, but then why don’t we just measure the amount of time it takes to process each frame? For 60 FPS, each frame needs to be prepared and rendered in less than 16.67 milliseconds. If we are consistently below that, we’re good. Well, FPS is a metric commonly shown to players and it’s widely accepted in the industry as a proxy for performance.
So, what we want to know is how quickly the game is able to produce new frames, but we’re going to display it as this proxy measure. And that is fine, so how do we do it?
If you search online for how to implement an FPS counter, you’ll probably run into one of the following methods, which I don’t think are the right approach.
The pseudo-code would look like this:
    float fps = 0;
    Time prev = Time::current();

    while (true) {
        // handle input

        // update game state

        // render game and show FPS in UI

        Time curr = Time::current();

        fps = Duration::seconds(1) / (curr - prev);

        prev = curr;
    }
(You may disagree with me putting the calculation after the render call; feel free to put it before if you wish. I prefer it this way since we’re cutting each measurement along the borders of the loop.)
If we go back to thinking in terms of frame processing times, what is this telling us? It tells us the time it took to produce the latest frame. And that may be a useful thing to know. But if we care about the time taken for each individual frame, why not log all of them in a file for future analysis? If a single frame is really fast or really slow, the FPS counter will indicate that for a single frame, than come back to a normal value, and we most likely won’t notice.
FPS, by its name, is an aggregate measure, so we should be aggregating across multiple frames.
This method tracks the processing times for several most recent frames (eg. 5 or 10 of them) and displays an FPS based on the rolling average. One way to pseudo-code this would be:
    const int windowFrames = ...;

    float fps = 0;
    Queue<Duration> processingTimes;
    Time prev = Time::current();

    while (true) {
        // handle input

        // update game state

        // render game and show FPS in UI

        Time curr = Time::current();

        if (processingTimes.size() == windowFrames) processingTimes.pop();
        processingTimes.push(curr - prev);

        fps = Duration::seconds(1) / averageVal(processingTimes);

        prev = curr;
    }
We want to measure FPS based on the most recent performance history. What is the time length of this history? It depends on how quickly the frames are produced. So, the history size along which we measure depends on the values that are being measured!
Imagine what an FPS graph would look like, the x-axis being time and the y-axis being FPS. Well, it would be one misleading graph, as each value on the y-axis would have a dependency on itself since its own value extends how far back along the x-axis it looks.
Here’s an example of it where 3 frames were slower than usual (red) and 3 were faster than usual (green), with a window of 5 frames:
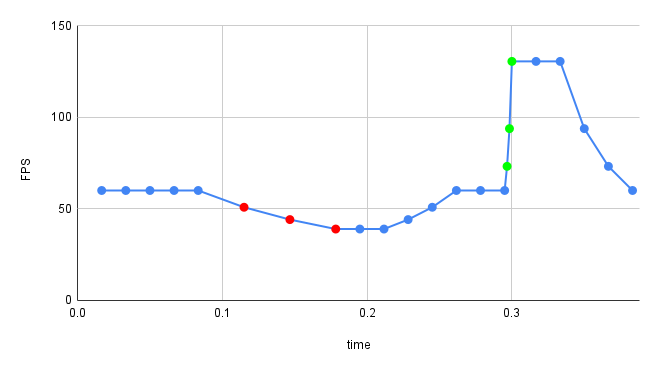
Notice how much smoother the graph is when frames are slow compared to when they are processed quickly. This graph is inconsistent along the time period it’s displaying. That’s why history needs to have a fixed duration.
Another way to measure FPS you may find online is:
    float fps = 0;
    int frames = 0;
    Time prev = Time::current();

    while (true) {
        // handle input

        // update game state

        // render game and show FPS in UI

        Time curr = Time::current();

        if (prev + Duration::seconds(1) < curr) {
            fps = frames;
            frames = 0;

            while (prev + Duration::seconds(1) < curr) {
                prev += Duration::seconds(1);
            }
        }

        ++frames;
    }
(I’ve also seen examples where, in the if body, fps is smoothed out over consecutive values of frames.)
What does this show us? It shows us how many frames get rendered each second, but it’s only updated each second. And this is mostly correct for what it’s supposed to show.
On one hand, we may want to limit how often the FPS display in the UI changes to make it easier to read, since it wouldn’t be showing a different number each frame. On the other hand, you may find once per second updates to be too far apart.
Now that we’ve seen a few implementations, let’s see how we can do it better. But first, let’s talk about real-time monitoring.
If you’re coming from the webdev world, this should be familiar to you. Let’s say you have a service or an application that does something and you want to monitor what is happening to it. A very common example is measuring the number of user HTTP requests. Now, you could create a graph that shows the number of requests currently being processed, but that is a value that would jump up and down wildly and the graph would be hard to read. Or, if the service is not constantly receiving requests, the values would a lot of the time be flat zeroes.
Instead, you want to smooth the fluctuations out by looking at a window of time instead of a single point. Each point on the graph would be the value of a function (such as average, or count, or max) applied to all recorded events within the time window ending at that point’s timestamp. In the example of an HTTP requests graph, the x-axis would be time and the y-axis would be the number of requests; each point’s y-axis value would be the count of recorded events (an event being an HTTP request reaching the server) during the last time window right-aligned to the x-axis value of the point.
Here’s an example of such a graph. Gray dots indicate time points where a request happened.
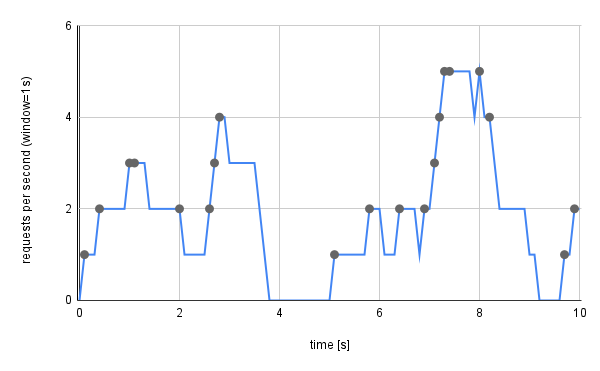
When a request is received, the graph goes up and stays up until “window” amount of time has passed since that request.
Choosing the length of the window is a trade-off: shorter windows are better at tracking rapid changes, while longer windows are good at showing long-term trends.
Coming back to our case of implementing an FPS counter, an “event” is the completion of a single frame. For the time window, it makes a lot of sense to make it 1 second long, though that’s not mandatory. Yes, FPS is the number of frames per second, but you can divide the value you read by the window size. Eg. if the window is 2 seconds, simply divide the number of frames in the window by 2 to get the FPS. These two time durations are separate properties of the counter.
With all of that out of the way, the code is actually simple:
    const Duration window = ...;

    float fps = 0;
    Queue<Time> frameTimestamps;

    while (true) {
        // handle input

        // update game state

        // render game and show FPS in UI

        Time curr = Time::current();

        frameTimestamps.push(curr);
        while (frameTimestamps.next() + window < curr) frameTimestamps.pop();

        fps = frameTimestamps.size() * Duration::seconds(1) / window;
    }
A queue stores timestamps of the most recent frame completions. On each update, all frames that are further in the past than a single window are discarded.
If you wanted to, you could introduce another Time variable and use it to limit how often the FPS display updates to make it easier to read. The frequency at which you update the display does not need to correspond to rolling window’s length.
The way it’s implemented here means that, during the first window, reported FPS will be small and will gradually pick up as the queue gathers timestamps. You can fix this if you want, but personally, I don’t mind if just the first second is a bit off.
The previous method is fine, but there is a small tweak we could do:
struct FrameEvent {
    Time timestamp;
    Duration processingTime;
};

// ...

    const Duration window = ...;

    float fps = 0;
    Queue<FrameEvent> frameEvents;
    Time prev = Time::current();

    while (true) {
        // handle input

        // update game state

        // render game and show FPS in UI

        Time curr = Time::current();

        frameEvents.push(FrameEvent{curr, curr - prev});
        while (frameEvents.next().timestamp + window < curr) frameEvents.pop();

        fps = Duration::seconds(1) / averageProcessingTime(frameEvents);

        prev = curr;
    }
Here, we track the processing times for each frame in the rolling window. For FPS, we first calculate the average processing time, then calculate the FPS value from that.
This is nice because you could use it internally to display average frame processing times instead of FPS. And it can easily be extended to track the slowest frame in the window, or the standard deviation in processing times, etc.
It is important to use a timer with sufficient precision. If you are using SDL, I suggest using SDL_GetPerformanceCounter() and SDL_GetPerformanceFrequency(). If you are not using SDL, but are using C++, std::chrono::high_resolution_clock should be a good option.
If you don’t have access to a queue implementation or don’t want memory allocators sporadically triggering, you can implement a circular buffer with limited capacity. Be aware of the edge case when the buffer fills up - you could just give it a high enough capacity that you don’t expect to reach in your game. If it does fill up, remove the oldest frame and add the latest one. The implementation in method 5 will calculate the FPS based on processing times of frames in the buffer. The time window may be shorter than configured, but it is still correct as an FPS estimate.
I hope this clears up how to track your game’s FPS and may your frame rates stay high!
Some time after posting this, I thought of a way to improve on method 3 by having the FPS display update multiple times per second (eg. twice per second).
    Uint64 horizon = Time::current();
    size_t cntPrev0 = 0, cntPrev1 = 0, cntNext = 0;

    while (true) {
        // handle input

        // update game state

        // render game and show FPS in UI

        Time curr = Time::current();

        while (horizon + Duration::seconds(0.5) < curr) {
            horizon += Duration::seconds(0.5);

            cntPrev0 = cntPrev1;
            cntPrev1 = cntNext;
            cntNext = 0;
        }

        ++cntNext;

        // FPS to display is cntPrev0 + cntPrev1
    }
The idea is to track the number of frames, but split in three counters accounting for half a second each. What we display in the UI is the number of frames that happened within the first two (“older”) counters.
As new frames are rendered, we increment the third (ie. “newest”) counter. Every half seconds, we shift the counters to the “left” and reset the third counter.
Here’s an ASCII illustration of one point in time:
     cntPrev0  cntPrev1  cntNext
         |         |         |
         V         V         V
    [  0.5s  ][  0.5s  ][  0.5s  ]
------------------------|------>
                        ^      ^
                        |      |
                     horizon   |
                            present
When the “present” moves forward further than half a second from the horizon, we shift to the “left”:
               cntPrev0  cntPrev1  cntNext
                   |         |         |
                   V         V         V
              [  0.5s  ][  0.5s  ][  0.5s  ]
----------------------------------|-->
                                  ^  ^
                                  |  |
                             horizon |
                                  present
This method is good when this is exactly what you need and don’t plan to change it much. It consumes less memory than methods using a queue.
https://www.growingwiththeweb.com/2017/12/fast-simple-js-fps-counter.html
https://stackoverflow.com/questions/28530798/how-to-make-a-basic-fps-counter
https://milvus.io/ai-quick-reference/what-is-a-rolling-window-in-time-series-analysis
https://cloud.google.com/monitoring/alerts/concepts-indepth#duration
https://docs.preset.io/docs/rolling-functions
https://pandas.pydata.org/docs/reference/api/pandas.DataFrame.rolling.html
https://wiki.libsdl.org/SDL3/SDL_GetPerformanceCounter
https://wiki.libsdl.org/SDL3/SDL_GetPerformanceFrequency
https://en.cppreference.com/w/cpp/chrono/high_resolution_clock.html
此内容由惯性聚合(RSS阅读器)自动聚合整理,仅供阅读参考。 原文来自 — 版权归原作者所有。