


Racheal Ou
Metric exploration often begins with a simple question, but answering that question can require deep familiarity with metric names, tag structures, and query syntax. Experienced users spend time refining queries through trial and error, and newer users struggle to get started. As a result, teams face delays in troubleshooting and analysis. Valuable observability data, including metrics that are difficult to discover and query, also goes underused.
Natural Language Queries (NLQ) for Datadog metrics changes how users interact with their data. Instead of constructing queries manually, you can describe what you want in plain language and immediately generate a working query and visualization. With NLQ, teams can move from question to insight more quickly and make metrics easier to access for a broader set of users.
In this post, we’ll show how NLQ helps you:
Explore metrics by using plain English
Automatically translate questions into metric queries
Refine and iterate on queries without rebuilding them
NLQ introduces a question-first workflow that enables you to examine metrics without having prior knowledge of Datadog’s query language. You can access NLQ directly from the Metrics Explorer, dashboards, notebook widgets, and Quick Graphs editor. From any of these entry points, you can type a request such as “Show average CPU usage per host” or “What’s the max number of failed checkouts in production, broken down by availability zone?” and immediately see a result.
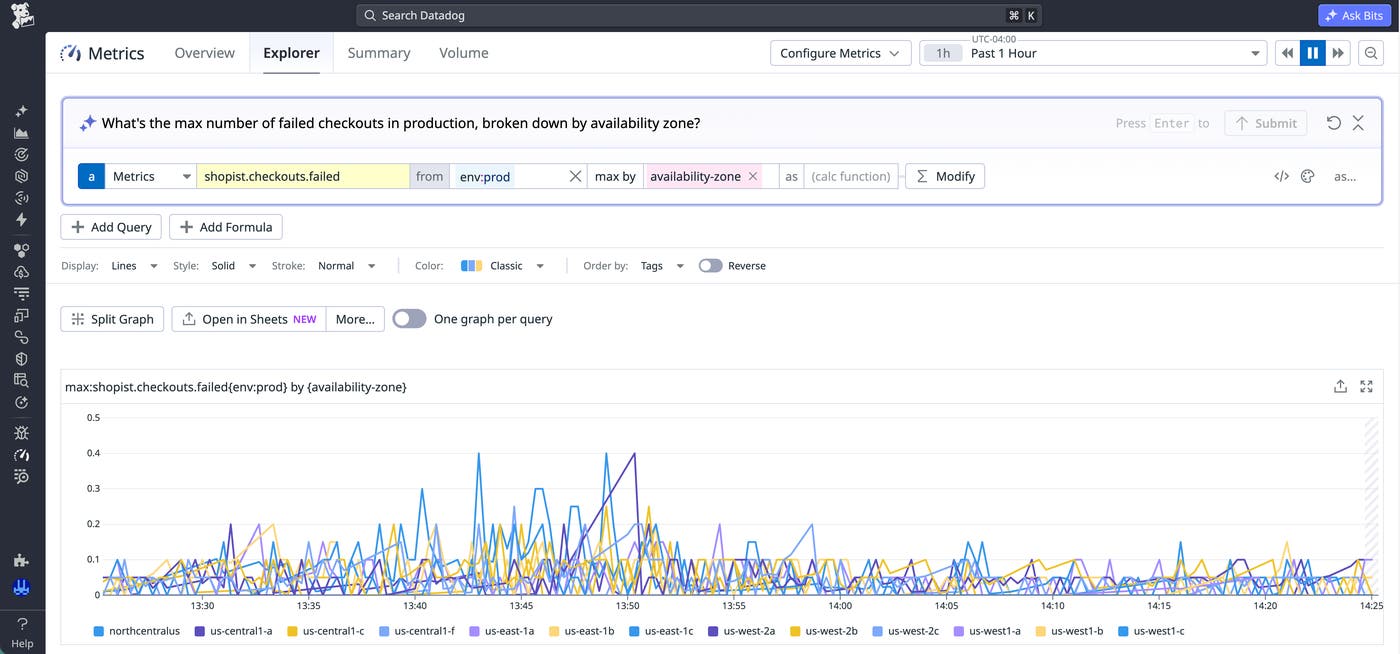
NLQ shifts the focus from building queries to asking questions. Rather than recalling metric names or memorizing tag keys, you can describe the outcome that you want to achieve. The intuitive workflow reduces the learning curve for new users and enables cross-functional teams to gain insights without relying on experts to construct queries or provide institutional knowledge.
After you submit a request, NLQ uses AI to convert your plain-language input into a fully structured Datadog query. The system identifies the relevant metric, applies filters such as environment or service, selects the appropriate aggregation, and determines how to group the data.
For example, the request “Show average CPU usage per host” results in a query that includes the correct metric, computes the average, and groups results by host. NLQ performs these steps by using metric metadata, tags, and indexed context within your environment, including custom metrics that follow your tagging and naming conventions.
You no longer need to troubleshoot syntax issues or guess which tags to apply. NLQ returns a valid, immediately usable query that you can add to dashboards, monitors, or notebooks. With NLQ handling query construction automatically, teams can spend less time building queries and more time gaining insights.
Metric exploration is rarely a one-step process. After generating an initial result, you often need to adjust filters, time ranges, or groupings to answer follow-up questions. NLQ supports this iterative workflow by enabling you to refine queries by using either natural language or the query editor.
For example, you might follow an initial request with a phrase such as “Group by region,” “Only show production,” or “Last 30 days instead.” NLQ updates the existing query to reflect those changes without requiring you to rebuild it from scratch.
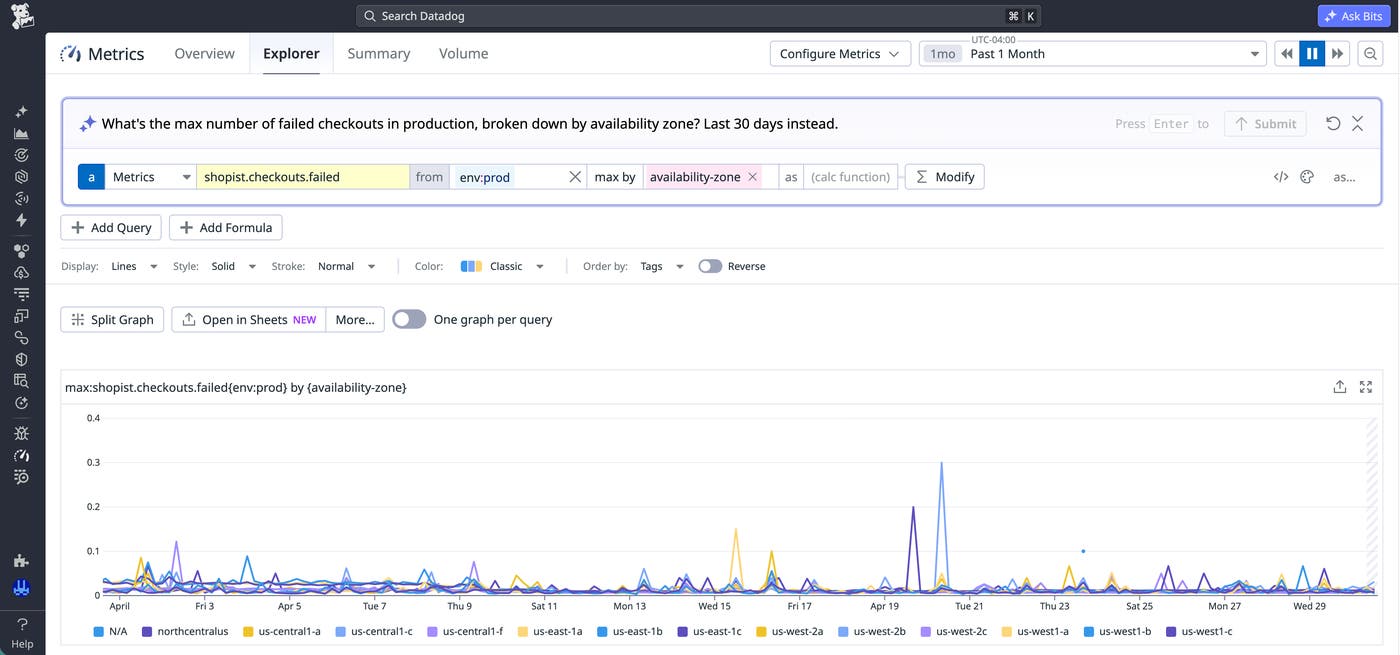
At the same time, you can inspect and edit the generated query directly in the editor. The editable query helps experienced users fine-tune results and shows newer users how queries are structured.
Natural Language Queries makes Datadog metrics more accessible by enabling users to describe what they want and receive a complete query in response. By combining a question-first experience with automatic query construction and iterative refinement, NLQ helps teams gain insights faster. To learn more, read the metrics NLQ documentation.
If you’re new to Datadog, you can sign up for a 14-day free trial to get started exploring your metrics with NLQ.
此内容由惯性聚合(RSS阅读器)自动聚合整理,仅供阅读参考。 原文来自 — 版权归原作者所有。