


In a previous blog post, we explained how containers’ CPU and memory requests can affect how they are scheduled. We also introduced some of the effects CPU and memory limits can have on applications, assuming that CPU limits were enforced by the Completely Fair Scheduler (CFS) quota.
In this post, we are going to dive a bit deeper into CPU and share some general recommendations for specifying CPU requests and limits. We will also explore the differences between using the default policy (CFS quota) and the CPU Manager’s static policy. We are not going to consider memory resources in this post.
Note: Node allocation and usage graphs represent a percentage of the CPU time usage, not a timeline. For simplicity, in the allocation graphs, we assume that there are no CPU reservations for Kubernetes and system components (kubelet, kube-proxy, the container runtime, etc.), unless explicitly stated. For the purpose of this post, we also assume that 1 core is equal to 1 vCPU. Many cloud instances run in hyperthreading mode, meaning that 1 core is equal to 2 vCPU.
The CPU Manager is a feature that was introduced in beta in Kubernetes v1.10 and moved to stable in v1.26. This feature allows you to use Linux CPUSets instead of the CFS to assign CPUs to workloads.
By default, the CPU Manager policy is set to none, which means that the Linux CFS and CFS quota are responsible for assigning and limiting CPU resources in Kubernetes. Alternatively, you can set the CPU Manager policy to static to give containers exclusive access to specific cores. The mode that will best suit your requirements depends on the nature of your workload. These two modes differ greatly in their approaches to CPU allocation and limiting, so we will be covering both separately in this post.
Before going any further, it is important to clarify that Kubernetes considers CPU to be a compressible resource. This means that even if a node is suffering from CPU pressure, the kubelet won’t evict pods, regardless of their Quality of Service class—but some (or all) of the containers on that node will be throttled. Later in this post, we will walk through metrics that can be helpful for troubleshooting application performance issues that may be related to throttling.
none)In this section, we will cover how containers’ CPU requests and limits correlate to how the CFS assigns CPU time to those containers in the default CPU Manager policy. We will also explore how you can reduce the risk of throttling and use metrics to debug potential CPU-related application issues.
The Kubernetes scheduler takes each container’s CPU request into consideration when placing pods on specific nodes. This was explained in detail in a previous post, so we won’t be covering it again here.
In the case of node pressure, the CFS uses CPU requests to proportionally assign CPU time to containers. To illustrate how this works, let’s walk through an example. For the purpose of this example, we will assume that none of our containers have set CPU limits, so there isn’t a ceiling on how much CPU they can use, as long as there is still node capacity.
Let’s say we have a single node with 1 CPU core and three pods (each of which have one container and one thread) that are requesting 200, 400, and 200 millicores (m) of CPU, respectively. The scheduler is able to place them all on the node because the sum of requests is less than 1 CPU core:

For any time slice of 100 ms, pod 1 is guaranteed to have 20 ms of CPU time, pod 2 is guaranteed to have 40 ms of CPU time, and pod 3 is guaranteed to have 20 ms of CPU time. But if the pods are not using these CPU cycles, these numbers don’t mean anything—any pod scheduled on the node could use them. For example, in a time slice of 100 ms, this scenario is possible:

In the example above, pod 1 is idle, and pods 2 and 3 are able to use more CPU time than what was guaranteed to them because the node still had spare CPU cycles.
But when there is contention, CFS uses CPU requests to allocate CPU shares proportionally to requests. Continuing with our example, let’s say that in the next period of 100 ms, the three pods need more CPU than the node’s CPU availability. In each time slice of 100 ms, CPU cycles will be divided in a 1:2:1 proportion (because pod 1 requested 200m; pod 2, 400m; and pod 3, 200m):

We know that a CPU request will guarantee minimum CPU time per cycle to each container. But in cases of contention, pods may or may not be able to use more CPU than requested, depending on the CPU requests and needs of the other pods that are scheduled on the same node.
If a pod has not specified any CPU requests, will it be able to run?
Creating a pod without CPU requests or limits will effectively allow it to be scheduled on any suitable node, regardless of the amount of CPU left on that node. In practice, it will still get some minimal CPU guarantees. However, it will not be able to use much CPU time when there is node pressure.
As we’ve seen, CPU requests will guarantee minimum CPU time per cycle, but they will also be used by the CFS to proportionally assign CPU time to containers scheduled on the same node. This is why it is important to continuously monitor your services’ CPU usage and ensure that their CPU requests are close to that usage.
A couple of metrics to watch are kubernetes.cpu.usage.total, which reports the number of nanocores used, and kubernetes.cpu.requests, which tracks the number of CPU cores requested. Both metrics are gauges and have a high cardinality, reporting tags as pod_name, container_name, or container_id.
To make things easier, you can explore these metrics in the Kubernetes Resource Utilization view in Datadog.
In the summary, you can see each pod’s average CPU usage as a percentage of its CPU requests and limits. These values are color coded to easily identify candidates to analyze. For example, the yellow values indicate pods that have a low ratio of CPU usage to requests, indicating that they may be overprovisioned:
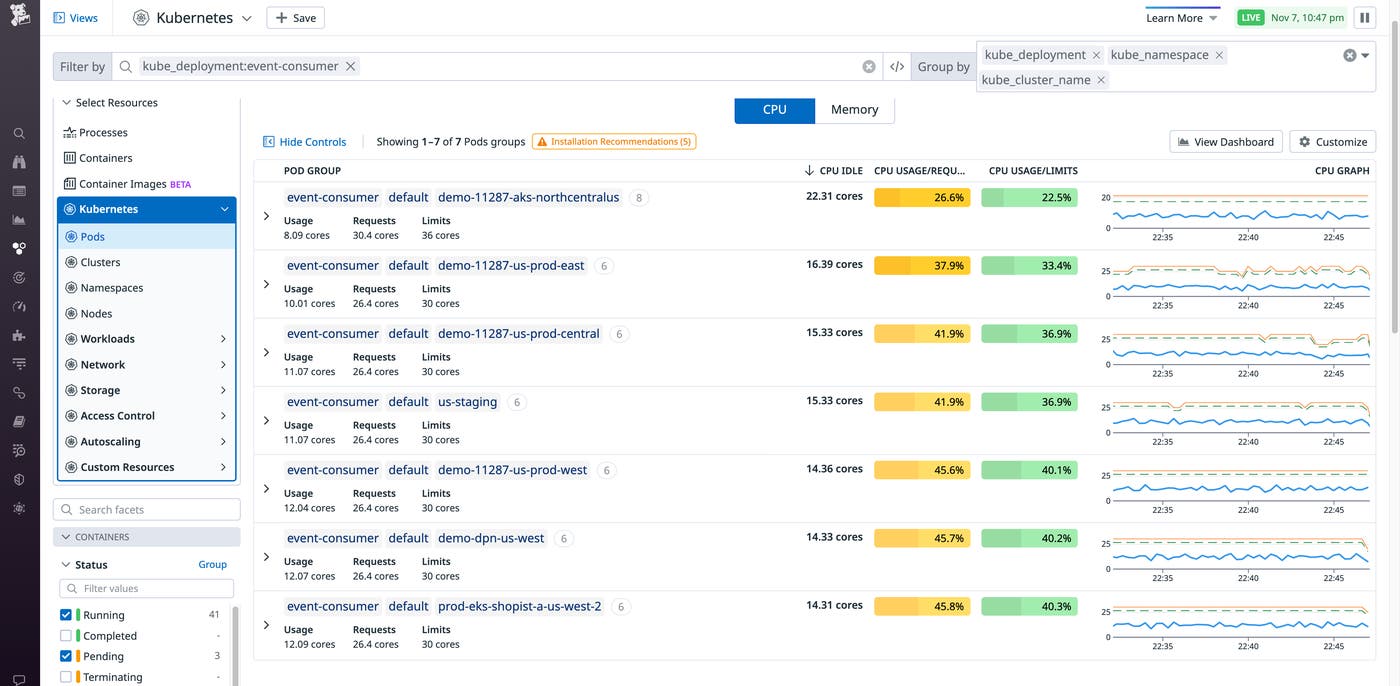
The percentages and summary graphs are based on the past 15 minutes of activity.
If your application doesn’t have a stable CPU utilization profile, 15 minutes might not be enough to make a decision about the right CPU requests. You can click on one of the lines to expand the details side panel, allowing you to select a different time frame:

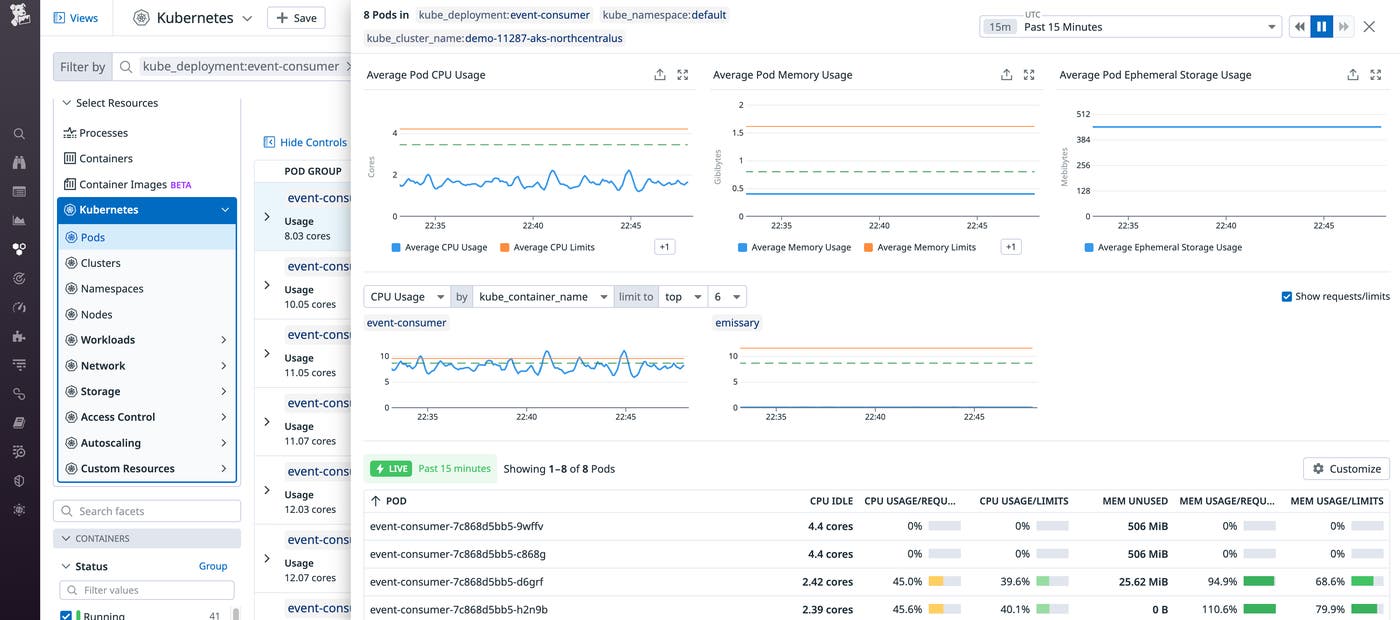
This view also allows you to export these graphs to your own dashboards and view the underlying queries, as shown below. From here, you can also customize these queries to suit your use case.
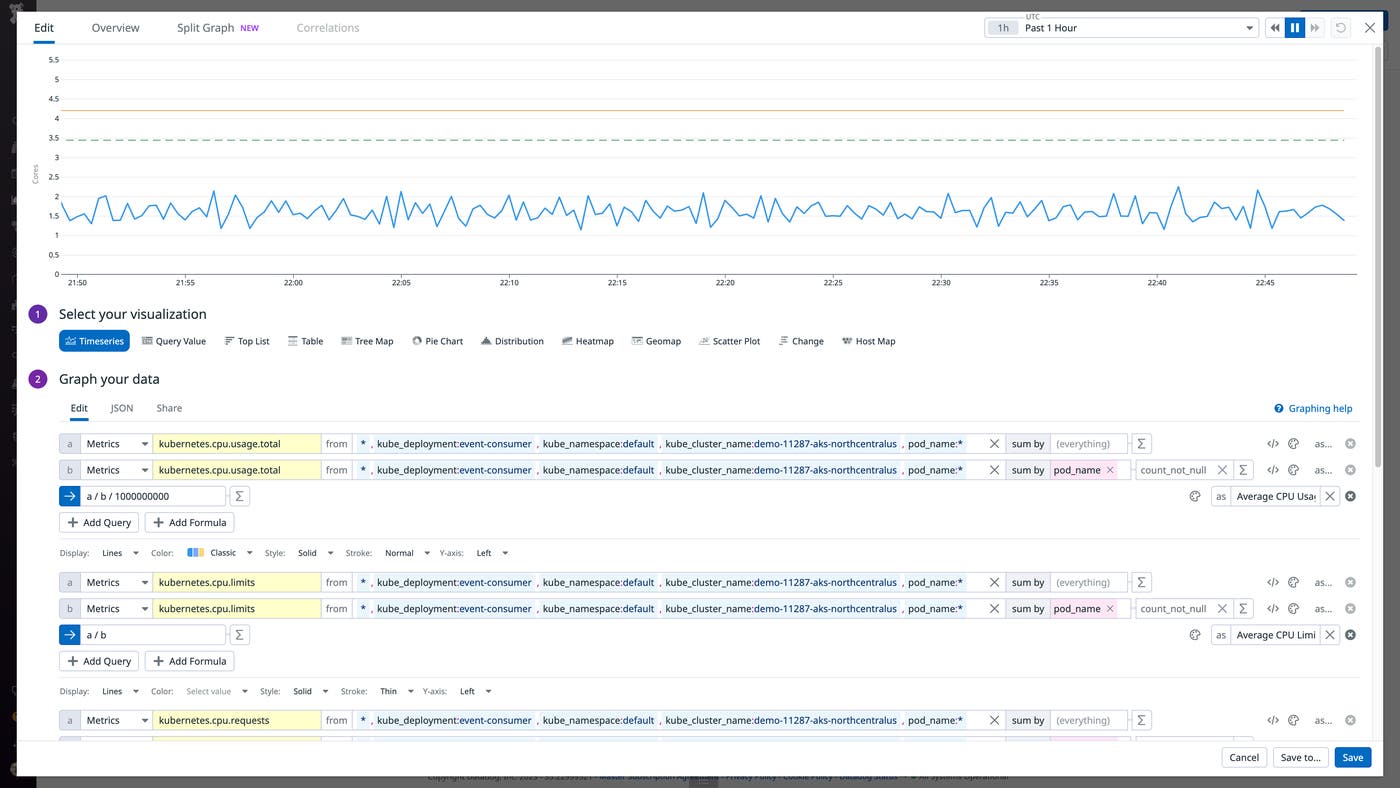
By default, these graphs are aggregated by pod. CPU requests and limits are defined at the container level, so it can be helpful to aggregate them by container instead. The following example shows how you could split the graph by container_name to see the breakdown of CPU requests, limits, and usage for the two containers in this particular pod. This can give you a better picture of the situation by comparing each container’s current CPU usage (blue line) against its CPU limit (orange line) and request (dashed green line).
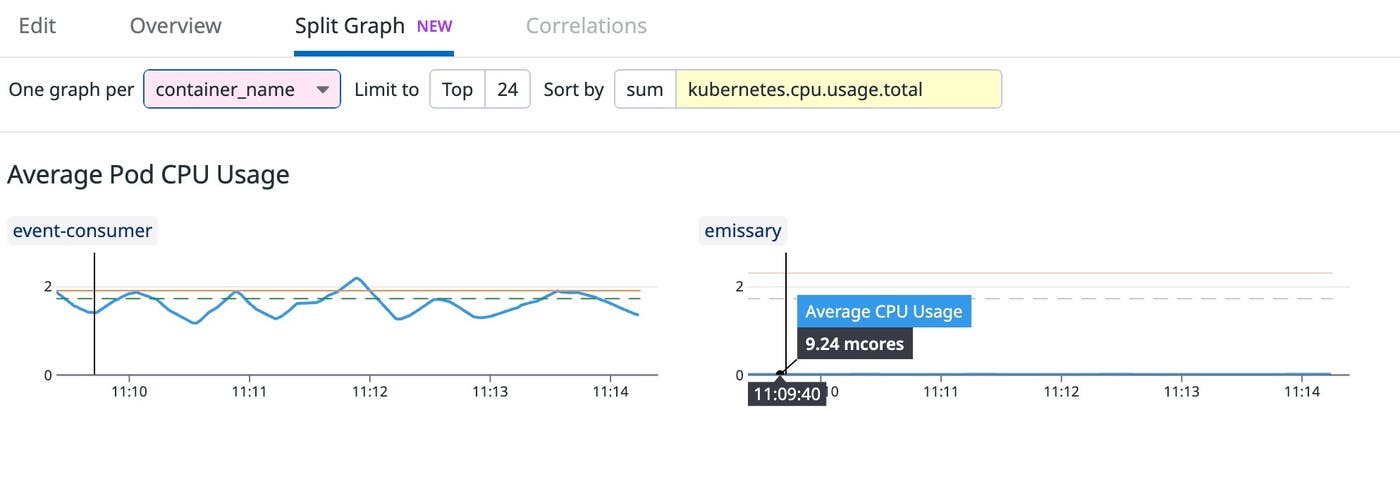
In the example above, the main container (event-consumer) is requesting an amount of CPU that matches its usage. However, the sidecar (emissary) is overprovisioned, so we should consider reducing its CPU request.
We’ve seen that CPU requests are used for scheduling, determining CPU time guarantees, and distributing CPU time proportionally. In this section, we’ll cover:
The purpose of CPU limits and how they are enforced
Metrics to monitor: CPU throttling
When you should set CPU limits
As the name suggests, CPU limits enforce a limit on the amount of CPU time a container can use in any specific time slice, regardless of whether the node has spare cycles. This is enforced by the configuration values for CFS quota and period for any container that has specified a CPU limit:
Quota: CPU time available for a CPU time period (in microseconds)
Period: time period to refill the cgroup quota (by default, 100,000 microseconds, or 100 ms)
These values are defined in cpu.cfs_quota_us and cpu.cfs_period_us for cgroup v1, and cpu.max for cgroup v2.
Let’s see how CPU limits will affect our previous example. Our three pods (with one container and one thread each) have set the following CPU requests and limits:

This means that, for each period of 100 ms, pod 1 will be able to use up to 20 ms, pod 2 up to 40 ms, and pod 3 up to 20 ms.
Now let’s revisit our first example, where none of the pods had CPU limits. When pod 1 was idle, while pod 2 and pod 3 had more CPU needs than what they had been guaranteed, this scenario was possible:
But now that we’ve specified CPU limits for all three pods, pods 2 and 3 will be throttled even if they have more CPU needs in this specific period—and even if the node has enough available CPU to fulfill those needs. Pod 2 will only be allowed to use 40 ms and pod 3 20 ms in a 100-ms period:

If requests are properly set as a reflection of CPU needs, this is less likely to happen. However, it is something to take into account if you have set CPU limits on your containers and you start seeing spikes in your application’s p95 and p99 latencies.
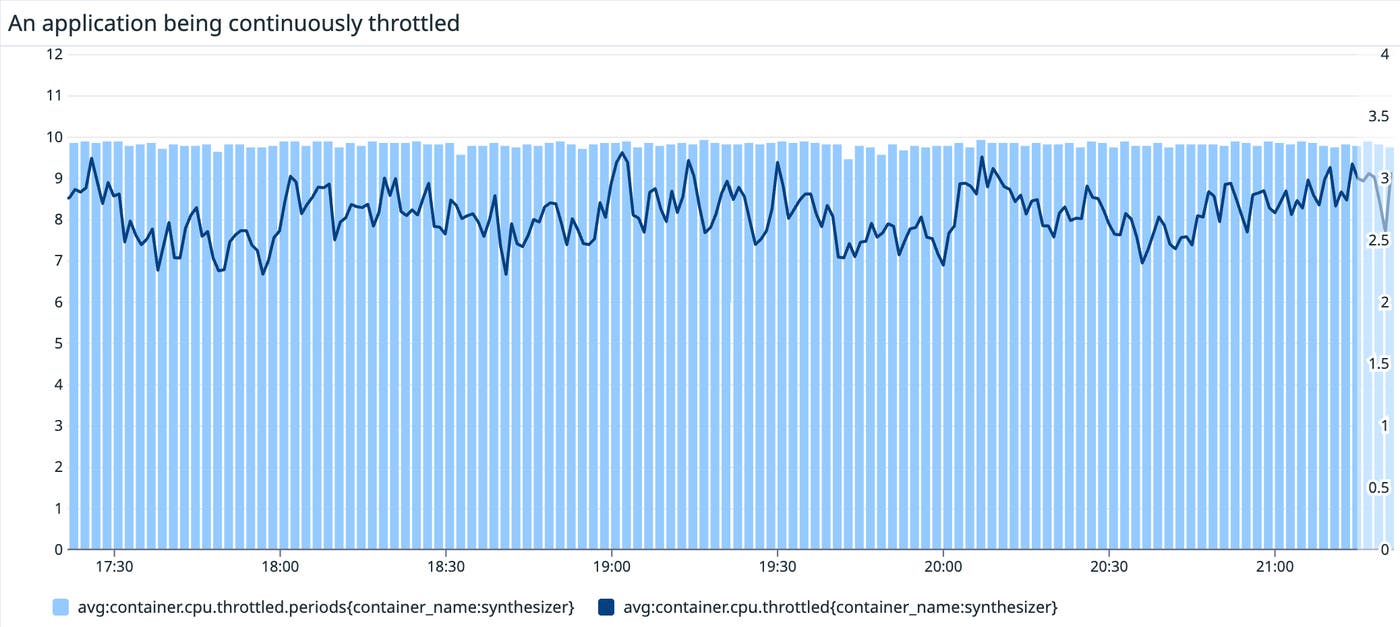
The Datadog Agent collects metrics that can help identify if your application is being throttled. Some of these metrics are also available through cAdvisor. Two metrics are available to identify the amount of time a container was throttled:
container.cpu.throttled: The number of nanoseconds a container was throttled (gauge)
container.cpu.throttled.periods: The number of CFS periods during which a container was throttled (gauge)
It might be useful to graph these two metrics alongside others like application latency, to correlate potential performance degradation issues with CPU throttling.
Under CFS, CPU requests guarantee minimum CPU time and distribute CPU time proportionally. Meanwhile, CPU limits can throttle your application even when there are spare CPU cycles. So when would you want to set CPU limits?
In this section, we will cover some of the scenarios where you would want to set CPU limits, and explore the potential consequences of setting limits.
As an application developer, you may want to set CPU limits in your staging environment to benchmark your application. By setting your CPU limits to the same values as your CPU requests, you can ensure that your application will get throttled if their CPU needs are larger than requested. You can track the throttling metrics to identify how often this occurs, and make adjustments to your CPU requests before going to production.
If you administer a compute managed platform with multiple tenants, those tenants will usually get assigned quotas for their resources, including CPU. This is very common in cases where the tenants are under a pay-per-usage billing model.
Usually, those quotas are enforced on each namespace by a ResourceQuota object. A ResourceQuota object limits the aggregate resource consumption in each namespace.
To create a pod in a namespace where a ResourceQuota for CPU applies, all containers in the pod need to have their CPU requests and limits set.
If containers are underprovisioned in terms of CPU requests and have specified CPU requests that are much lower than their limits (or they have not specified any limits at all), application performance will vary depending on the level of CPU contention on the node at any given time. If an application regularly needs more CPU than it requested, it may perform well as long as it can access the CPU it needs. However, its performance will start to suffer if a set of new pods that have higher CPU needs get scheduled on the same node, and the node’s available capacity decreases.
Setting CPU limits on your application’s containers to be close or equal to requests will warn you earlier about new CPU demands, instead of only discovering this after there is contention on the node.
Every pod in Kubernetes is assigned to one of three Quality of Service (QoS) classes: Guaranteed, Burstable, and BestEffort. The QoS class is one of the criteria used by the kubelet to decide which pods to evict in the case of node pressure.
Pods in the Guaranteed QoS class are less likely to be evicted, but they need to meet strict requirements to be assigned to this class. One requirement is that all of a pod’s containers (including its init containers) need to set limits that are equal to requests (for both CPU and memory). Pods also need to be in the Guaranteed QoS class in order to gain exclusive access to CPUs via the CPU Manager’s static policy, which we’ll cover in more detail in the next section.
static)Up to this point, we have discussed the CPU Manager’s default policy (none). With this policy, CFS uses CPU requests to assign CPU shares to each container, and CPU limits are enforced via CFS Quota. But this policy doesn’t specify which CPUs of a node will run the workloads of a given pod. As time goes by, a workload task/thread can migrate from one CPU to another (as the kernel scheduler sees fit). For many workloads, this is totally fine.
But there are specific workloads that might be sensitive to context switching, CPU cache misses, or cross-socket memory traffic. For those cases, you can enable the CPU Manager’s static policy so that you can use Linux CPUSets to pin a container to a set of specific cores.
When using the static policy, any container in a pod that is assigned to the Guaranteed QoS class (i.e., with defined CPU and memory requests and limits that are equal) and requesting an integer number of CPU cores, will get exclusive access to those cores. Those cores will be removed from the shared pool. As explained in the documentation, this exclusivity only applies to other pods: non-containerized processes (like the kubelet, system daemons, etc.) will still be able to run on these reserved cores.
When enabling the static policy, you will need to reserve some CPU resources for system daemons. You can do this by using the kube-reserved, system-reserved, or reserved-cpus kubelet options. This ensures that not all available CPUs will be allocated to containerized workloads.
Because of the current implementation of the static policy, the relationship between system reserved resources, node allocation, scheduling, and core exclusivity can be a bit confusing.
Let’s see how it works with an example.
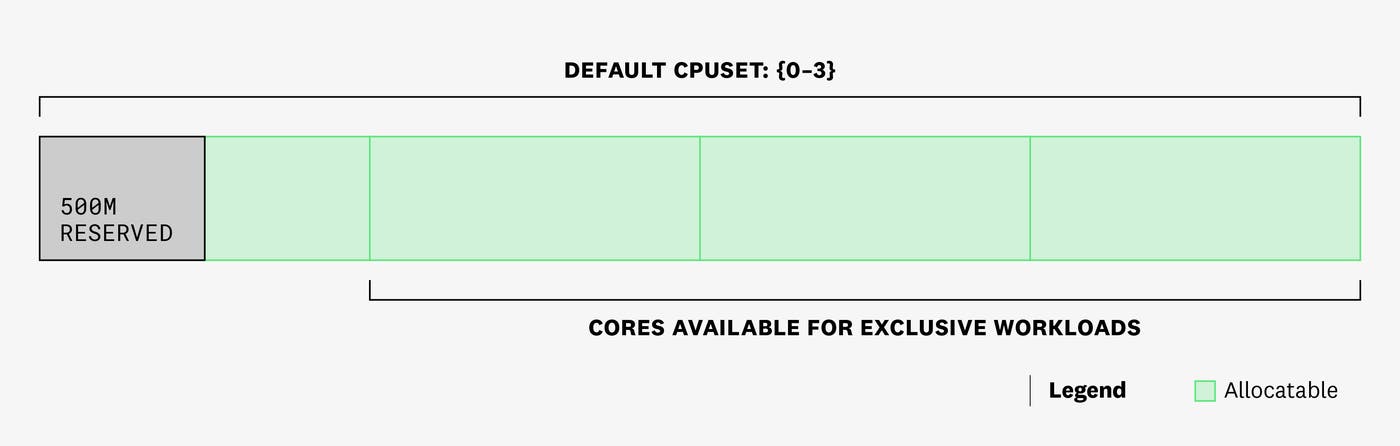
Let’s say we have one node in our cluster with four cores.

We have started the kubelet on that node with the CPU Manager’s static policy, and we have set kube-reserved to cpu=250m and system-reserved to cpu=250m.
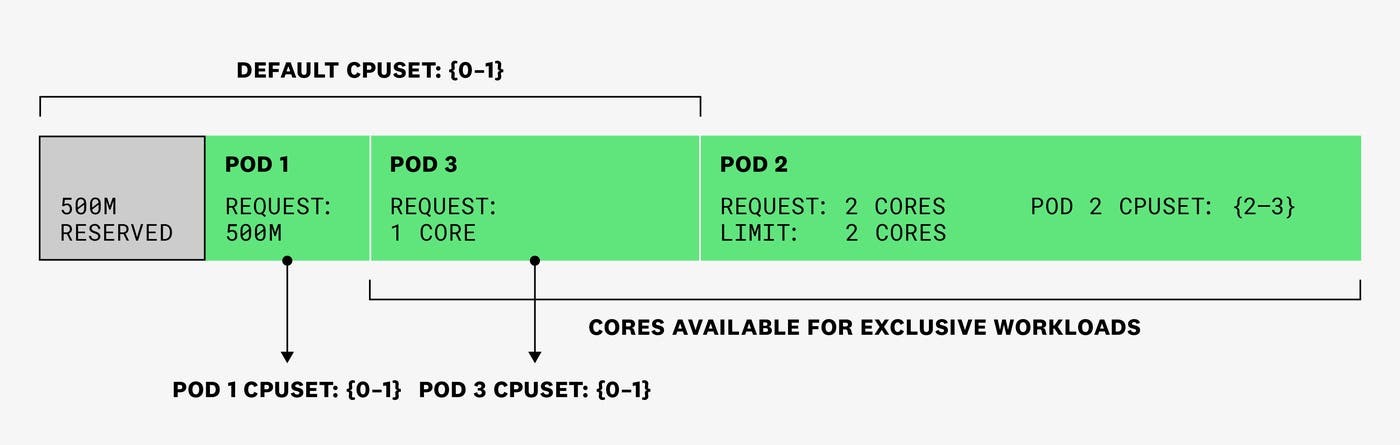
This means that half a core will be removed from the allocatable pool, and the scheduler will only place pods on this node up until the sum of CPU requests reaches 3.5 cores. But because exclusive workloads require integer values of CPU requests, only the remaining three cores (cores 1-3 in the example below) will be available for exclusive workloads. Currently, no workloads are scheduled on that node, and all 4 cores are part of the default CPUSet (shared pool):
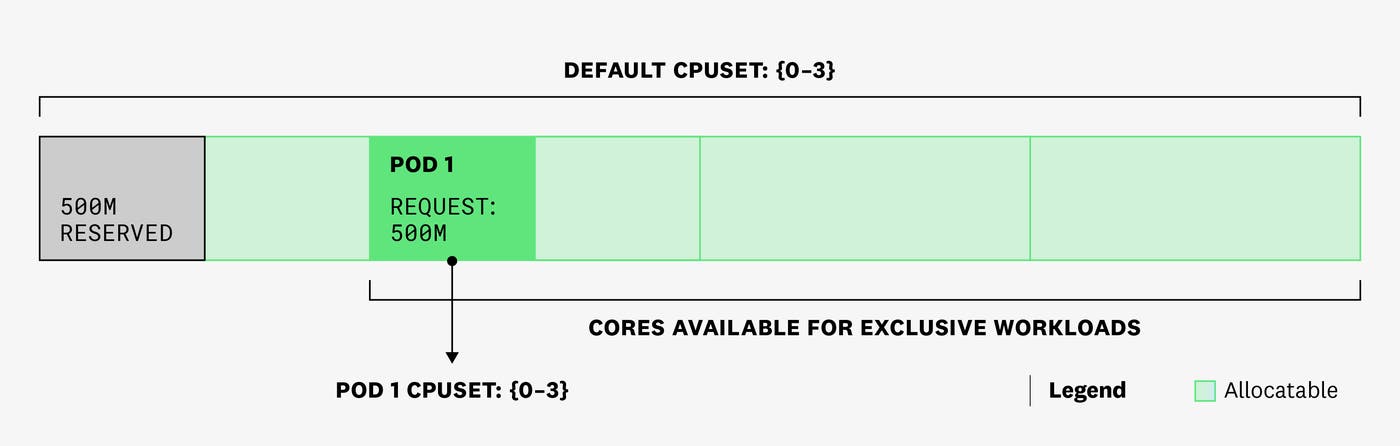
Now, let’s see what happens when we create pod 1 with one container that has a 500m CPU request and no CPU limit. The pod is scheduled, and it gets assigned a CPUSet of {0-3} (it can run on any of the cores). This means that from one time slice to the next, the container in pod 1 could run on different cores, which would add context switching overhead to this process.
We then create pod 2, with one container that has a CPU request and limit of 2 cores. It also has a memory request and limit set to 256 Mi. This pod is in the Guaranteed QoS class and requests an integer number of cores. Under the static policy, this means that it will get exclusive access to 2 cores. Not only will the cores assigned to this pod be removed from the default CPUSet, but all containers that are already running in the shared pool will get their CPUSets updated, so they won’t use CPU cycles from the exclusive set:
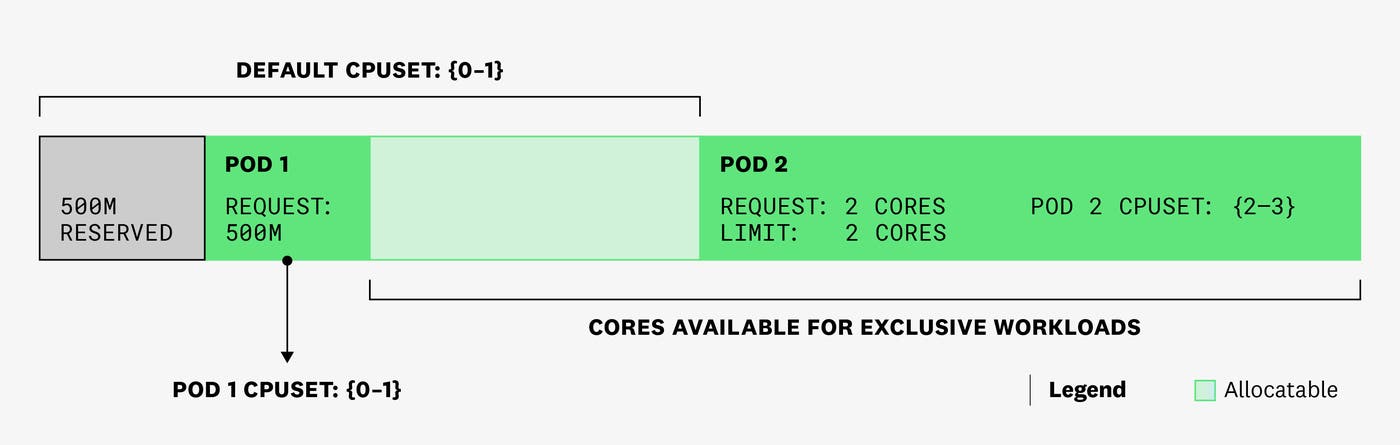
This will ensure that, in any given CPU cycle, the container from pod 2 will run on cores 2 and 3, and the rest of containers from other pods will only be able to run on cores 0 and 1. Again, because exclusivity is only enforced on pods, in any given CPU cycle, system daemons might still be running on cores 2 and 3.
Finally, we create pod 3, which has one container that requests 1 full core, but no CPU limit. This means that it will run in the shared pool (currently cores 0 and 1), and exclusivity will not be enforced on those cores:
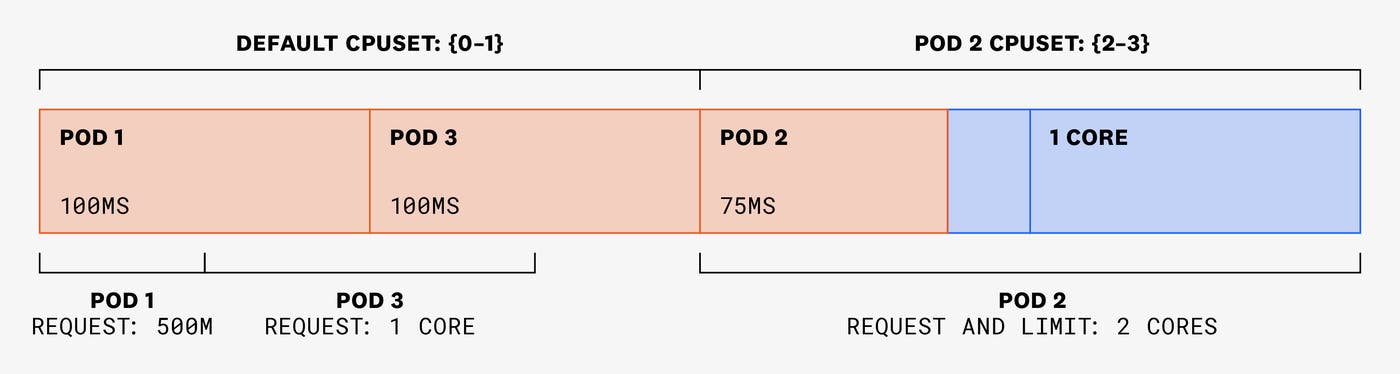
Let’s imagine that, in a 100-ms time slice, pods 1 and 3 each need to use 100 ms of CPU. As they haven’t set limits, they are able to use those CPU cycles without being throttled. Pod 2 has a single thread that needs to use 75 ms:
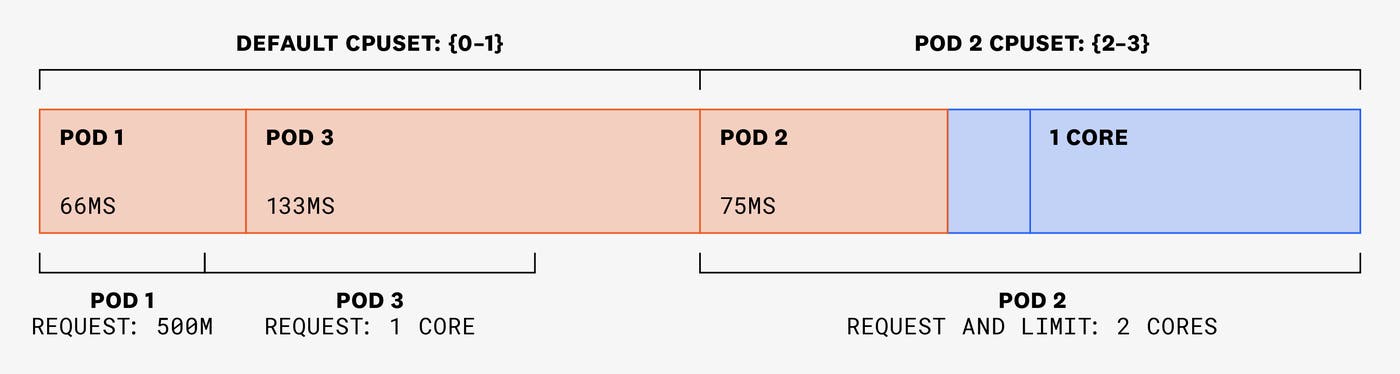
In the following 100-ms time slice, pods 1 and 3 each need to use 150 ms, and pod 2 still only needs to use 75 ms. But as pod 2’s cores are exclusive, they won’t be available to be used by pods 1 or 3. Instead, these two pods will be assigned CPU shares from the shared pool, in amounts that are proportional to their requests:
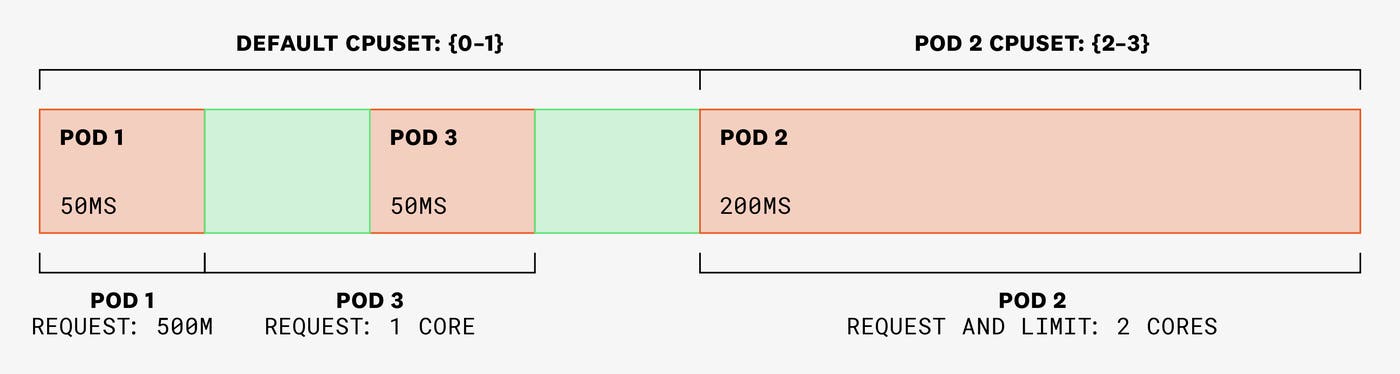
In the following 100-ms time slice, pods 1 and 3 need to use 50 ms each, and pod 2 has two threads that need to use 125 ms each. Pod 2 won’t be able to use more than 200 ms, as it is physically constrained to cores 2 and 3. Plus, its CPU limit is set to 2:
In summary, the CPU Manager’s static policy is very powerful and useful for workloads that are sensitive to context switching, but it is important to understand how exclusive workloads may affect other containers running on the same node.
The CPU Manager’s static policy also provides other options (with different maturity levels) to help you further control how physical cores are assigned to containers. The Kubernetes official documentation explains these options in detail.
We’ve seen that if a pod is in the Guaranteed QoS class and is requesting an integer number of cores, it will get assigned a specific CPUSet, and it won’t be able to use other cores outside its CPUSet. When it tries to use more than this limit, it will be throttled, and the previously discussed throttling metrics (container.cpu.throttled and container.cpu.throttled.periods) will be reported for the container. Watching these metrics for pods with static core assignments will be useful for determining if the workloads have been assigned enough cores for their needs.
Another metric that will be useful to track when using the CPU Manager’s static policy is container.cpu.limit. This metric is a gauge of the maximum CPU time available to the container (in nanocores). If a container has set a CPU limit in its specification, container.cpu.limit will always report this value. But if the containers in a pod haven’t set any limits, container.cpu.limit will report different values depending on the number of static assignments scheduled on the same node.
Let’s illustrate this by expanding on our previous example.
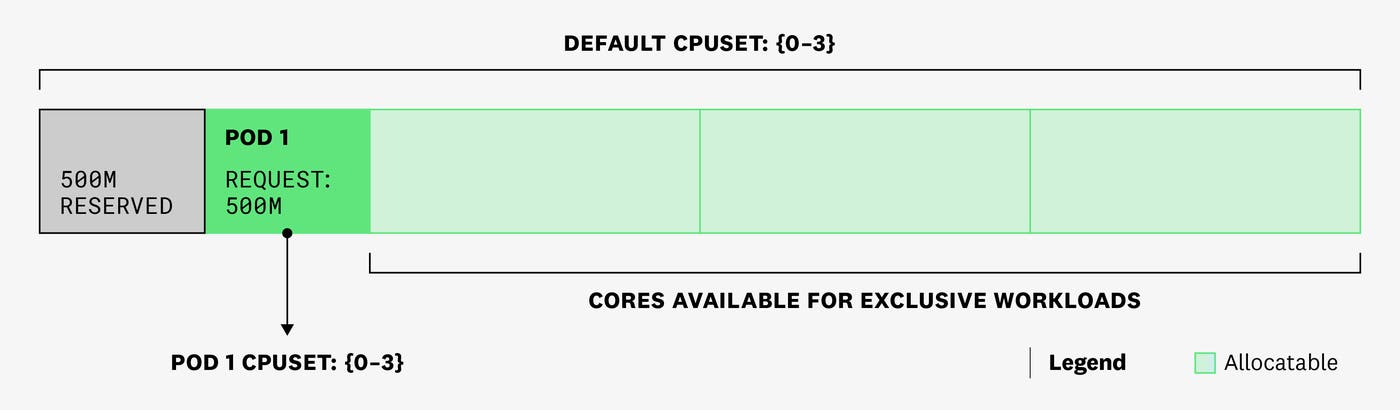
Let’s say that pod 1 is the first and only pod scheduled on the node. The pod has one container that has a 500m CPU request and no CPU limit. At this point, container.cpu.limit for the container on that pod will report a value of 4 cores. This is because the container can theoretically use all cores in a given CPU time slice.
Then pod 2 is scheduled, requesting a static assignment of 2 cores:
At this point, the container in pod 1 will start reporting a container.cpu.limit value of 2 cores, as cores 2 and 3 are reserved for the container in pod 2. This means that the container in pod 1 will only be able to use a maximum of 2 cores (the cores in the shared pool).
The container.cpu.limit metric is particularly useful for monitoring containers that have not specified CPU limits. They won’t be throttled by the CFS Quota and, therefore, won’t report the container.cpu.throttled metric, but they can still experience performance issues when the amount of CPU available on their nodes is suddenly limited by a static assignment.
The following graph illustrates this scenario in terms of the value of the container.cpu.limit (yellow) and container.cpu.usage (purple) metrics. At the start, pod 1 is using 3 cores, and its container.cpu.limit is the 4 cores of the node. As soon as pod 2 is created (represented by the red bar), requesting a static assignment of 2 cores, pod 1’s CPU limit is lowered to 2 cores:
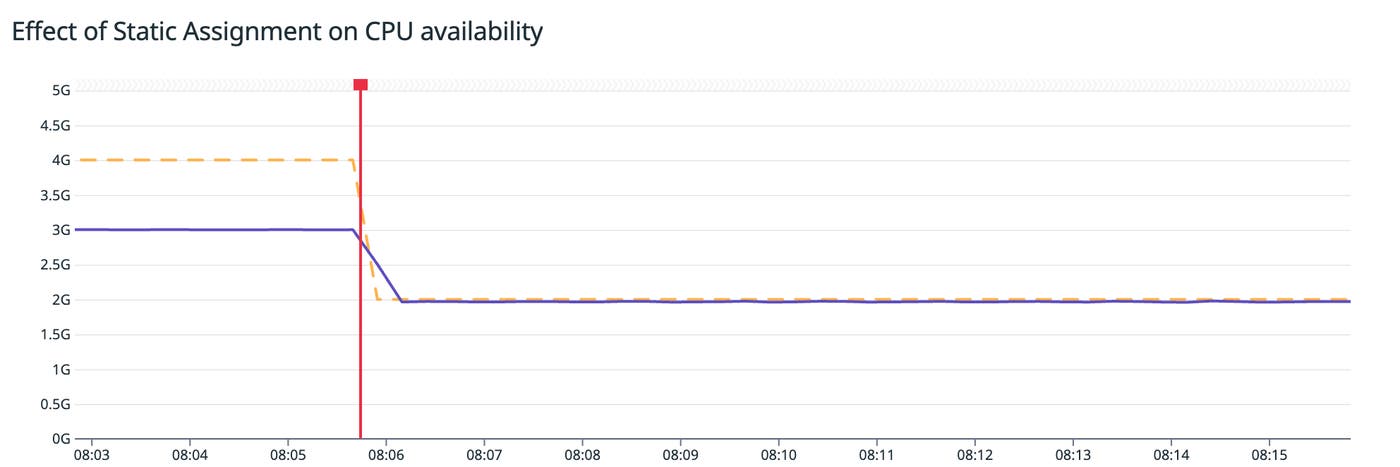
You can correlate this graph with key performance metrics to see if and how the static assignment is affecting your application. Without tracking the container.cpu.limit for each container, this type of performance regression can be hard to debug.
In Kubernetes, management of compute resources is abstracted away using concepts like container CPU requests and limits. Understanding what these abstractions mean and how they affect your application behavior is important for debugging potential performance issues.
In this blog post, we explained what these concepts look like in the CPU Manager’s none and static policies. We also provided metrics that can be very useful for debugging (or predicting) potential performance problems in containerized applications.
Check out our documentation to learn more about monitoring your containers’ CPU utilization, requests, and limits. If you’re not yet using Datadog, you can start a free trial.
此内容由惯性聚合(RSS阅读器)自动聚合整理,仅供阅读参考。 原文来自 — 版权归原作者所有。