





Kubernetes investigation rarely happens on a single cluster. Platform and SRE teams work across dozens or hundreds of clusters, running the same kubectl commands against each one. They then manually stitch in missing context, including the ownership, service, and environment details that kubectl can’t provide. Agents excel at this sort of repetitive work, but they often lack the necessary access to run kubectl, can’t enrich its output with external metadata, and can’t fit its multi-cluster output in a finite context window.
The Datadog Model Context Protocol (MCP) Server now includes a Kubernetes toolset that gives MCP-compatible AI agents read-only access to Kubernetes resource context in Datadog. Agents can query Kubernetes resources across your entire org and enrich query results with context from Datadog, all without needing direct access to your clusters. The toolset returns structured, scoped responses designed to fit within an agent’s context window.
This post covers how to use the Kubernetes toolset to:
- Search Kubernetes resources across clusters
- Inspect resource context without opening a console
- Fetch manifests with token-aware controls
- Compose investigation workflows
The Kubernetes toolset includes three tools, each targeting a different gap in what kubectl provides to an AI agent. Used individually or chained together, they give agents the primitives needed to answer questions and manage your Kubernetes resources.
Searching across multiple Kubernetes clusters to investigate issues can become an unmanageable challenge as your organization scales. To identify a service’s dependencies, compare resources for configuration drift, or verify that CPU limits are set consistently, you usually need to repeat queries across more than one cluster.
The search_datadog_k8s_resources tool enables agents to search across multiple clusters in a single call to efficiently answer cross-cluster questions. When given a natural language prompt such as “What deployments are failing in cluster prod, grouped by team?”, an agent calls the tool by using the same Datadog query syntax available in the Kubernetes Explorer. Based on the question, the agent can query by kind and kube_cluster_name to surface relevant deployments and provide a group_by flag to organize results. Agents can also use the team:$team placeholder to scope searches to the calling user’s team membership.
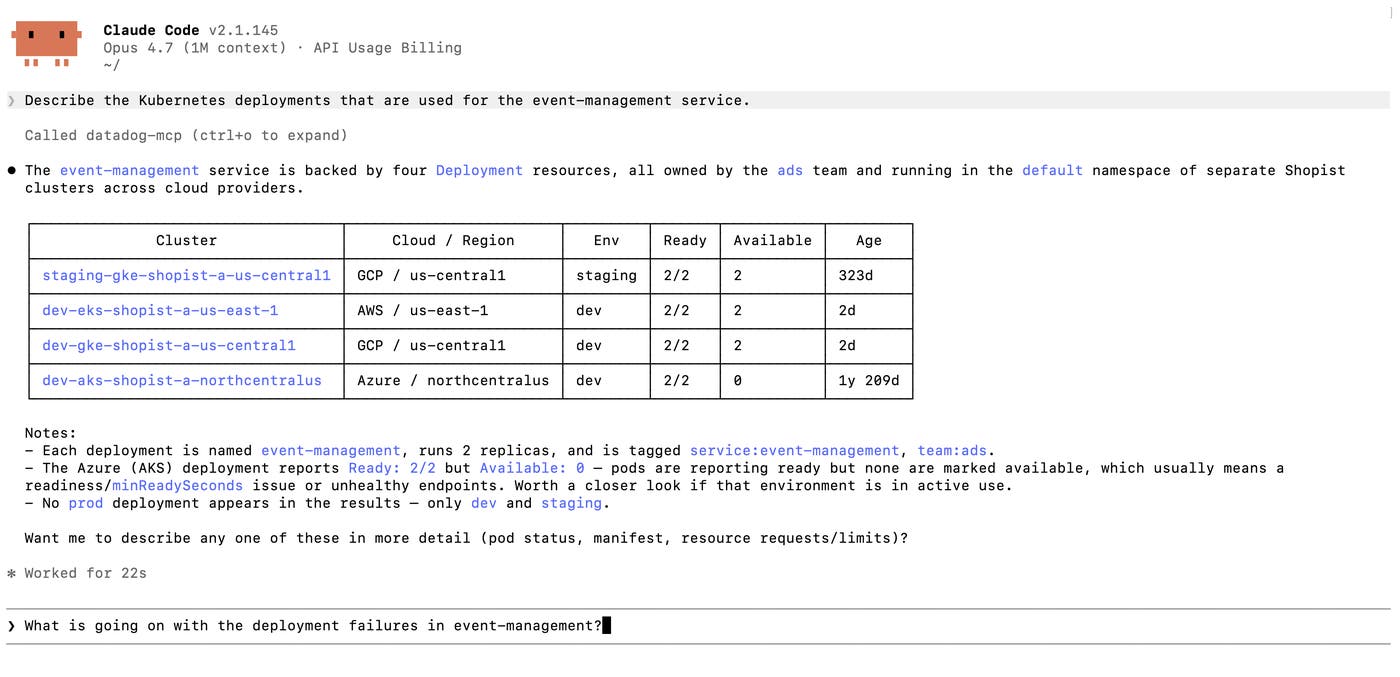
The agent can refine the query based on follow-up questions, such as by incorporating the include_parent_resource_names parameter to identify the deployment’s parent resources. The tool supports pagination, and it can be configured with a maximum token budget to manage costs and context window utilization.
The output of kubectl describe often gives an investigator only basic information about a Kubernetes resource, because it lacks context from its metadata. The describe_datadog_k8s_resource tool fills this gap by enriching that output with relevant metadata from Datadog. The tool returns metadata that includes service and team tags, labels, annotations, manifest history, and a direct link to the resource in the Datadog UI.
Agents can address a resource by cluster, namespace, and name, or by passing a uid from a previous search_datadog_k8s_resources call. And to use context windows efficiently, they can tune each call to request only what the current task needs. An ownership check might require only selected tags, but incident triage can pull parent resources and manifest history, then narrow the scope on subsequent queries as the investigation develops.
Kubernetes manifests often contain the evidence needed to answer detailed questions about workload behavior. A deployment might fail because a container image changed, a readiness probe was removed, or a resource limit differs between staging and production. But a complete manifest can easily consume substantial context space, filling the window with fields that may not be relevant to the prompt.
The get_datadog_k8s_manifest tool gives agents a kubectl get -o yaml equivalent and includes controls to manage its output size. Agents can set concise=true to pare down the output by omitting status and managed fields. Or they can pass a json_path to retrieve only the fields needed for the task.
Agents can identify the target resource in three ways depending on what’s available. They can pass the manifest_history hash from a previous describe_datadog_k8s_resource call to retrieve a specific historical revision. When a resource has already been found via search, agents can pass its uid to fetch the current manifest. When the cluster, namespace, and resource name are already known, agents can pass those directly without a prior search.
The toolset’s search, describe, and manifest retrieval tools work as building blocks to enable investigation workflows. An agent can search for a resource, describe it with full Datadog context, and fetch exactly the manifest fields it needs, chaining calls as the investigation develops rather than requesting every possible detail from the start. The following workflows show what that looks like in practice, from incident triage to pull request (PR) risk analysis.
A platform engineer might ask, “Why is the api-server deployment crashing in cluster prod, namespace default?” An agent can call describe_datadog_k8s_resource with the deployment’s cluster, namespace, and resource name. The agent can optionally set include_manifest_history=true to check whether a recent rollout changed an image or resource limits. It can then call get_datadog_k8s_manifest with json_path=spec.template.spec.containers[*] to compare the current container spec against a previous revision.
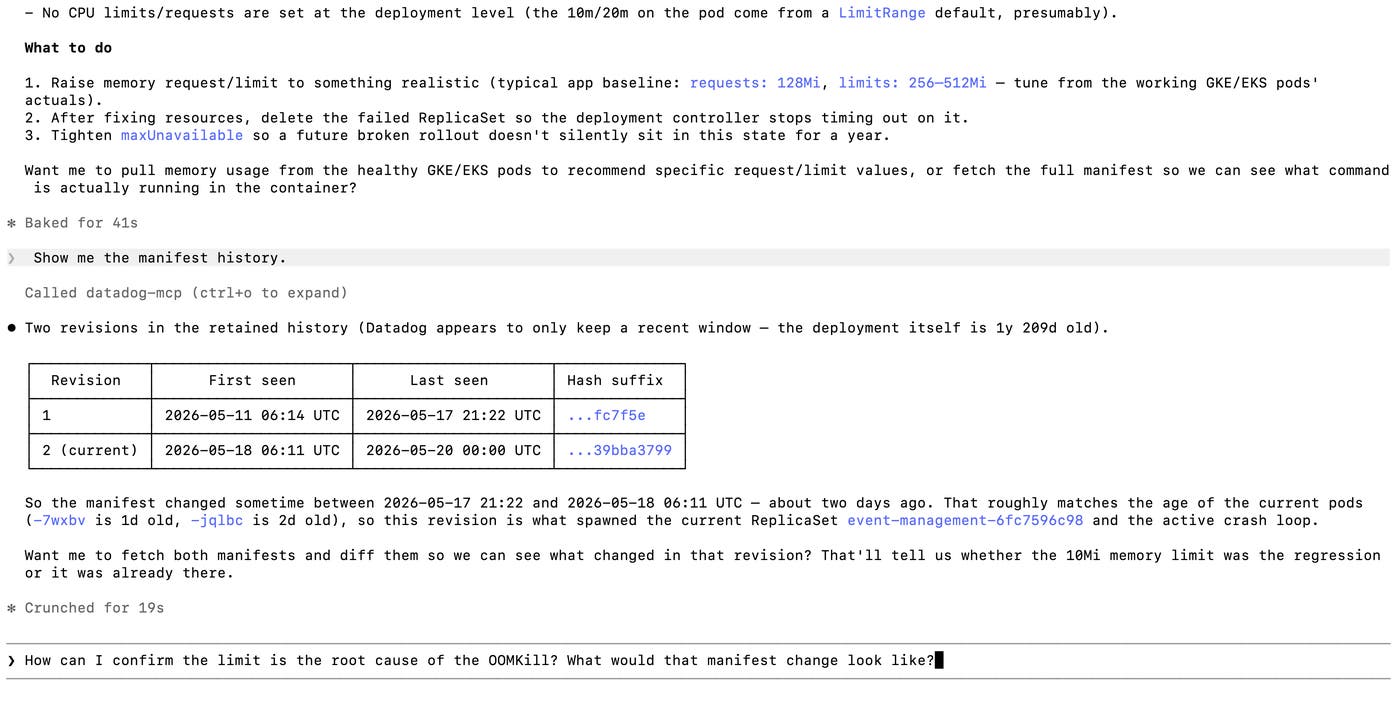
After the agent identifies a change that explains the failed deployment, it returns the resource identifiers, relevant manifest fields, manifest history, and a link to the resource in Datadog. The engineer can then validate the result and share the summary with an incident team without rerunning the same Kubernetes queries manually.
Rollback decisions can require more than resource status. A responder might ask, “If I roll back Kubernetes deployment backend from the namespace default in cluster staging, what services will be affected?” An agent can call describe_datadog_k8s_resource to resolve the deployment’s service tag, then call search_datadog_service_dependencies from the core MCP toolset to map upstream and downstream relationships. Dependency context helps responders identify teams to notify, services to watch, and dashboards or monitors to review before they roll back a deployment. Blast radius mapping can also support pre-deployment checks, incident updates, maintenance upgrades, and handoff notes for on-call teams.
Configuration drift can be difficult to spot when test and production environments live in different clusters. An engineer can ask an agent to compare the api-server deployment in staging and production, and the agent can call get_datadog_k8s_manifest twice with concise=true to retrieve comparable manifests. The agent can then produce a structured diff that highlights differences in images, environment variables, probes, resource settings, and labels.
Platform teams often need to ask governance questions across many clusters, not one workload at a time. An engineer might need to find every deployment without a configured CPU limit across multiple clusters. The agent can use search_datadog_k8s_resources to find candidate deployments, organize the results with group_by=team,service then call get_datadog_k8s_manifest with json_path=spec.template.spec.containers[*].resources to inspect resource settings.
The same pattern can support checks for required labels, cost-center tags, approved image registries, minimum image versions, readiness probes, and autoscaling standards. Grouped search results make the output easier to route to the right teams, while targeted manifest retrieval keeps the agent from pulling entire manifests when it only needs one subtree.
A coding agent can apply the same search_datadog_k8s_resources and get_datadog_k8s_manifest pattern during pull request (PR) review. When a PR edits deploy.yaml, the agent can fetch the live manifest for the matching resource, compare the proposed change with the running configuration, and update the PR to add a risk summary. PR-time checks help reviewers understand whether a change affects a live workload, a required label, or a resource limit before the change reaches production.
The Kubernetes toolset extends the Datadog MCP Server with cross-cluster search, enriched resource descriptions, and token-aware manifest retrieval. These tools help platform and SRE teams enable agents to enrich kubectl output and build efficient investigation workflows across multiple clusters.
See the documentation to learn more about setting up the Datadog MCP Server and using the Kubernetes toolset. If you’re new to Datadog, sign up for a free 14-day trial.
此内容由惯性聚合(RSS阅读器)自动聚合整理,仅供阅读参考。 原文来自 — 版权归原作者所有。