






Engineering teams lose hours in the gap between detecting a problem and getting a fix into review. An on-call engineer sees an error spike in Datadog, pivots to traces and logs to isolate the failure, opens the relevant repository, reproduces the issue, writes a fix, adds tests, waits on CI, and finally opens a pull request. Even when the problem is familiar, the workflow pulls engineers across several tools and stretches remediation from minutes into hours or days.
Bits Code closes that gap by turning high-impact Datadog findings into code changes that engineers can review. When Datadog surfaces an error, performance regression, profiling hotspot, flaky test, vulnerability, slow query, or Kubernetes issue, Bits Code can investigate the issue by using the telemetry data and service context already available in Datadog. It then generates a targeted code change, adds unit tests, iterates through CI failures, and opens a pull request in GitHub within minutes for an engineer to review.
In this post, we’ll show how Bits Code:
Turns a Datadog finding into a reviewable PR
Grounds code changes in production context
Handles general coding tasks through direct prompting
Runs on demand, on a schedule, or based on custom trigger rules
Operates within enterprise access and governance controls
The fastest way to understand Bits Code is to follow a single issue from detection to merge.
For example, suppose Error Tracking surfaces a new high-impact error in a production service. From the issue view, a responder selects “Fix with Bits” Bits Code opens an investigation inside Datadog and begins working through the available evidence: the stack trace, related traces showing which upstream call triggered the failure, and the logs emitted around the error. The investigation runs in the same view the responder is already looking at, so they can follow the agent’s reasoning step by step before any code is written.
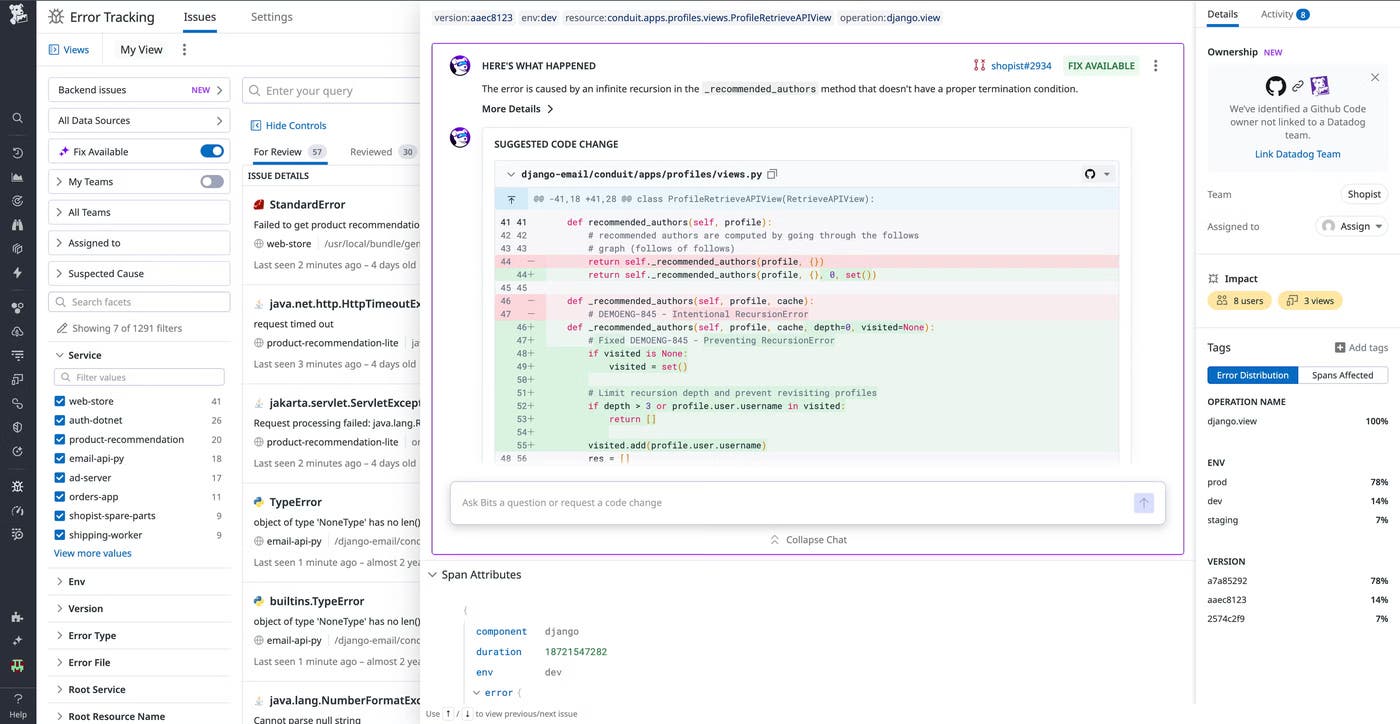
Once Bits Code identifies the failing code path, it drafts a targeted fix and unit tests. The proposed diff is visible in Datadog alongside the investigation, so the responder can confirm the change is on the right line in the right file before opening a pull request in the service’s linked GitHub repository. Bits Code then monitors for any CI failures and iterates on any failures until the build passes.
The resulting pull request lands in GitHub with the investigation summary, the originating Datadog finding, and the test results embedded in the description. A human reviewer has everything they need to decide whether to merge, without clicking back into Datadog to reconstruct the context.
Bits Code follows this same investigate-and-propose loop across other Datadog products. In Application Performance Monitoring (APM), it uses traces and service context to turn App Recommendations into reviewable PRs instead of backlog tickets. In Code Security, it translates Runtime Code Analysis (IAST) and Software Composition Analysis (SCA) findings into remediation PRs, and powers Code Security Campaigns for bulk fixes across many services and repositories at once. It also handles flame graph hotspots in Continuous Profiler, flaky tests in Test Optimization, slow queries in Database Monitoring, and application code fixes for Kubernetes issues, using the relevant telemetry in each case to produce a reviewable PR. For a deeper look at how Bits Code enhances a specific workflow, check out our documentation.
Most coding assistants reason over repository contents. That’s enough for refactors, code generation, and local cleanup, but it’s not enough for an incident. The right incident fix depends on which users were affected, how often the error fires, what the trace shows about the slow path, and what state the service was in when the failure happened.
Bits Code investigates using the same telemetry Datadog already collects. It reasons across logs, traces, metrics, profiles, Real User Monitoring (RUM) sessions, runtime variables, and security findings. The proposed change reflects what Datadog observed in production instead of just what the code looks like in isolation, which also means Bits Code is less prone to the plausible-but-wrong suggestions that come from reasoning over source alone.
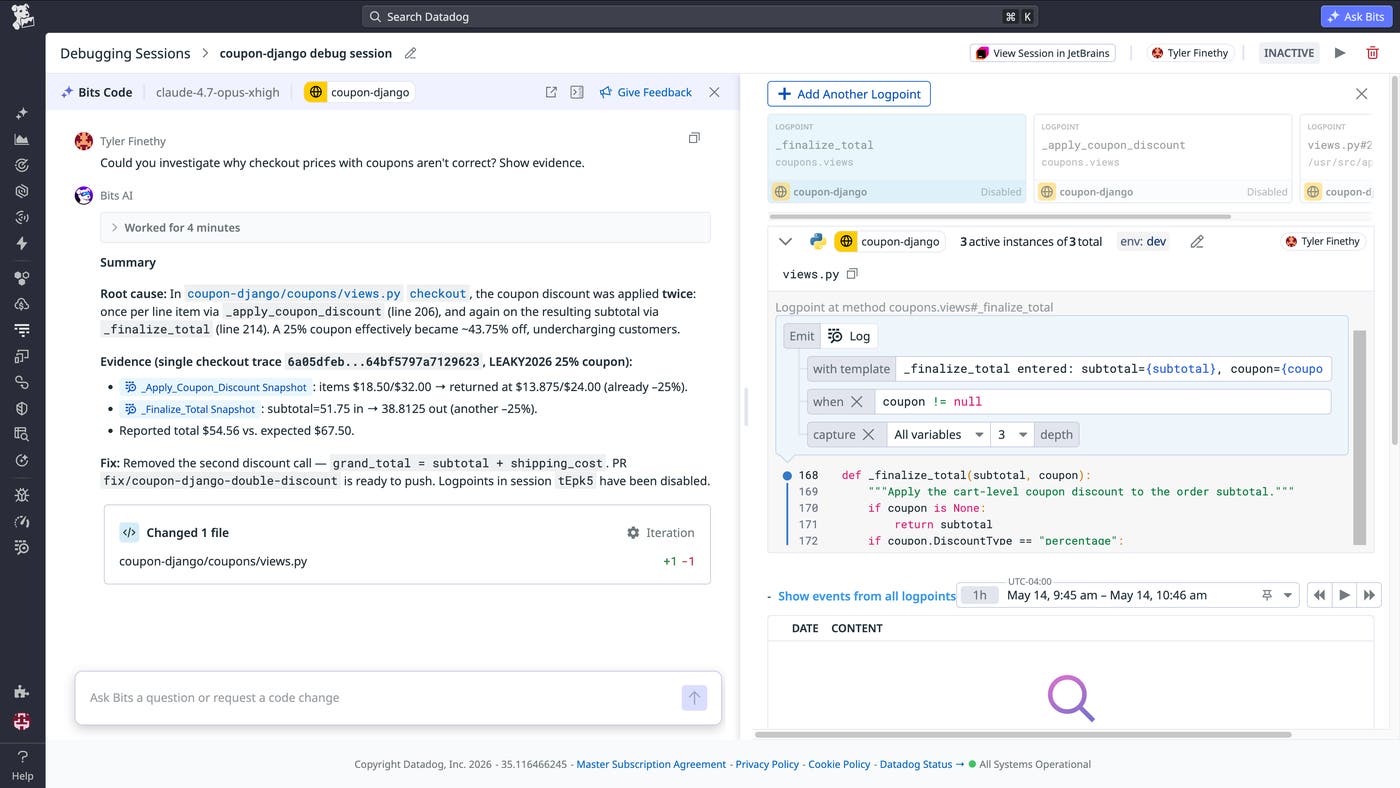
Runtime evidence from Live Debugger is one of the clearest examples. When Live Debugger captures variable values at the moment a bug fires (the contents of a request, the state of a cache, the value of a flag), Bits Code can reason about what the code was actually doing when it failed. For example, when a null pointer exception fires, Live Debugger data can show which field was null at the moment of failure, context the source code alone doesn’t provide.
Production telemetry also helps Bits Code prioritize. The same agent can fix many kinds of issues, but not every issue is worth fixing first. A recurring error in a business-critical checkout service outranks a low-volume issue in an internal admin tool. By using error frequency, user impact, and service criticality as inputs, Bits Code focuses review time on the changes that matter most to reliability, performance, and customer experience.
Not every coding task starts with an alert. An engineer might want to optimize a slow code path they keep seeing in traces, update an outdated dependency, refactor a function before a planned migration, or apply a small change across several services. Bits Code supports freeform prompting for these cases.
From the Bits AI surface in Datadog, an engineer selects a repository and describes the task in natural language. Bits Code investigates with the same telemetry-grounded reasoning it uses for automatic remediation, drafts the change, adds tests, and opens a PR. Production context shapes the implementation even when the work began as a manual request; an optimization PR for a function that’s hot in production profiles will reflect the actual call patterns Datadog has observed, not a generic best-practice rewrite. If a direct-prompt task later becomes a real incident, the agent has the context to carry the work forward.
Bits Code also works with the Datadog MCP Server, which lets engineers inspect the agent’s reasoning and hand it work on their terms rather than treating it as a black box.
Some remediation work is reactive, but a lot of it is predictable. Teams know they want to clear a few flaky tests each week, triage the top new errors every morning, or burn down dependency advisories each sprint. These tasks slip because each is individually small but still requires investigation, code changes, tests, and review. Bits Code can run on demand, on a schedule, or in response to custom telemetry triggers, so the work happens without an engineer having to start it.
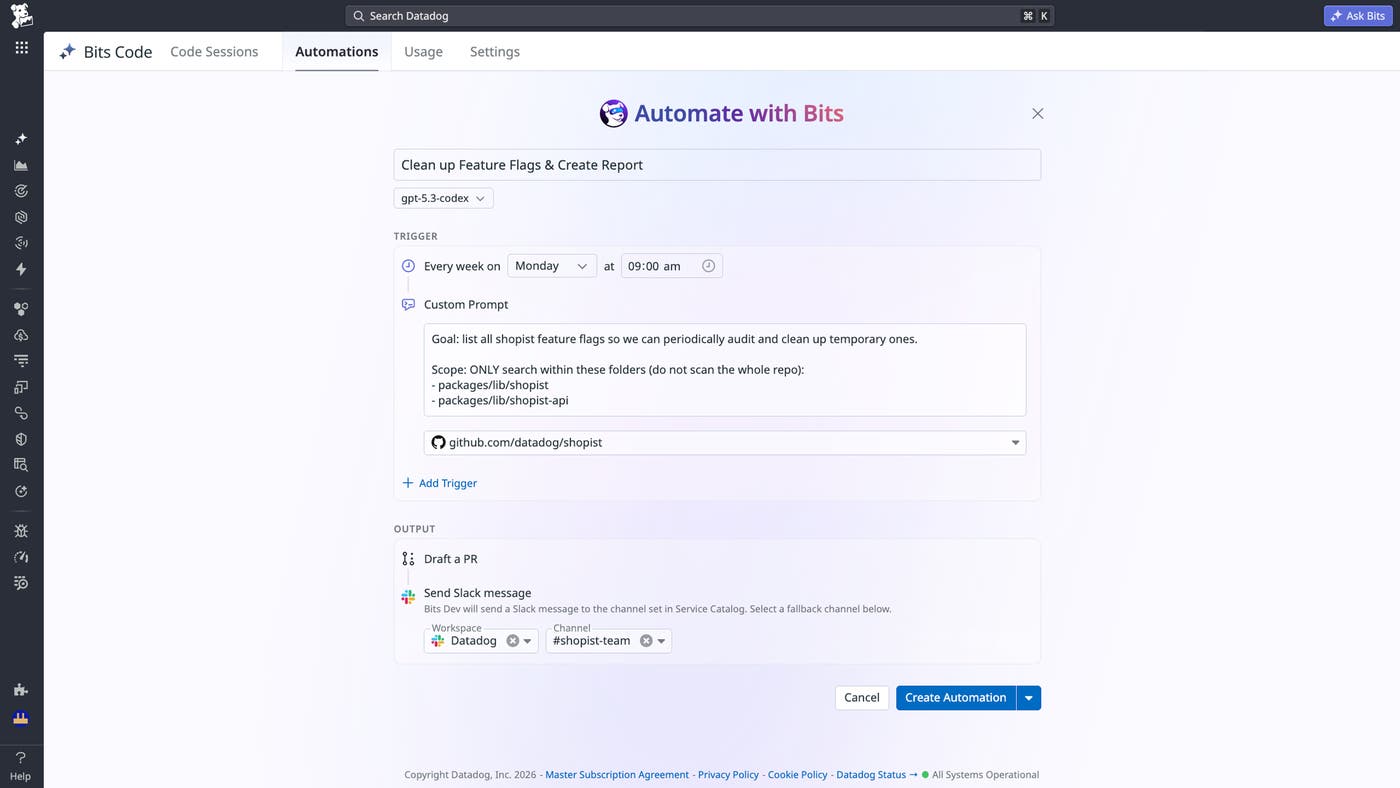
Scheduled runs handle recurring cleanup. A team can configure Bits Code to investigate the top ten new errors every morning, fix five flaky tests every week, or clean up 10 dependency advisories each sprint. Telemetry-triggered runs start an investigation the moment a qualifying issue appears: for example, a new high-impact error, a performance regression that crosses a threshold, or a newly disclosed vulnerability affecting a production service. Automations are also useful for larger cleanup; security teams can run automated campaigns to remediate vulnerabilities across many services and repositories at once, and engineering teams can apply the same approach to error backlogs or flaky test cleanup automatically reducing persistent technical debt.
In every case, the resulting pull request still goes through normal human review. The Bits Code usage view shows scheduled and triggered activity in one place, so teams can track which runs produced PRs, which are still in flight, and which finished without proposing a change.
Bits Code is designed for production engineering environments where governance, privacy, and review controls matter. The agent proposes pull requests, but engineers decide what to merge. This keeps humans in the review path while allowing routine investigation and code generation work to happen more consistently.
Role-based access controls help teams scope where Bits Code can act. Administrators can control which repositories, services, and teams the agent can access, making it easier to introduce AI-assisted remediation gradually and with appropriate boundaries. These controls are important for larger organizations where ownership, compliance requirements, and repository access vary across teams.
Bits Code also follows the privacy and governance expectations of the broader Bits AI product family. It supports zero data retention with third-party AI providers to help protect source code and telemetry data. Flexible rate limits and cost controls help teams manage adoption as more engineers and services begin using the agent.
Together, these controls make Bits Code practical for enterprise deployment. Teams can give engineers a faster path from Datadog signal to code review while preserving ownership, review, and administrative control over the remediation workflow.
Bits Code is generally available to all Datadog customers. By combining Datadog telemetry data, repository context, automated testing, and pull request creation, Bits Code helps teams reduce manual remediation work across errors, performance regressions, profiling hotspots, flaky tests, vulnerabilities, slow queries, and Kubernetes issues. Engineers stay in control of code review while Bits Code handles more of the investigation and implementation work that often slows down remediation.
To get started, make sure that Bits AI is enabled and that Source Code Integration is configured. GitHub Cloud is supported, and GitLab support is in beta. You can navigate to a supported Datadog product and select “Fix with Bits” on a supported issue, or go to Bits AI > Bits Code to start a freeform coding session. To learn more, read our Bits Code documentation and Bits Code setup guide. If you don’t already have a Datadog account, you can sign up for a 14-day free trial.
此内容由惯性聚合(RSS阅读器)自动聚合整理,仅供阅读参考。 原文来自 — 版权归原作者所有。