


Recently a customer asked why the network metrics produced in Datadog looked to be off by a factor of 2 from the network metrics as seen in the AWS CloudWatch console.
Specifically, the AWS metric in question was NetworkIn. However, the same problem also applied to NetworkOut.
Obviously, this inconsistency struck us as odd, since we are concerned with anything that may be inaccurate with the data we collect and report. Both Datadog and CloudWatch should be reporting the same values, so why would there be a difference in the representation?
From the CloudWatch documentation:
<cite>The number of bytes received on all network interfaces by the instance. This metric identifies the volume of incoming network traffic to an application on a single instance.</cite>
AWS CloudWatch metrics are produced by default at a 5-minute intervals, unless Enable Detailed Monitoring is active, which produces metrics at 1-minute intervals, for an added cost.
By comparison, the Datadog Agent produces metrics at 15-second intervals, and the network metrics collected are named system.net.bytes_rcvd and system.net.bytes_sent across all available interfaces, normalized to per-second values.
Here’s a graph from one instance, with a relatively steady traffic rate, as reported from CloudWatch, with 5-minute intervals.

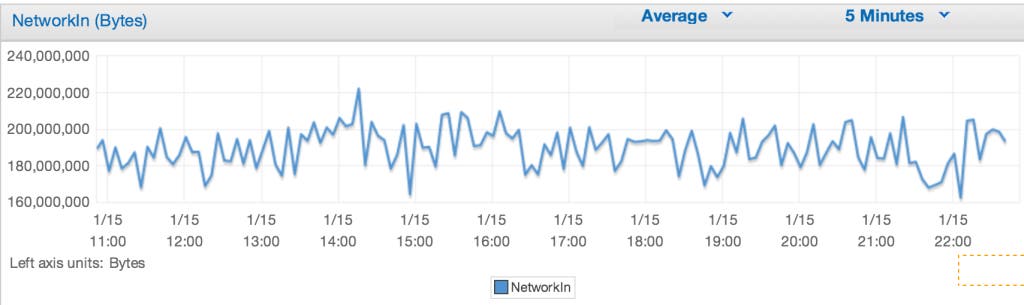
We can see that the traffic holds pretty steady between 160-200 million bytes per reported datapoint.
This is also reported in Datadog, and views as aws.ec2.network_in, as can be seen here:

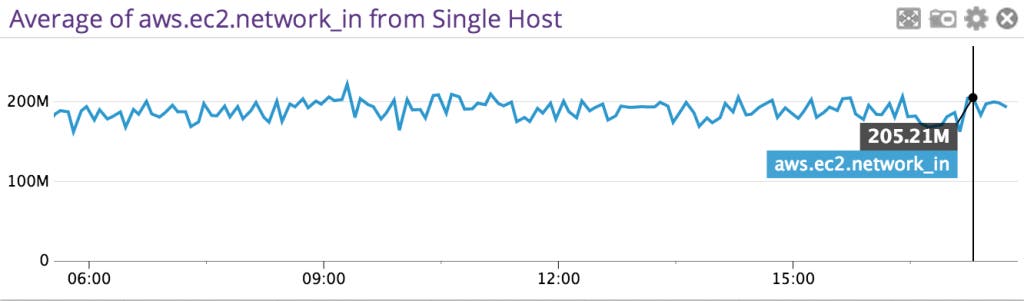
So far, so good. Both look the same.
Now let’s see what the Datadog Agent is reporting by viewing the average of system.net.bytes_rcvd as reported by the same instance.

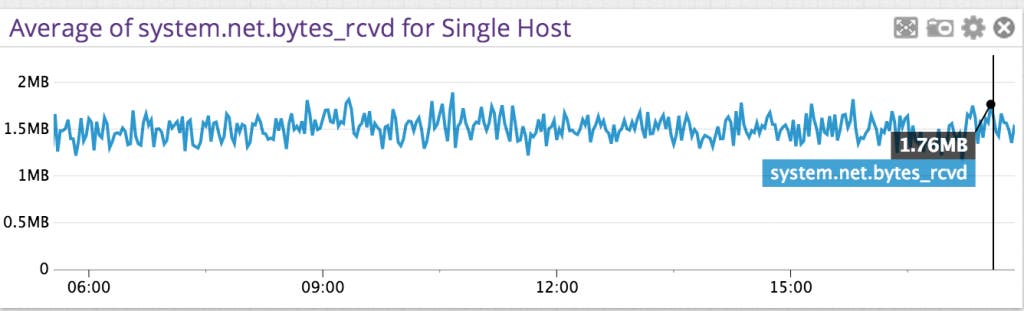
The scale from the Agent is showing MB (Megabytes), and is nowhere near 200MB! That can’t be right.
Placing both metrics on the same graph is as easy as clicking the Edit button, and adding a new metric, so now I can see them both on the same graph:

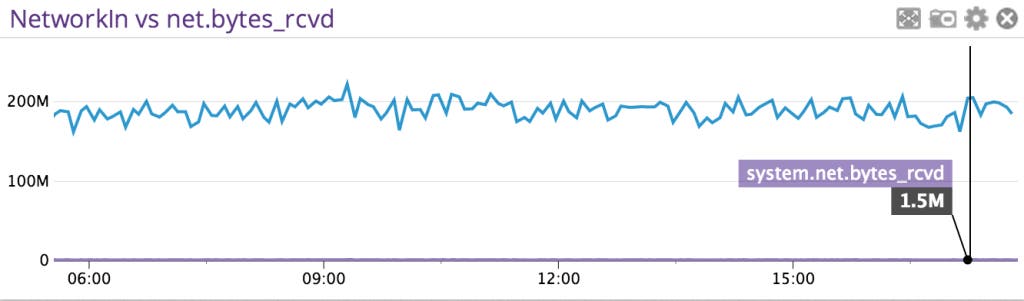
The graph now looks even worse–since the values are so far apart, it’s near impossible to compare them. Apples and oranges.
The CloudWatch metric is reported at a frequency of 1 value every 5 minutes, and Datadog is reporting the value exactly as it’s receiving it from the Agent, which is reporting at a frequency of 1 value every 15 seconds. We need to perform some math to bring these two values into comparable scale.
The CloudWatch units are not what you’d typically expect, due to less frequent reporting intervals, and mask most spikes and valleys as averages.
Putting on my Graphing 201 hat, I edit the JSON directly:
...
{
"q": "aws.ec2.network_in{host:i-123456} / 60"
},
{
"q": "system.net.bytes_rcvd{host:i-123456}"
}
...
Applying a divisor of 60 (seconds) to the CloudWatch metric, bringing it from ~200M bytes per datapoint to ~3M bytes per datapoint, as can be seen here:

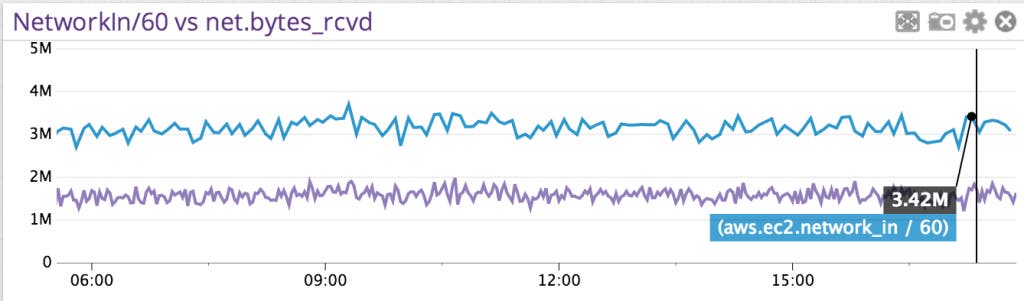
But that’s still off, by a factor of 2, as originally stated at the beginning of this post.
The secret is that the metric system.net.bytes_rcvd has another dimension (or ‘tag’) that the CloudWatch metric doesn’t: device.
The Agent will collect metrics from all network devices, whereas the EC2 hypervisor can only see metrics from the “outside” of your instance—data going in and out. The Agent will collect metrics from all available network devices, and the ‘average’ function is now calculating the average across all devices (I have two for this instance)
Back into the editor, scoping the query for the same network interface CloudWatch will report on:
...
{
"q": "aws.ec2.network_in{host:i-123456} / 60"
},
{
"q": "system.net.bytes_rcvd{host:i-123456,device:eth0}"
}
...
Will show a much better picture, with comparable values:

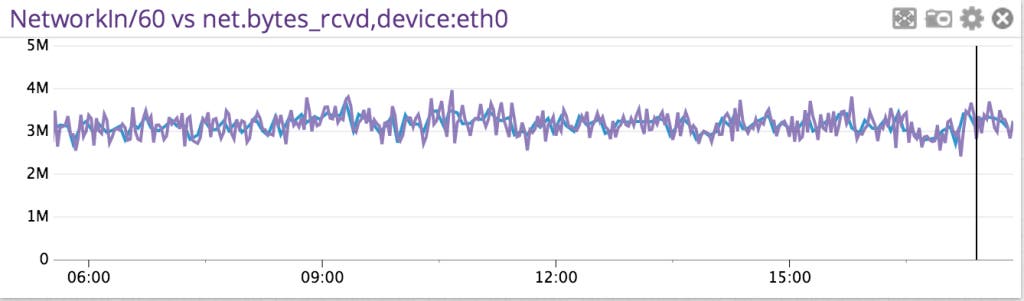
Mystery solved, values are normal.
Using tags as query dimensions for comparison is very useful when you’re used to looking at one value in one place, and now there’s another similar value, which is reported slightly differently.
Having the Agent installed allows further integrations beyond system-level metrics, such as monitoring database performance or web servers. The Agent also provides a local StatsD endpoint for applications to report the customer’s metrics to Datadog in a non-blocking fashion, flushing every 10 seconds.
To gain the additional data collection capabilities for your AWS CloudWatch metrics mentioned in this post, sign up for Datadog’s free trial, and deploy the Agent on your EC2 instances.
If you want to learn more about the Agent, read this post on that topic.
此内容由惯性聚合(RSS阅读器)自动聚合整理,仅供阅读参考。 原文来自 — 版权归原作者所有。