


Microsoft Azure Storage is a cloud-based service that is designed to deliver highly available, geographically redundant storage for on-premise and cloud applications. Azure Storage offers client libraries for various languages, including PHP, Java, Python, and Ruby.
If you’re using Azure Storage, you will want to track its usage and get notified about any issues before the services and applications that rely on Azure Storage start to fail or degrade. That’s why we are pleased to announce that we have added Azure Storage to the growing list of Microsoft Azure cloud services that you can monitor with Datadog.
General-purpose Azure Storage accounts have access to four services that address different needs:
Azure Storage offers several data redundancy options: locally redundant storage (multiple copies of your data in the same facility), zone-redundant storage (redundancy across multiple facilities), and geo-redundant storage (replication across more than one region).
Datadog’s Azure Storage integration surfaces dozens of metrics that you can graph, alert on, or visualize in several out-of-the-box dashboards, including:
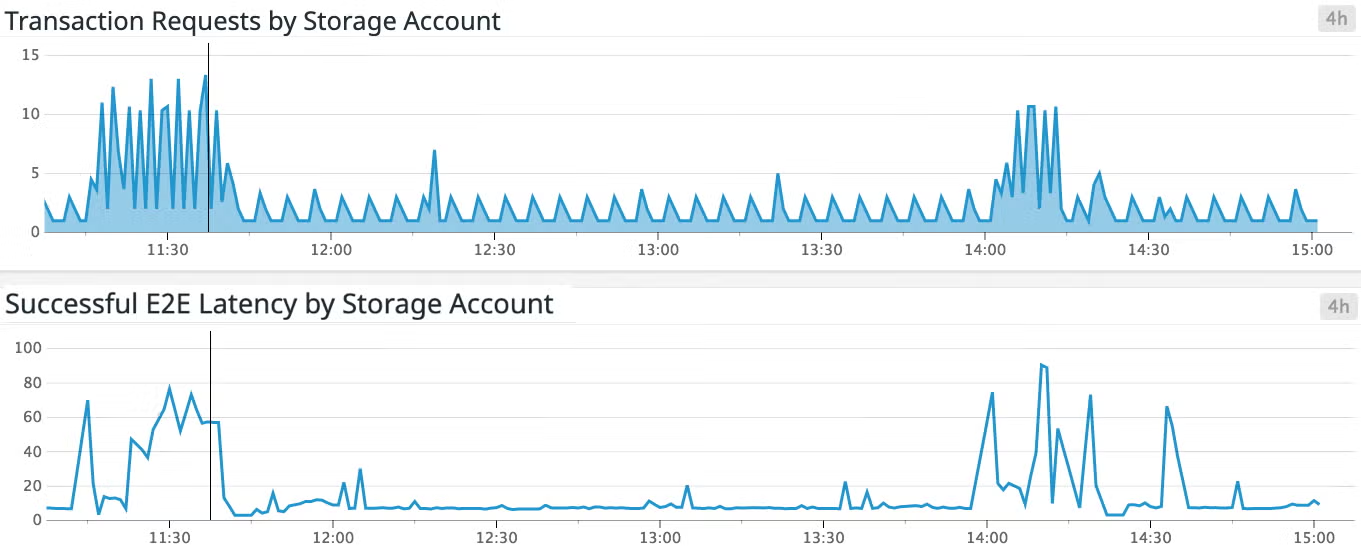
In addition to Azure Storage, Datadog also integrates with other Microsoft cloud services—including Azure Redis Cache, Azure App Service, and Azure SQL Databases—to give you a comprehensive view of your entire Azure infrastructure.
If you are using Azure Resource Manager (ARM) to organize and manage your services, Datadog will automatically pull in resource metadata so that you can aggregate and filter your metrics using those same logical groups.
The integration automatically pulls in the following tags for all of your Azure Storage resources: resource_group, region, name, tenant_name, and subscription_name (e.g., pay as you go). It will also pick up any custom tags you may have added to your Azure resources through the Azure portal.
You can use these tags to filter and customize your dashboard to zoom in on specific subcategories of your Azure Storage resources. For example, in the screenshot below, we filtered the Azure Blob Storage dashboard to only display metrics from the andredemo resource group.
Tags are also instrumental for creating targeted alerts that can help you surface insights and identify trends across specific subsets of your Azure resources.
For example, you could create an alert to get notified when an important resource group starts to experience an increased rate of throttling errors. If this issue is not temporary (e.g., someone is conducting load tests), you may want to look into optimizing your queries and/or repartitioning data so that you can distribute transactions across more than one partition. The service documentation contains more guidelines for troubleshooting issues like this once you’re alerted to them.
If you’re already using Datadog and you’d like to start monitoring Azure Storage, simply set up the main Azure integration, if you haven’t done so already.
If you’re not currently using Datadog, but would like to get deeper visibility into your Azure cloud infrastructure and services, get started with a free 14-day trial.
此内容由惯性聚合(RSS阅读器)自动聚合整理,仅供阅读参考。 原文来自 — 版权归原作者所有。