


Engineering teams that manage high-volume log sources, such as content delivery network (CDN) edges, streaming platforms, and authentication systems, often have to make a difficult retention tradeoff. Indexing every event keeps logs searchable during investigations, audits, and postmortems, but it can make long-term retention expensive. Archiving those logs in object storage helps control costs, but it often moves historical investigations into a separate query environment, such as Amazon S3 with Athena, a secondary data lake, or a dedicated CDN analytics tool. This fragmentation forces teams to work with a secondary query language, access control model, and operational context.
Datadog Observability Pipelines and Archive Search provide a cost-conscious pattern for retaining and investigating high-volume CDN logs. You can use Observability Pipelines to process and route raw edge logs to object storage while sending key metrics and high-signal events to Datadog for monitoring and alerting. When an investigation requires historical context, Archive Search lets you query archived logs from Datadog, helping teams keep CDN data accessible without indexing every event for long-term retention.
In this post, we will show you how to:
Route high-volume logs to low-cost storage with Observability Pipelines
Analyze archived logs in Datadog during incidents
CDN access logs record every request handled at the edge, including client IP, request path, response status, and cache behavior. At streaming scale, where each video chunk can generate a separate HTTP request, these logs can reach tens of terabytes per day. Teams need to retain this data for network forensics, performance investigations, audits, and postmortems, but indexing all of it for long retention periods is expensive.
Video platforms and other high-volume streaming services typically run multiple CDNs in every region and shift traffic between them as conditions change—sometimes mid-event. When an incident spans multiple providers, no single portal contains the full edge context an investigation requires. Teams often archive CDN logs to object storage to retain that data without indexing every event.
Raw CDN logs can be difficult to operationalize quickly. Providers such as Cloudflare and Akamai use different formats, field names, and structures. To make those logs usable across providers, teams often need to build parsing rules, map provider-specific fields to a common schema, and configure routing logic before teams can query or monitor the data consistently during an incident.
Observability Pipelines Packs reduce that setup work. For common CDN sources like Cloudflare and Akamai, Observability Pipelines Packs include prebuilt parsing and processing logic that normalizes log formats, extracts useful attributes, and prepares events for routing or metric generation. Instead of building each processor from scratch, an SRE can start from a working pipeline, customize it for their environment, and route noisy raw events to object storage while sending high-signal metrics and alerts to Datadog.
With Observability Pipelines, you can process, filter, and route logs before sending them to downstream systems, helping you control volume and reduce indexing costs. For example, you can configure CDN providers like Cloudflare to stream logs directly into Observability Pipelines by using Logpush. From there, Observability Pipelines can process and route logs in real time, sending high-volume edge logs to low-cost storage while forwarding key signals to Datadog for monitoring and alerting.
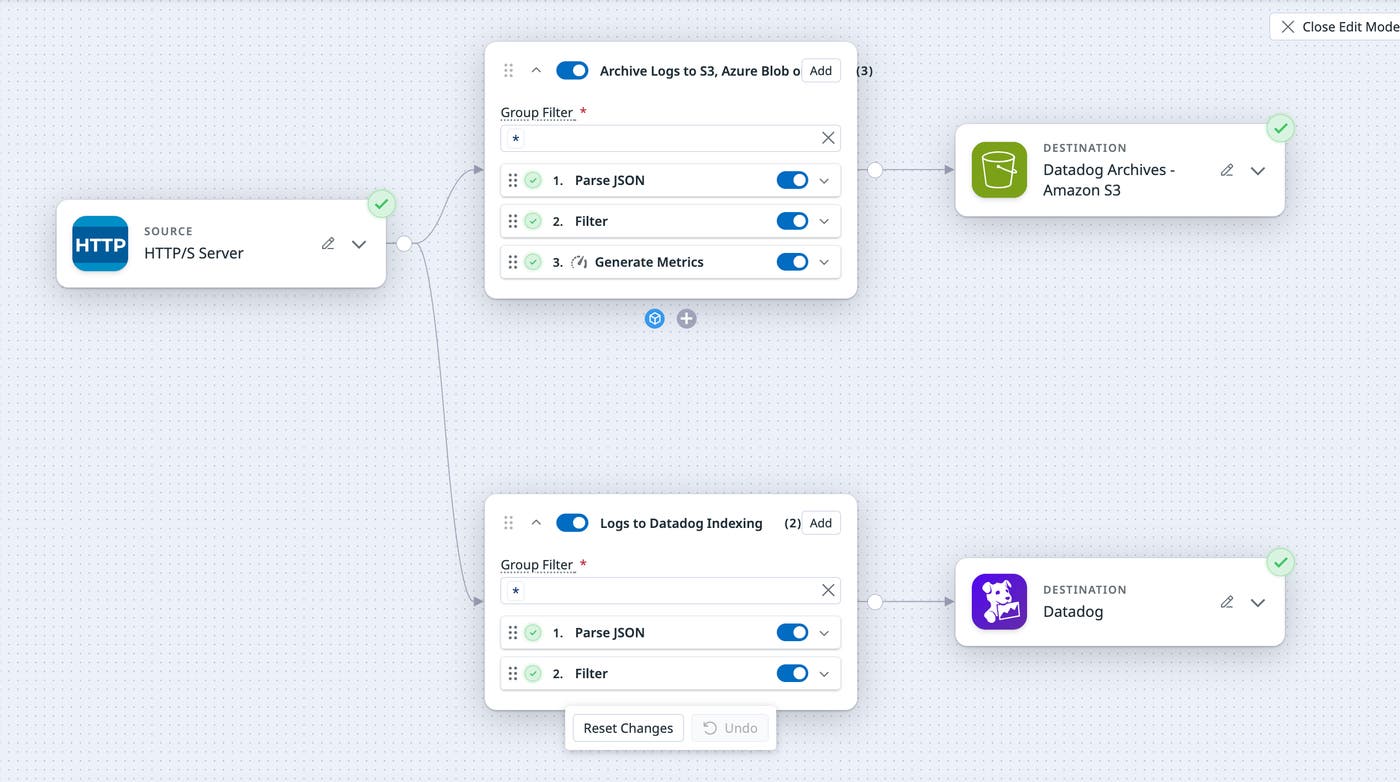
You can split log traffic based on status, source, or custom attributes like env:production or team:platform. High-volume CDN access logs that are essential for network forensics—such as reconstructing traffic during a DDoS event or tracing geographic attack patterns—can route directly to object storage. Higher-signal logs, such as application errors and security alerts, can route to Datadog for indexing.
For many CDN log use cases, teams care about aggregated signals such as request rates, error counts, top source IPs, BotScore buckets, WAFAttackScore rates, and cache-miss rates by region. Observability Pipelines can generate metrics from these logs in transit and route those metrics to Datadog, while raw events land in cloud storage.
By choosing bounded dimensions such as status code classes, action types, and region groupings, teams can keep metric cardinality predictable as traffic scales. The raw archive still preserves unbounded questions, such as per-IP, per-user, and per-session investigations, for Archive Search when a metric signals a problem.
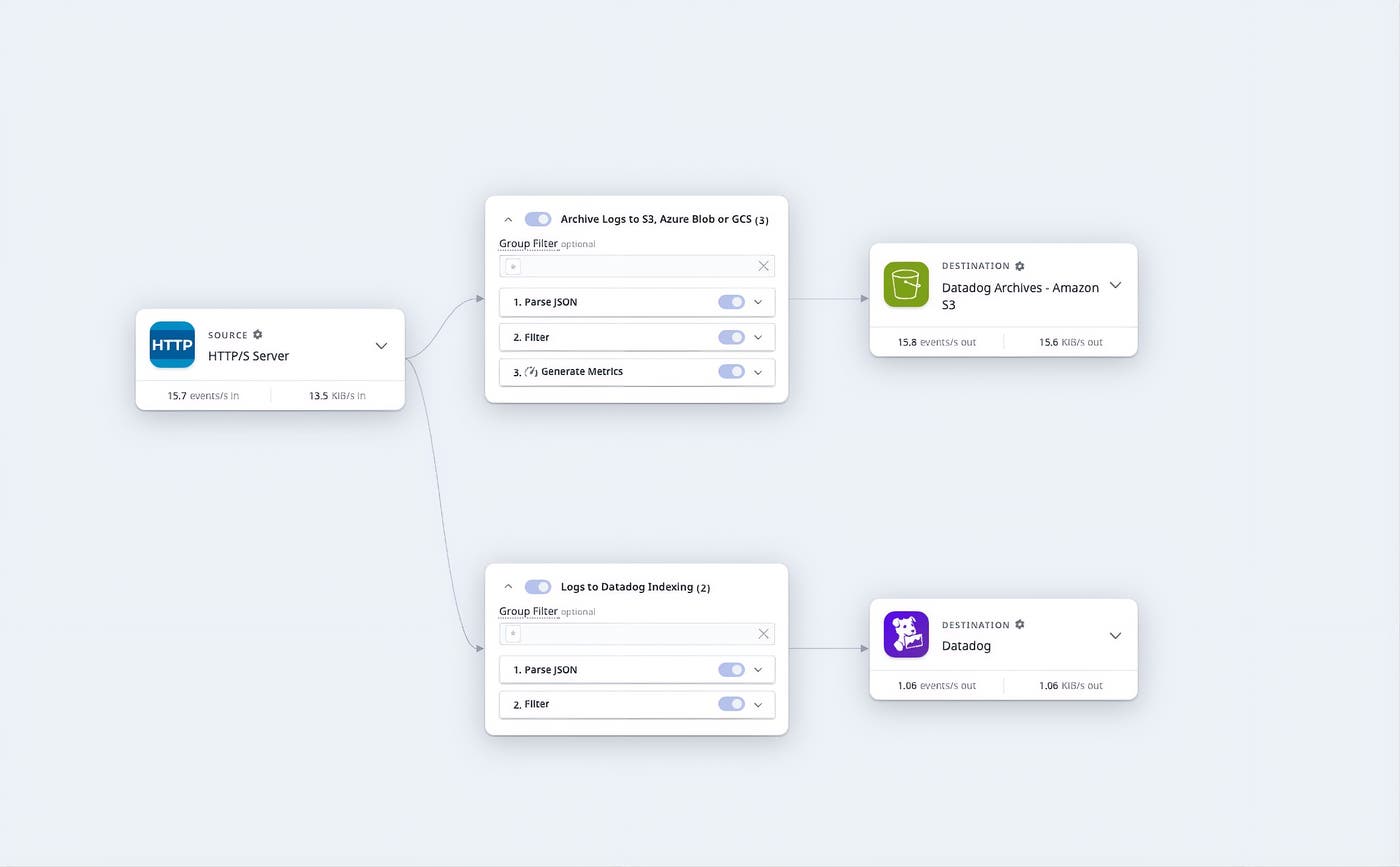
Beyond routing, Observability Pipelines can normalize and enrich logs in transit by parsing unstructured formats, standardizing field names, and enriching events with host or environment metadata. You can also pull in external context. For example, ServiceNow CMDB enrichment adds owning team, service tier, and dependency information to every event at the time it was emitted.
The same pipeline can also apply to player-side telemetry data. CDN access logs record what was served but do not show how the player handled that content, such as whether playback buffered, dropped bitrate, or failed. Common Media Client Data (CMCD) helps close that gap by enabling streaming clients to attach player state, such as buffer length, requested bitrate, and session ID, to segment requests.
Routed through Observability Pipelines, CMCD events follow the same path as the rest of the CDN data: Bucketed metrics like rebuffer rate and bitrate distribution route to Datadog for dashboards and alerts, raw events stay in object storage, and Archive Search reaches into them when a metric needs to be tied back to specific sessions or edge points of presence (POPs).
Because Observability Pipelines runs on-premises, you can detect and redact personally identifiable information (PII) before logs leave your environment. Observability Pipelines writes to your object storage in Datadog’s native archive format, which makes it compatible with Archive Search without a separate reprocessing step.
During an investigation, teams often need to determine whether a similar issue has occurred before. A buffering spike during a live event, a surge of failed logins from a new region, or an anomalous error rate on a specific edge POP can all require moving from a real-time signal into months of historical context. The speed of that pivot determines how quickly an incident can be diagnosed—and how often historical analysis gets used at all.
Most CDN investigations are not catastrophic outages. They are often slower regional degradations, a single Autonomous System Number (ASN) spiking overnight, or a cache-hit ratio that drifts a few points and quietly inflates origin egress. These are the cases where teams skip the investigation altogether if the data lives in a separate tool. Bringing Archive Search into the same observability workflow makes that historical context practical to use.
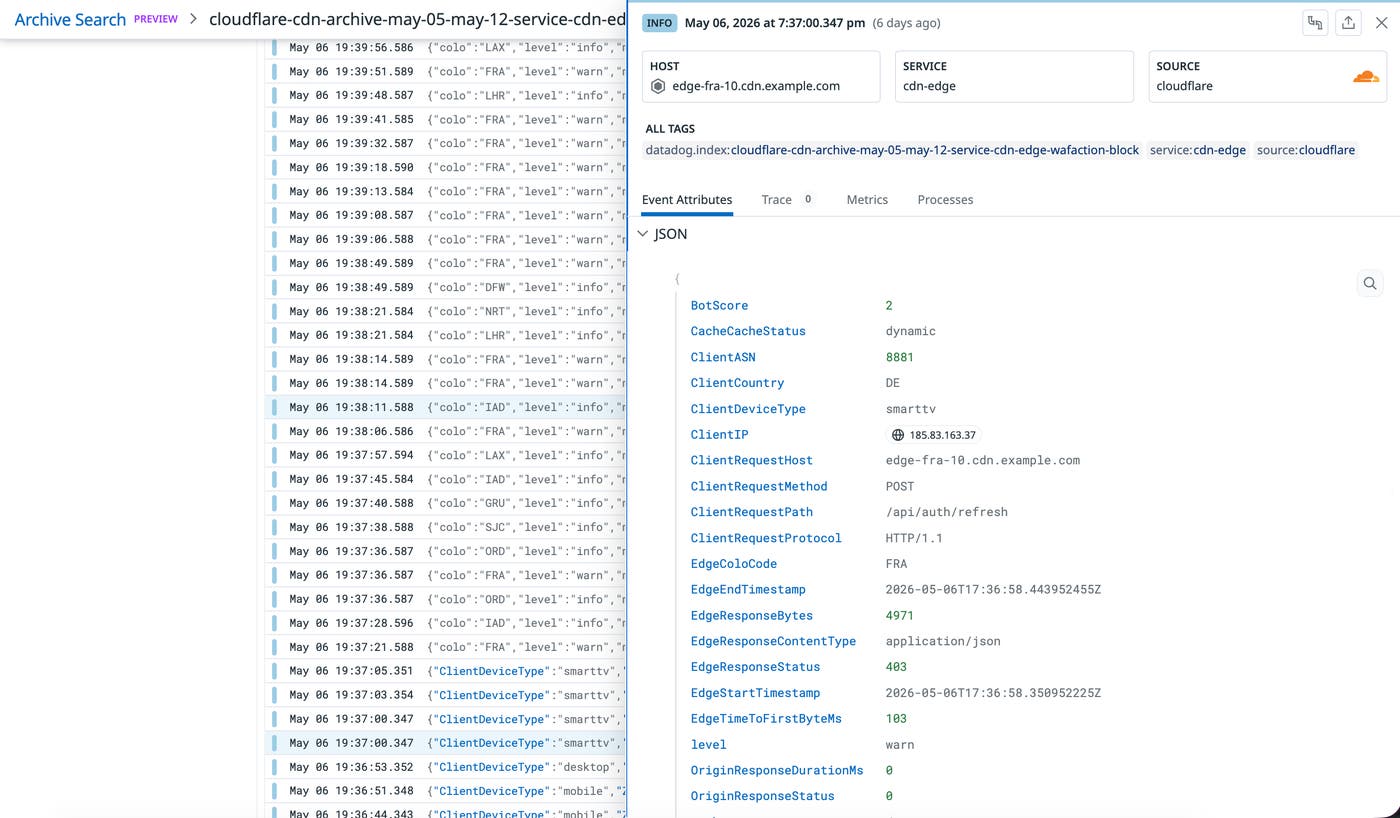
Consider a high-profile live streaming event that attracts both legitimate traffic and bad actors. The on-call engineer runs service:cdn-edge AND @WAFAction:block over the event window, to check for credential stuffing, scraping, or password-spray attempts that occurred during the traffic surge. With Archive Search, the engineer can query logs stored in object storage directly from Datadog without switching to a separate analytics tool.
Before the scan begins, Archive Search includes a Query Preview feature that returns log samples before committing to a full archive scan. The engineer can use the Query Preview to confirm query syntax, time range, and filters before incurring scan compute costs. This is especially useful when working with archives that contain large compliance or security events spanning weeks or months.
Archive Search can also use partitions and lookup attributes to reduce scan scope. Partitions group logs by attributes such as date and service. When you configure partition attributes, Archive Search can skip blocks of data outside the query’s scope. Lookup attributes work similarly to database indexes, pre-filtering results before a full scan. Together, these options reduce scan time across large datasets in object storage.
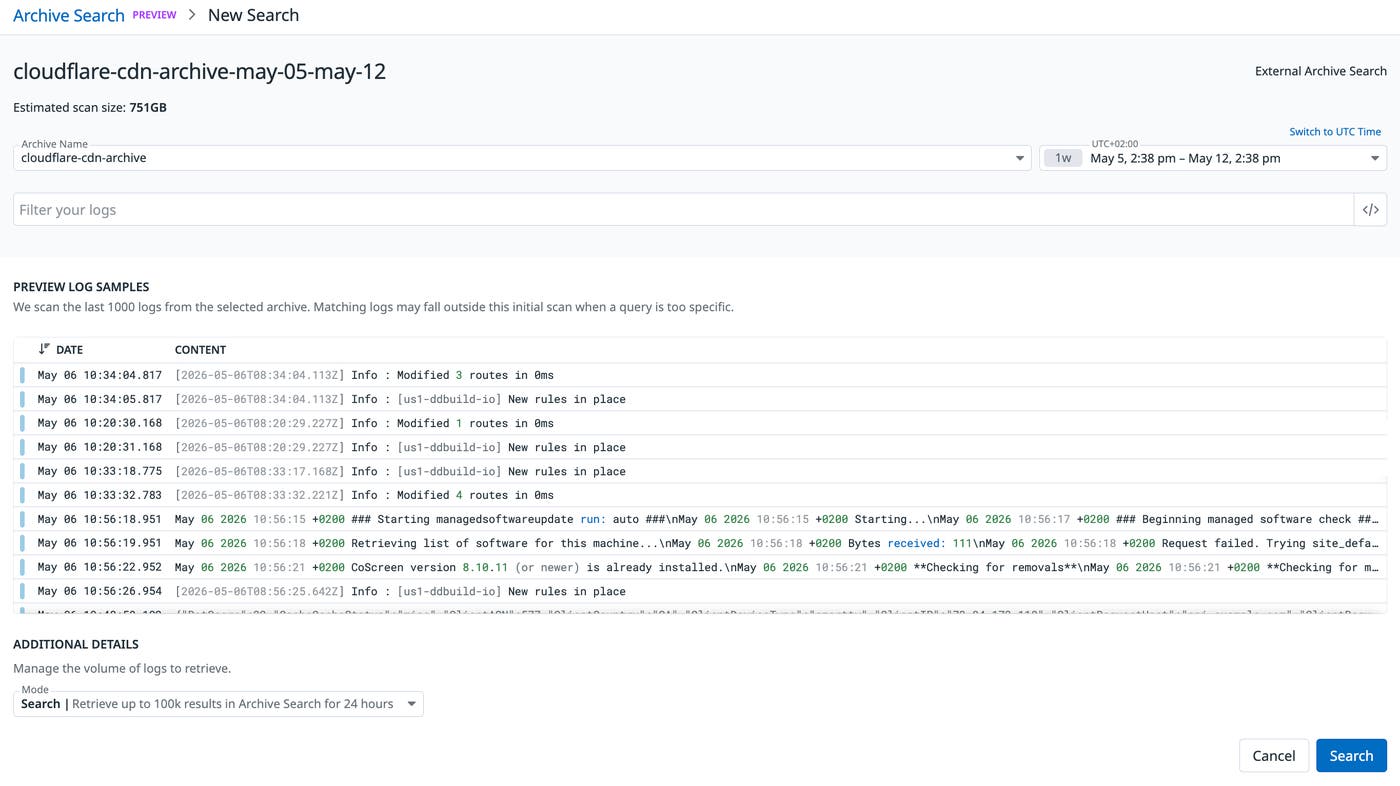
After the engineer runs the search, results stream back into a familiar Datadog view with client IP, country, ASN, and request-path context. Because Archive Search operates inside the same observability workflow, teams can investigate historical CDN logs by using the same identities, access controls, and operational context already used for dashboards, monitors, and incident response.
If the engineer is also investigating indexed application logs, they can pivot from any blocked edge event to the application response that followed—all in the same UI, using the same search syntax. Archive Search makes long-tail patterns visible by using the same query surface. A regional cache-hit ratio that has quietly drifted from 99% to the high 80s, for example, can mean hundreds of gigabytes of unnecessary origin egress every day before anyone notices. This is exactly the kind of slow drift that goes unseen until someone pulls the underlying logs.
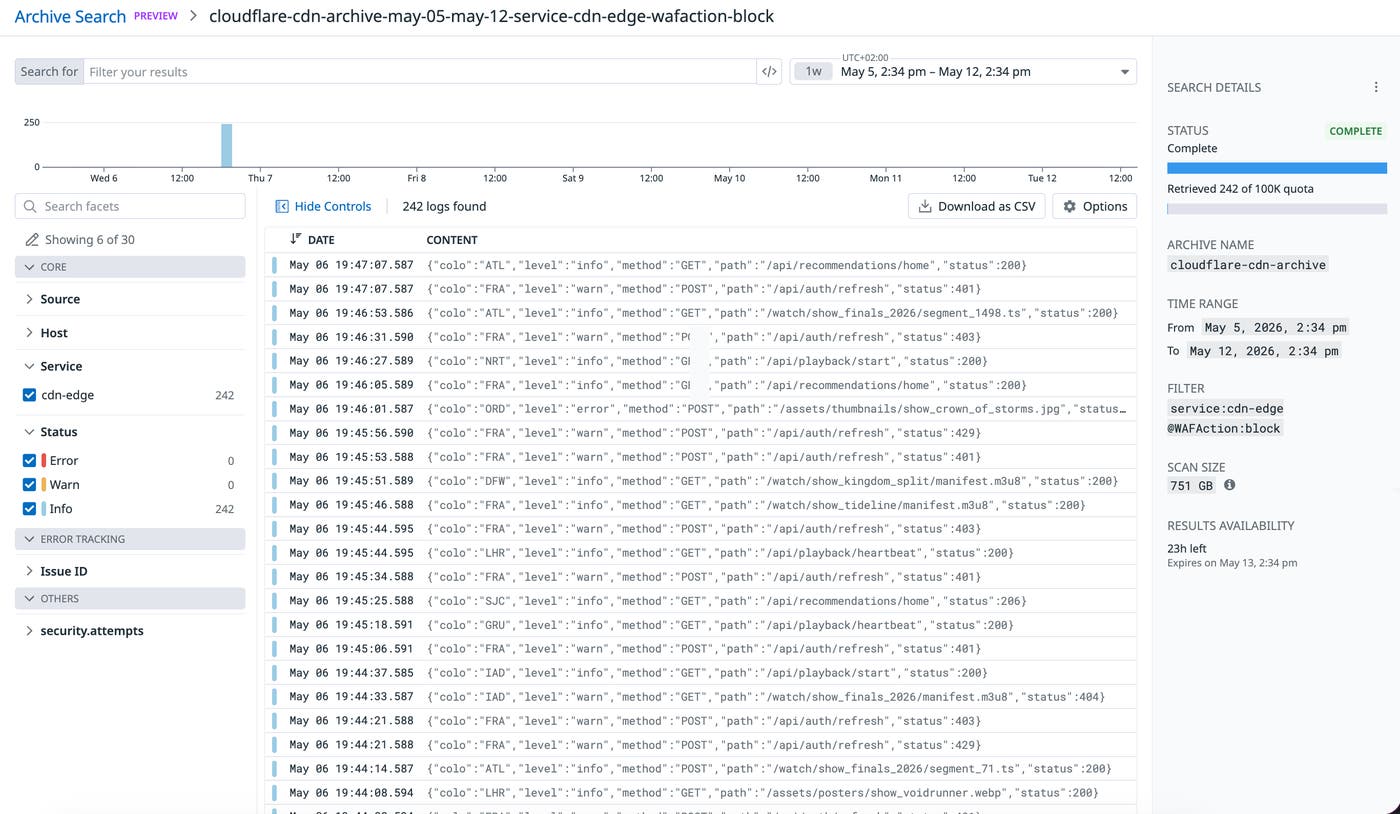
Archive Search uses the same search syntax and log facets that teams already use in Log Explorer. After a query runs, results are retained for 24 hours at no additional cost. From there, teams can re-index a targeted subset back into Datadog for deeper analysis or export results to CSV for offline investigation and stakeholder review.
In this example, Archive Search scanned 751 GB of archived data and isolated 242 relevant logs by targeting service:cdn-edge and an event type such as @WAFAction:block. With that narrowed result set, an engineer can reconstruct the timeline of a potential attack and review the specific source IPs, regions, ASNs, and request paths involved. The value goes beyond lower indexing volume—Archive Search lets teams move from a real-time signal to historical evidence without changing tools or query languages.
High-volume CDN logs are too important to discard, but they are often too expensive to index in full for long retention periods. By using Observability Pipelines with Archive Search, teams can route raw CDN logs to low-cost object storage, generate metrics from those logs in transit, and search archived events in Datadog when investigations require historical context.
To get started, read the Observability Pipelines documentation and the Log Archives documentation.
If you’re new to Datadog, you can sign up for a 14-day free trial.
此内容由惯性聚合(RSS阅读器)自动聚合整理,仅供阅读参考。 原文来自 — 版权归原作者所有。