


Henrik Engström
This is a guest post written by Henrik Engström, Senior Software Engineer at Lightbend.
Lightbend and Datadog are excited to announce the official Datadog integration for Akka. Both Akka and the Lightbend Reactive Platform (which includes Akka as a key component) have become increasingly popular for building highly scalable Reactive applications on the JVM. With this integration, Datadog users building Akka-based Reactive applications can gain real-time insights to ensure the health, availability, and performance of their applications.
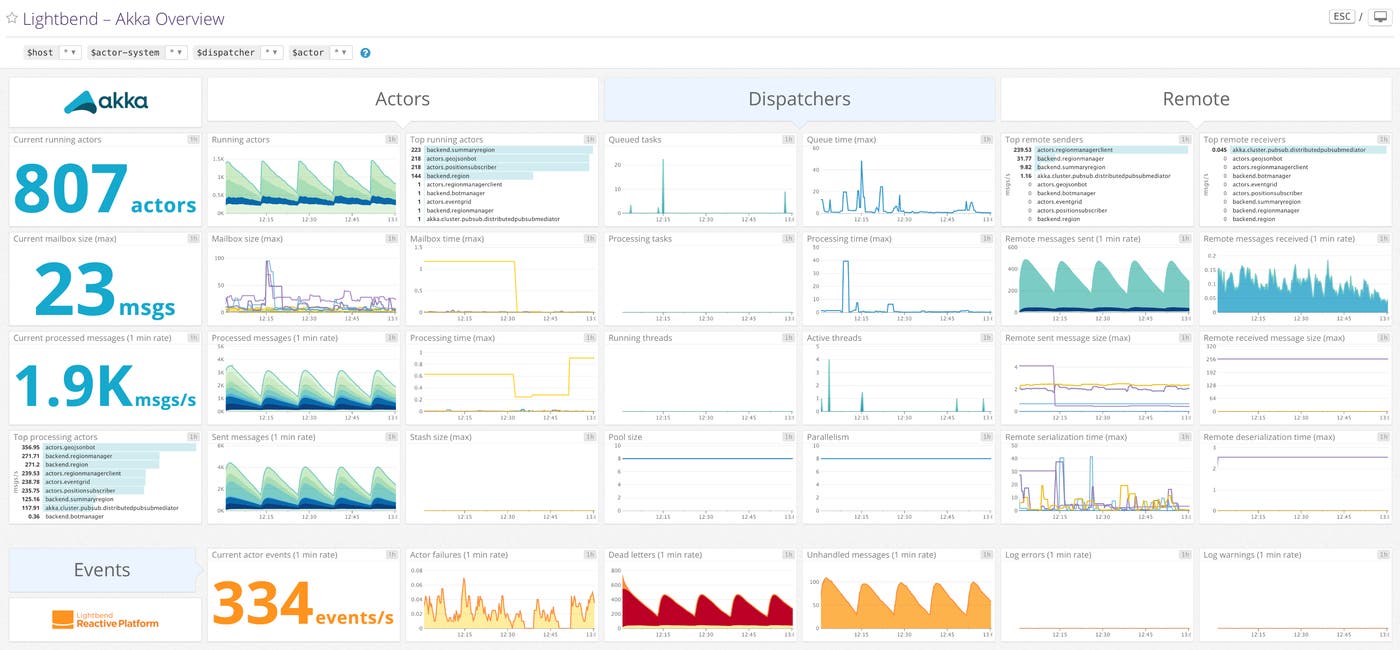
This integration works via Lightbend Monitoring, which includes a metrics/telemetry module (nicknamed “Cinnamon”). The telemetry instruments your Akka-based Reactive application and reports metrics to Datadog. At this time, the telemetry for this integration includes metrics for Akka Actors and metrics for Akka Remote.
Metrics for Akka Actors include actor mailbox size, the time messages spend in the mailbox, and processing time for messages.
Metrics for Akka Remote include rates, sizes, and serialization times for remote messages.
There are multiple configuration options for the telemetry portion so you can determine the level of visibility you need into your Akka-based Reactive application. This provides you with greater control over the monitoring overhead and the volume of monitoring data reported to Datadog.
Note that Lightbend Monitoring is part of the Lightbend Reactive Platform, and is available to Lightbend subscription customers only. If you want to learn more about the benefits of a Lightbend subscription, go here.
To get started, set up your application with the Datadog instrumentation plugin for Lightbend Monitoring, configure the Akka telemetry, and then install the Lightbend Reactive Platform integration in your Datadog account. This gives you access to a predefined dashboard to help you jump-start the monitoring of your Reactive applications.
Here’s what the dashboard looks like:
The Lightbend and Datadog teams will continue to enhance this integration going forward. You’ll see these enhancements, mostly in the form of additional Reactive application metrics, being reflected in your Datadog dashboards. If you’re interested in receiving a short demo of Lightbend Monitoring, discussing specific enhancements or features, and learning how to get Lightbend Monitoring with Datadog in your own organization, we would love to hear from you.
Lightbend provides the leading Reactive application development platform for building distributed applications. Using microservices and fast data on a message-driven runtime, enterprise applications scale effortlessly on cloud computing architectures. Many of the most admired brands around the globe are transforming their businesses with our platform, engaging billions of users every day through software that is changing the world.
此内容由惯性聚合(RSS阅读器)自动聚合整理,仅供阅读参考。 原文来自 — 版权归原作者所有。