





Load balancers are the primary entry points to distributed applications. By strategically directing the flow of incoming web traffic to specific endpoints, load balancers help optimize throughput and ensure the horizontal scalability of applications. In modern systems, load balancers often do more than their name suggests: Beyond basic load distribution, they analyze requests and route traffic based on a wide range of variables, such as client identity. They are also often responsible for implementing critical security mechanisms—for example, decrypting traffic at the edge to block malicious payloads—and performing system health checks. All of this means that load balancers generate some of the highest volumes of logs in modern environments.
In this post, we’ll help you understand and strategically monitor your load balancer logs. There are many types of load balancers, and their logs are varied in both structure and content. We’ll focus on load balancers where they are most commonly implemented, in layers 4 and 7 of the OSI model: the transport layer and the application layer. We’ll examine the anatomy of both application (layer 7) and network (layer 4) load balancer logs, highlight key patterns to watch for, and discuss how Datadog Log Management and Observability Pipelines can help you manage and effectively use your load balancer logs.
Application load balancers (ALBs) belong to layer 7 of the OSI model. They sit directly in front of HTTP and gRPC application resources, fielding and analyzing client requests and directing them to specific backend endpoints based on variables such as backend availability, request paths, headers, cookies, and client identity. The primary unit of traffic for ALBs is the HTTP or gRPC request. As such, ALB performance is typically measured in terms of request-level metrics: end-to-end and target latency, error rates, and request volume. ALBs may perform health checks to answer questions such as, “Is the /health endpoint returning 200?”
Network load balancers (NLBs) belong to layer 4 of the OSI model. They sit in front of transport-level entry points and route connections based on IP addresses, ports, and protocol. They are typically used for low-overhead, high-throughput forwarding at very high scale and for non-HTTP traffic (TCP/UDP/TLS). The primary unit of traffic for NLBs is the connection or network flow. As such, NLB performance is typically measured in terms of flow-level metrics: throughput, new and active connections, and connection errors and timeouts. NLBs may perform health checks to answer questions such as, “Is port 8080 open and accepting connections?”
Let’s look at a typical ALB access log, using an example from AWS Elastic Load Balancing (ELB):
https 2026-02-24T23:39:44.112345Z app/my-alb/50dc6c495c0c9188 198.51.100.23:49821 10.0.2.18:80 0.000030 0.003451 0.000019 200 200 234 1024 "GET https://example.com:443/api/v1/items?limit=10 HTTP/1.1" "Mozilla/5.0 (Macintosh; Intel Mac OS X 10_15_7) AppleWebKit/605.1.15" ECDHE-RSA-AES128-GCM-SHA256 TLSv1.2 arn:aws:elasticloadbalancing:us-east-1:123456789012:targetgroup/example/abcdef1234567890 "Root=1-55555555-aaaaaaaaaaaaaaaaaaaaaaaaaaaaaaaa" "example.com" "arn:aws:acm:us-east-1:123456789012:certificate/12345678-1234-1234-1234-123456789012" 0 2026-02-24T23:39:44.108000Z "forward" "-" "-" "10.0.2.18:80" "200" "-" "-" TID_abc314def567890
Like most ALB access logs, this log comes in the form of a space-delimited string; the content of this string is also typical of ALB logs. By analyzing it, we can take stock of the visibility ALB logs provide in general. In the below table, we map normalized keys (prioritizing OpenTelemetry (OTel) semantic conventions as a vendor-neutral framework where possible) to the fields in the AWS ELB log shown above to outline the general anatomy of an ALB log.
| Normalized key | AWS ELB log field | Meaning and sample use cases |
|---|---|---|
lb.protocol.type(custom) | type | Request type as recorded by the vendor. Use to segment behavior by protocol. |
timestamp or response.timestamp(custom) | time | Time at which the ALB responded to a request. Correlate events across your stack. For example, compare with app-level or database logs to analyze the ripple effect of a specific request. (For the time a request was received by the ALB, use request_creation_time). |
cloud.resource_id or lb.name(custom) | elb | ALB resource identifier (not necessarily an ARN). Essential in multi-tenant or microservice environments. For example, pinpoint which entry points are under stress in microservice environments. Because cloud.resource_id is intended for cloud provider-specific native identifiers, you may want to use a custom OTel attribute for other types of names. |
client.address, client.port | client:port | Client (or proxy) address. Identify who is making the request and distinguish individual TCP connections. Pinpoint DDoS attack sources, scrapers, or noisy neighbors hitting your API too frequently. If a proxy sits in front of the ALB, you may need forwarded headers to get the original client. |
lb.target.address, lb.target.port(custom) | target:port | Backend target address. Identify which instance handled the request. Useful for tracing errors or latency to specific backends. |
lb.request_processing.duration(custom) | request_processing_time | Time from when the ALB received the request until it sent it to a target (or -1 when it can’t dispatch). |
lb.target_processing.duration(custom) | target_processing_time | Time from when the ALB sent the request to the target until it received response headers. Primarily reflects application processing time (the time spent in your code) but also includes network latency between the ALB and the target. May be used to identify slow API endpoints or unoptimized database queries. |
lb.response_processing.duration(custom) | response_processing_time | Time from when the ALB received response headers from the target until it started sending the response to the client. |
http.response.status_code | elb_status_code | Status code the user saw. A 502 here when the target_status_code is - (not recorded) means the ALB did not record a response from the target. |
lb.target.response.status_code(custom) | target_status_code | Status code from your app. If this is 500, your code crashed; if this is 200 but elb_status_code is 504, the app responded too late and the ALB timed out. |
http.request.size | received_bytes | Size of incoming request (headers and body). Detect abnormally large requests that might indicate a buffer overflow attack or a misconfigured client. |
http.response.size | sent_bytes | Size of outgoing response (headers and body). Monitor for data exfiltration (unusually large responses) and calculate your bandwidth/egress costs. |
http.request.method, network.protocol.version | request_line | HTTP method and protocol version. |
url.full | request_line | The full absolute URL. Pinpoint the exact endpoint hit by each request to help determine which specific features (e.g., /search vs /checkout) are being used the most or failing most often. Sensitive query parameters should be redacted before storage. |
user_agent.original | user_agent | Client browser/device info. Identify client compatibility issues (perhaps errors are only happening on a specific browser version, e.g., “Safari 15”) or bots masquerading as humans. |
tls.cipher | ssl_cipher | **Cipher suite implemented during the TLS handshake**. Validate cryptographic hygiene. Note that AWS emits OpenSSL-style cipher names, while tls.cipher only accepts IANA-registered values. Normalization may be necessary for OTel compliance. |
tls.protocol.name, tls.protocol.version | ssl_protocol | TLS protocol implemented. Parse for OTel. |
lb.target_group.arn(custom) | target_group_arn | Target group that routed the request. Useful for correlating with target health/scaling and isolating misrouted traffic. |
lb.trace_id(custom) | trace_id | ALB trace identifier. Useful correlation device. |
server.address | domain_name | SNI domain for the request (when present). Useful on multi-domain ALBs. |
tls.server.certificate.arn(custom) | chosen_cert_arn | Certificate selected for HTTPS. - for non-TLS. |
lb.rule.priority(custom) | matched_rule_priority | Priority of matched listener rule. Useful for routing debug and other investigations. |
lb.request.creation_time(custom) | request_creation_time | Time ALB received the request. Distinct from time (response generation). Use for timing/ingestion delay reasoning. |
lb.actions.executed(custom) | actions_executed | Actions executed for the request (forward/redirect/fixed-response/auth/etc., depending on listener rules). Useful for debugging rule behavior. |
lb.redirect_url(custom) | redirect_url | Redirect target URL. Populated when a redirect action is executed. |
error.reason(custom) | error_reason | Vendor-provided reason string for certain errors. Critical for disambiguating 4xx/5xx cases when populated. |
lb.target.port_list(custom) | target:port_list | List of targets involved when multiple targets/retries occur. |
lb.target.status_code_list(custom) | target_status_code_list | **Parallel list to target:port_list.** Useful when diagnosing retries or failover behavior. |
http.request.classification(custom) | classification | Request classification. |
http.request.classification_reason(custom) | classification_reason | Classification reason. |
lb.connection.trace_id(custom) | conn_trace_id | Unique, opaque trace ID linking access logs to connection logs. Correlate connection and access logs. |
When a connection fails before it reaches your app, you may need to consult a separate log stream. For example, AWS ELB emits connection logs in a separate stream that is disabled by default. Below, we break down the some of the key components of ALB connection and security logs not already covered in the above table:
| Normalized key | AWS ELB log field | Meaning and sample use cases |
|---|---|---|
server.port | listener_port | Listener receiving the request. |
lb.tls.handshake.duration(custom) | tls_handshake_latency | Time to secure the connection. May indicate client round-trip time (RTT), network latency, or load balancer capacity constraints. |
lb.tls.verify.status(custom), error.type | tls_verify_status | The result of TLS verification and the reason for the outcome. |
Next, let’s look at the key elements of NLB logs. NLBs typically emit logs that focus less on individual client requests and more on transport- and infrastructure-level health signals. As an example, we’ll consider Azure Load Balancer health event logs, which are designed to help you monitor and troubleshoot these signals. These events are available through Azure Monitor via the LoadBalancerHealthEvent category. Below is an example health event log:
{
"TimeGenerated": "2026-02-27T17:00:15.314102Z",
"operationName": "LoadBalancerHealthEvent",
"LoadBalancerResourceId": "/SUBSCRIPTIONS/SUB_ID/RESOURCEGROUPS/PROD-RG/PROVIDERS/MICROSOFT.NETWORK/LOADBALANCERS/MY-NLB",
"FrontendIP": "40.83.190.158",
"HealthEventType": "NoHealthyBackends",
"Severity": "Critical",
"Description": "Load balancer has no healthy backends to distribute traffic to (per configured health probes)."
}
The form of this log is characteristic of modern NLB health logs. It includes an event type and a severity level, specifies the affected load balancer and frontend, and provides a human-readable description. Again, we’ll map this log to normalized keys, using OTel semantic conventions where possible:
| Normalized key | Azure log field | Meaning and sample use cases |
|---|---|---|
timestamp(standard log field) | TimeGenerated | Time the NLB detected the health event. Correlate with deployments, reboots, network incidents, and metrics. |
lb.operation.name(custom) | operationName | The name of the operation logged by the event. |
cloud.resource_id | LoadBalancerResourceId | The full path to the NLB. Distinguish between development, staging, and production load balancers in large environments. |
lb.frontend.address(custom) | FrontendIP | Frontend IP affected. Pinpoint the issue to a specific entry point. |
lb.event.type(custom) | HealthEventType | Category of health event. Filter and alert by event type. |
lb.event.severity(custom) | Severity | Severity of health event. Supports tiered alerting. |
message(standard log field) | Description | Human-readable details of the event. |
The above tables cover the key elements of ALB (layer 7) and NLB (layer 4) logs, and the OTel semantic keys we’ve provided can be mapped to logs from other kinds of load balancers. These elements can be essential to tracking the health of distributed systems. Below are some basic monitoring recommendations based on key patterns to watch for in your load balancer logs.
Monitor for sudden spikes in error rates, which usually indicate a failure in your application logic or infrastructure.
5xx errors: These errors usually signal that the backend application is crashing or timing out, or that the load balancer cannot find a healthy resource. Watch for cases where the elb_status_code is 5xx and target_status_code is -, which may indicate a lack of healthy backend targets, connection errors, or malformed requests.
4xx errors: Frequent 403s or 404s can be the first sign of a security threat, such as a vulnerability scanner or a brute-force attack targeting specific endpoints like /admin or /.env.
Monitor P95 and P99 latency in order to surface outlier performance issues and proactively identify degradation that could precede widespread outages. By correlating spikes in server processing time (lb.target_processing.duration) with backend IPs (lb.target.address), you can identify backend issues that may elude basic health checks.
For example, if a spike in latency is isolated to a single lb.target.address, you may have an instance that, despite passing health checks, is functionally broken (e.g., due to a memory leak or CPU contention).
Monitor for cases where an inordinate volume of traffic comes from one source or goes to one backend:
DDoS detection: If a single IP (client.address) accounts for a disproportionate share of requests (or bytes), it may be a malicious actor or a misconfigured third-party integration.
Unbalanced load: If one backend server (lb.target.address) is receiving significantly more traffic than its peers within the same target group (lb.target_group.arn), your session “stickiness” or hashing algorithm might be misconfigured, creating hotspots that could lead to cascading failures.
Monitor for handshake failures. High lb.tls.handshake.duration suggests that the load balancer is struggling with encryption overhead. Monitoring tls.protocol.version allows you to identify clients still using deprecated protocols like TLS 1.1 and assess whether or not you can safely deprecate them without breaking critical traffic.
As we’ve mentioned, load balancers are among the most prolific log sources in modern environments. Every request or connection generates telemetry data, much of which is redundant, such as successful request logs, health checks, or internal traffic. At the same time, downstream systems like SIEMs, data lakes, and analytics platforms often use ingestion-based pricing, making it expensive to retain all load balancer logs indiscriminately.
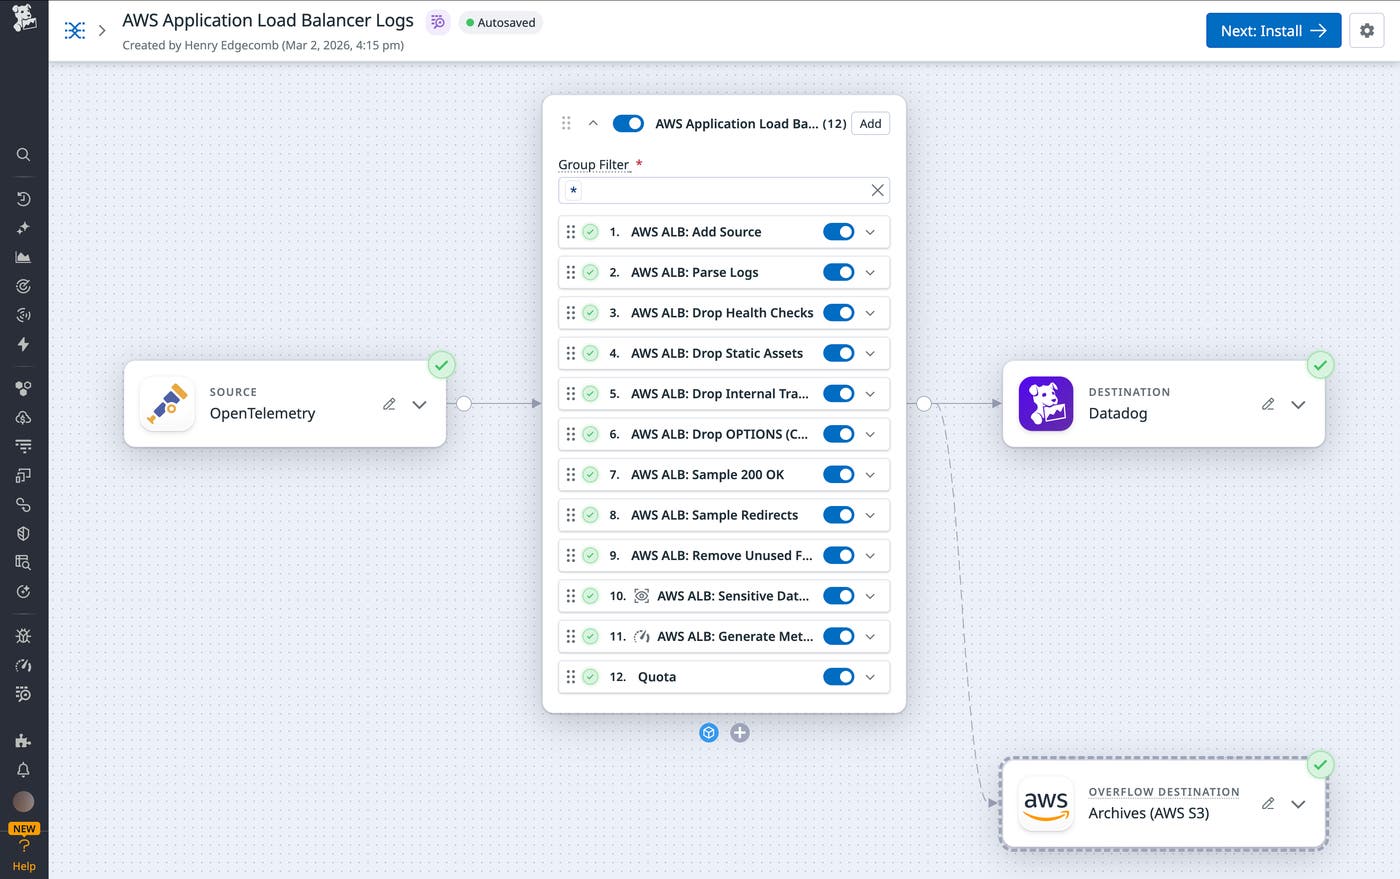
Datadog Observability Pipelines allows teams to process and transform logs before they are routed to downstream tools. Using pipelines, teams can parse raw logs, normalize fields, filter or sample events, and generate metrics, helping them reduce noise, control costs, and standardize data across environments.
Building and maintaining pipelines for high-volume sources like load balancers can require significant manual effort and deep knowledge of vendor-specific log formats. Packs, available within Observability Pipelines, address this challenge by providing predefined, ready-to-use pipeline configurations based on industry best practices.
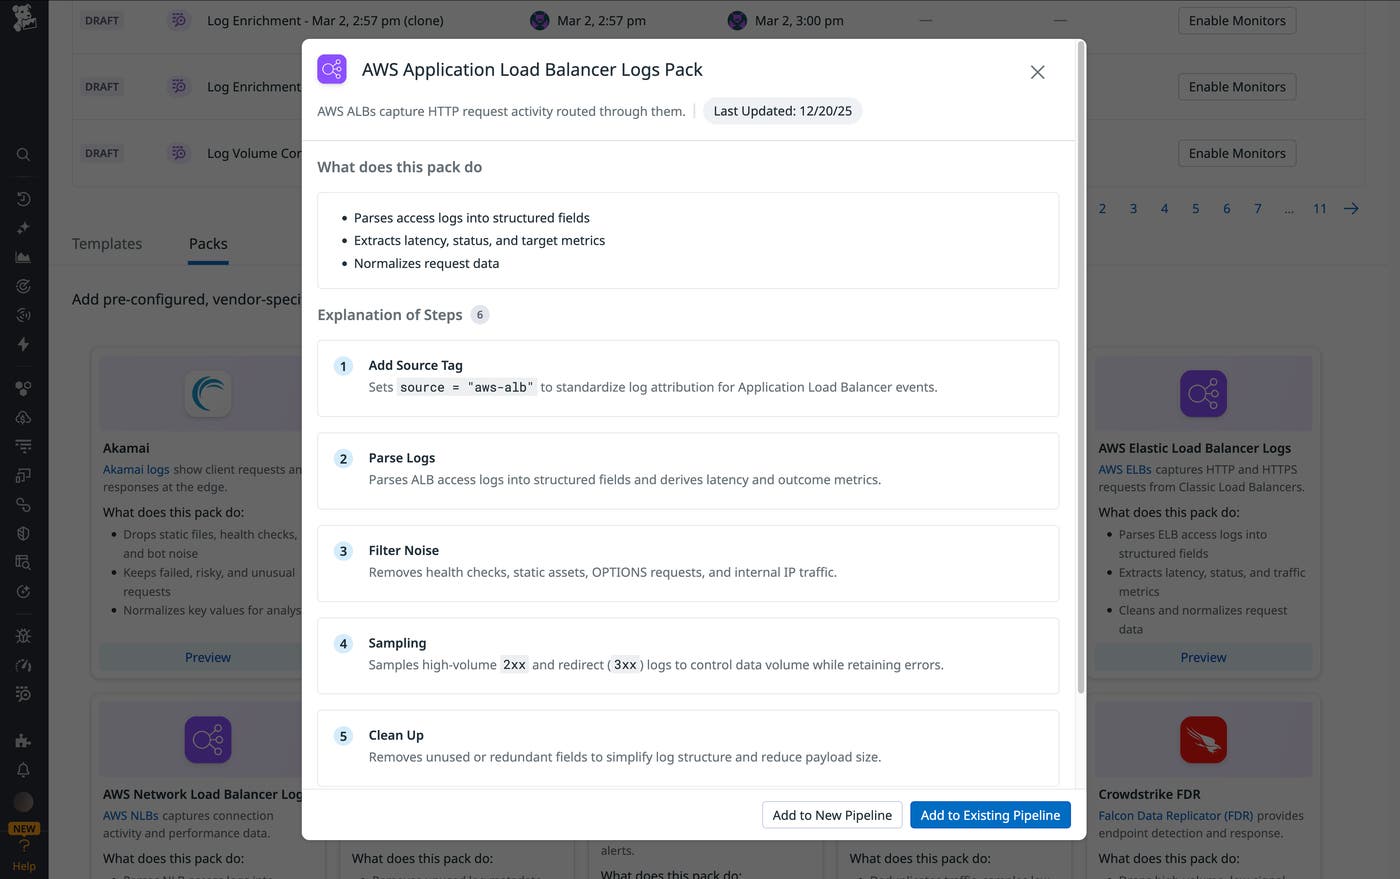
Datadog provides Packs for AWS Application Load Balancer (ALB), Elastic Load Balancer (ELB), and Network Load Balancer (NLB). These Packs can help teams parse their load balancer logs into structured attributes, normalize fields for consistent analysis, sample and filter low-signal, high-frequency traffic while retaining errors and anomalies, and generate metrics from logs for downstream analysis and alerting.
With Datadog Log Management, you can comprehensively ingest, process, and analyze all of your load balancer logs, whether they come from AWS, Azure, Google Cloud, on-premises Envoy proxies, or via the Datadog Agent (including the Datadog Distribution of the OpenTelemetry (DDOT) Collector for OTLP-based log pipelines). Log Management enables you to automatically process logs from all of these sources while controlling costs at scale.
With Logging without Limits™, you can ingest all of your ALB and NLB logs for real-time monitoring and alerting while using exclusion filters to index only the logs you need for long-term troubleshooting (like 5xx errors or failed TLS handshakes) to keep your storage costs at a minimum. Log Pipelines will automatically parse your load balancer logs (space-delimited ALB strings as well as JSON NLB objects) into structured attributes, and you can use Grok Parsers to extract specific fields and parse logs according to custom rules.
Once your logs are structured, you can use Log Analytics to track the key patterns covered above in comprehensive dashboards and monitors. For example, you may want to:
Create a top list of your highest-latency URL paths to set priorities for application performance tuning.
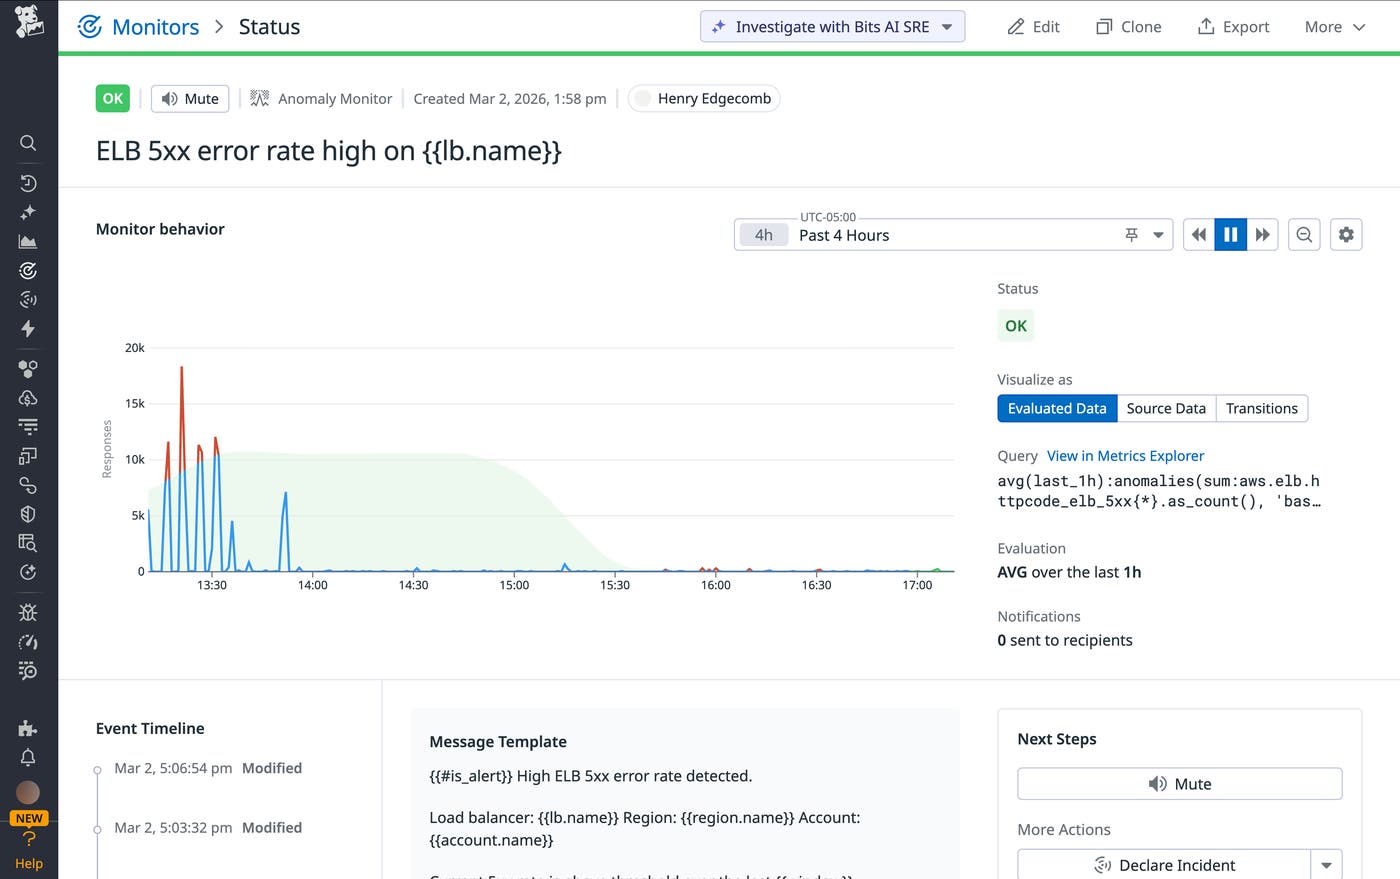
Configure monitors with threshold alerts on the ratio of 5xx errors to total traffic (alerting on a ratio rather than a total count prevents “alert fatigue” during expected traffic surges).
Use our machine learning–driven anomaly detection to automatically alert you when the volume of unhealthyEndpoints deviates from the historical norm for that time of day.
Application and network load balancer logs are critical sources of visibility into modern environments. In this post, we’ve covered the basics of monitoring these logs and shown how Datadog Observability Pipelines and Log Management can help you manage them at scale. To learn more, check out our documentation on Observability Pipelines and Logging without Limits™. If you’re new to Datadog, you can sign up for a 14-day free trial.
此内容由惯性聚合(RSS阅读器)自动聚合整理,仅供阅读参考。 原文来自 — 版权归原作者所有。